International Journal of Innovative Technology and Exploring Engineering (IJITEE) ISSN: 2278-3075, Volume-8 Issue-8, June, 2019
Published By:
Abstract: Wireless Sensor Networks (WSNs) are used in several applications such as data acquisition, monitoring and controlling various parameters. In wired system of sensing the parameters, there is a complexity of installation, problem of space, weight and huge power requirement. Measurement of temperature parameter becomes critically important because of increasing controllable compliance needs in Thermal Plants. Wired system of measuring the temperature parameter of remote places is not that much efficient as the wireless system. Main purpose is to create a system that can autonomously administer the correct data of temperature of different remote places simultaneously in real time. Basically, this paper is written for the measurement of the ambient temperature using wireless technique, which will be a prototype set up for future high temperature measurement. Due to invention of Micro-Electro Mechanical systems (MEMS) technology tiny Wireless modules are nowadays employed at remote places for measurement of temperature parameter. This paper establishes the use of wireless sensor network (WSN) technology for measuring, monitoring and data storing of temperature using Arduino microcontroller, Xbee pro, LM35 temperature sensor and PC. Real time temperature is recorded.
Index Terms: Arduino, MEMS, Temperature, Thermal Plant, Wireless Sensor Network (WSN), Xbee
I. INTRODUCTION
Wireless monitoring system basically means an automated system that simultaneously and continuously records one or more physical parameters such as temperature, relative humidity, wind flow, light intensity, soil moisture etc., at many different predefined places. Such type of wireless monitoring system is deployed where the wired system is quite complex and inefficient to be applied. Wireless monitoring of any remote sensitive environment helps to avoid accident and on the other hand helps to increase safety and security. Monitoring temperature is an important parameter of a wide range of quality assurance applications. Detection by monitoring would provide an early warning of initial problems, helping for the planning and scheduling of maintenance programs, hence minimizing relevant costs. Wireless sensor network (WSN) has revolutionized the field of monitoring and remote sensing. In this paper temperature sensor (LM35) is used to sense the environmental
Revised Manuscript Received on June 05, 2019
R.K.Dhammi, Phd Scholar, Amity University, Noida, India. Working in Mechatronics department in Delhi Institute of Tool Engineering, New Delhi, India
K.M.Soni, Amity School of Engineering and Technology, Amity University, Noida, India.
S. Selvam, Operations department National Power Training Institute (NPTI), Neyveli, Chennai, India.
Shubham Thakur, Department of Application Engineering, Micromatic Grinding Technology, Ghaziabad, India
[image:1.595.322.543.276.384.2] [image:1.595.311.531.432.559.2]temperature. Arduino microcontroller is used to make complex computation of the parameters and then to receive the data wirelessly by using Xbee pro module connected together with shield at the receiver end. At transmitter section Xbee pro module connected with temperature sensor LM35, is used to transmit the temperature data [Fig. 1(a)]. At the receiving end temperature data is received, monitored and stored in real time using Xbee radio and Arduino board [Fig. 1(b)].
Fig. 1(a). Transmitting end: Router end
Fig. 1(b). Receiving end: Coordinator end
II. RELATEDWORK
Poornendu K et al [1] presented a paper on Data Acquisition and Controlling in Thermal Power Plants using a Wireless Sensor Network and LabVIEW. The system consists of both hardware and software platform. The hardware platform consists of a PIC microcontroller and a wireless transceiver. The controller gathers the data and processes it. Software part consists of LabVIEW which receives the data through the serial port and Virtual Instrument System Architecture (VISA). Sriram kagitha et al [2] described in their paper that how to control and monitor the temperature, pressure and flow of steam etc. in thermal plants. For this they have used Wireless sensors along with
ZigBee network and GSM technology. Sensor data is communicated in work
Real Time Wireless Data Collection using Xbee
Radios and Arduino
R.K. Dhammi, K.M. Soni, S. Selvam, Shubham Thakur
LM 35
TEMP.
SENSOR
XBEE PRO DC
CONVERTER POWER
place and to remote place using ZigBee network and GSM technology respectively. Vongsagon Boonsawat et al [3] presented a paper on embedded wireless sensor network prototype system for monitoring of temperature in a building. In this system present and past temperature readings of different rooms are taken. In each room there is one WSN node. Each WSN node consists of a microcontroller on Arduino board and an Xbee wireless communication module based on the IEEE 802.15.4/Zigbee standards. Vijay S. Kale et al [4] presented a paper which describes how to collect and monitor the temperature data using Arduino microcontroller, Xbee S2 and temperature sensor. They have used the Arduino board, Xbee radio and temperature sensor at remote place and one Xbee radio at coordinator end which is connected to PC where data is collected. Madhukar S. Chavan et al [5] implemented ARM based temperature controlling and monitoring system using LPC2148 kit and temperature sensor LM35. To control the temperature wirelessly they used a pair of Xbee radios. Anil.H.Sonune et al [6] developed an air pollution monitoring system using WSN based on ZigBee network. Suresh Y. Sankpal et al [7] presented a paper in which they used two Xbee wireless modules and microcontroller to monitor different data points of the capacitor as microfarad rating and different temperature. PM Korake and M.K. Bhanarkar [8] proposed a monitoring system for grapes environmental condition WSN technology. It has been observed that in most of the papers the data collection technique used was not promising. Microcontroller along with Xbee was used at remote place (Router end) [which increases the complexity at remote end] while Xbee is used as Coordinator connected with PC where we can not store the data in real time. In such type of approach there is no flexibility in modifying the code of software.
In this paper, this problem has been overcome by using Xbee radio at remote place along with sensor module. Data monitoring and storing is being done with the help of microcontroller and Xbee radio at Coordinator end. Arduino board is connected to PC where we have the flexibility to modify the coding in software. Range tested in this set up was pretty high. It was possible to measure the remote temperature data up to a distance of 200 meters under obstacles.
III. HARDWARECOMPONENTS
(A) Arduino UNO
Fig. 2. Arduino UNO
ATmega328P microcontroller is used in Arduino/Genuino Uno board. [9].There are 14 digital input/output pins as shown in Fig. 2. Xbee along with shield is fitted in the
Arduino Board. Arduino UNO has 6 analog pins labeled as A0 through A5 having 10 bits resolution.
(B) Xbee
Xbee is a brand of radio that supports a variety of communication protocols. XBee is a feature-rich RF module which makes it a very good solution for WSN designers [10]. It has Capability to communicate with microcontroller through UART serial communication; Digital input on one Xbee can be reflected on the digital output of another, thus controlling the output of the second Xbee.
In this set up we have used Xbee Pro S2 radio module. This module offers the capability for long distance communication. The Xbee modules offer simple AT or an API mode of operation. Xbee modules function in the license-free 2.4 GHz ISM band. Due to this technology users can quickly set up a network [11]. Pin diagram of Xbee module is shown in Fig. 3.
Fig. 3. Xbee Pro Pin diagram
(C) Xbee shield
International Journal of Innovative Technology and Exploring Engineering (IJITEE) ISSN: 2278-3075, Volume-8 Issue-8, June, 2019
[image:3.595.381.491.82.155.2]Published By:
Fig. 4. Xbee Shield/Xbee adapter board
(D) Micro SD card module
In our setup we are using micro SD card module to store the real time temperature data which is compatible with arduino.The temperature data is stored as a text document on the computer to analyze further.
Fig. 5. Connecting SD Card with Arduino UNO
(E) LM35 Temperature Sensor
LM35 is a linear sensor with scale factor as +10 mV/°C and accuracy as 0.5°C at 25°C. It works between temperature range rated as −55°C to 150°C. It is suited for remote applications. In our setup we have connected LM35 directly with remote Xbee pro module; hence sensor senses temperature and sends it to remote Xbee radio which sends data to coordinator end for monitoring.
Fig. 6: Temperature Sensor LM 35
(F) LM2936S DC to DC converter:
The LM2936 is an ultra-low quiescent current regulator having low dropout voltage and low current in the standby mode. In our setup we have used LM2936S at remote end to give desired 3.3 V supply to Xbee module. The input of
LM2936S is 12 V DC coming through external battery and the output is 3.3 V which is given to remote Xbee module.
Fig. 7. DC to DC Converter: LM 2936
[image:3.595.56.241.265.473.2]IV. TRANSMITTER SETUP
Fig. 8 shows the diagram for transmitting end of Experiment set up. Basically, at the transmitting or remote end the circuit consists with one Xbee pro module, temperature sensor (i.e. LM35), 12 V power supply, and LM2936S DC to DC converter to provide 3.3 V to Xbee pro by taking 12 V DC as an input from the battery. Therefore, under working condition (when power is ON) the temperature sensor LM35 senses the temperature of its surrounding and provides its reading at its output pin. This output of the temperature sensor is fed on to the pin no 17 (we can choose any of digital I/O) of the remote Xbee module. Hence, that temperature data in the form of packets is transmitted to receiver end.
Fig. 8: Transmitting end
[image:3.595.329.528.353.477.2]V. RECEIVER SETUP
[image:3.595.314.546.593.833.2]Fig. 9. Receiving end
Therefore, under working condition(when power is ON) the temperature data is wirelessly received in the form of data packet on the coordinator Xbee and that Xbee transmits the serial data on the receiver pin Rx of the arduino UNO microcontroller. Therefore the required data can directly be monitored on the serial monitor platform of arduino IDE. Then Micro SD card module is added to store all the data to SD card as a text file which can easily be read and analyzed on computer.
VI. ALGORITHM
VII. XCTUSOFTWARE
XCTU is free, multi-platform application software which is compatible with Windows, MacOS and Linux operating systems. This software is used to configure the Xbee radios. Developers can interact with Digi RF modules using this software through a simple-to-use graphical interface. It includes new tools that make it easy to set-up, configure and test Xbee RF modules [13]. Fig. 10(a) and 10(b) show the configuration of Xbee parameters and the basic change in the configuration of Xbee parameters in XCTU software respectively.
Fig. 10(a). Configuration of Xbee parameters
The basic requirement to configure the two Xbee pro modems (one at coordinator end and other at receiver end) is that
(i)PAN ID of both should be same.
(ii) Both should be in AT/API command mode.
Fig. 10(b). Configuration of Xbee using XCTU software.
XIII. DATA STORAGE
While monitoring the temperature data on the serial monitor, the data is stored simultaneously on Include header files
Declare the variables
Initialize the set up to read the serial data and SD Card
Is received frame count >=21
Is serial data=0x7E Exit
Exit
Skip ahead to analog data
Read analog data
Store Temp. data in SD Card
[image:4.595.316.540.203.367.2] [image:4.595.313.544.461.685.2]International Journal of Innovative Technology and Exploring Engineering (IJITEE) ISSN: 2278-3075, Volume-8 Issue-8, June, 2019
Published By: the micro SD card connected to Arduino module. This data is
shown in Table 1 and can easily be seen and analyzed at any time.
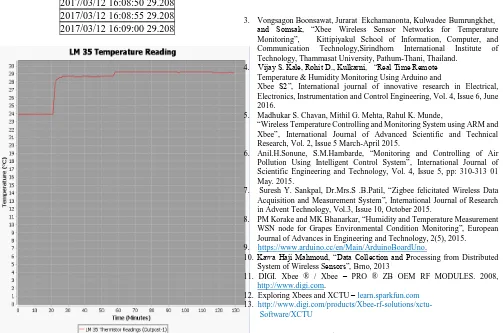
IX. RESULT
The measurement of temperature is carried out and a plot as shown in Fig. 11 is drawn where the parameter value is on Y-axis and time is on X-axis.
Table 1. Observed real time data:
2017/03/12 15:59:27 23.930 2017/03/12 15:59:34 23.930 2017/03/12 15:59:39 23.930 2017/03/12 15:59:46 23.930 2017/03/12 15:59:51 23.930 2017/03/12 15:59:56 23.930 2017/03/12 16:00:01 23.930 2017/03/12 16:00:06 23.930 2017/03/12 16:00:11 23.930 2017/03/12 16:00:17 23.930 2017/03/12 16:00:22 23.930 2017/03/12 16:00:27 23.930 2017/03/12 16:00:34 23.930 2017/03/12 16:00:40 23.930 2017/03/12 16:00:45 23.930 2017/03/12 16:00:52 23.930 2017/03/12 16:00:58 23.930 2017/03/12 16:01:03 23.930 2017/03/12 16:01:08 23.930 2017/03/12 16:01:14 23.930 2017/03/12 16:01:19 23.930 2017/03/12 16:01:24 23.930 2017/03/12 16:01:36 28.270 2017/03/12 16:01:47 28.504 2017/03/12 16:01:52 28.504 2017/03/12 16:01:58 28.739 2017/03/12 16:02:03 28.622 2017/03/12 16:02:08 28.739 2017/03/12 16:02:14 28.739 2017/03/12 16:02:19 28.739 2017/03/12 16:02:27 28.739 2017/03/12 16:02:32 28.739 2017/03/12 16:02:37 28.622 2017/03/12 16:02:43 28.622 2017/03/12 16:02:49 28.622 2017/03/12 16:02:54 28.622 2017/03/12 16:02:59 28.622 2017/03/12 16:03:04 28.739 2017/03/12 16:03:09 28.739 2017/03/12 16:03:14 28.739 2017/03/12 16:03:20 28.739 2017/03/12 16:03:27 28.622 2017/03/12 16:03:32 28.622 2017/03/12 16:03:37 28.622 2017/03/12 16:03:42 28.622 2017/03/12 16:03:48 28.622 2017/03/12 16:03:53 28.739
2017/03/12 16:03:58 28.622 2017/03/12 16:04:03 28.739 2017/03/12 16:04:08 28.739 2017/03/12 16:04:13 28.739 2017/03/12 16:04:21 28.739 2017/03/12 16:04:26 28.739 2017/03/12 16:04:31 28.739 2017/03/12 16:04:38 28.739 2017/03/12 16:04:44 28.739
Table 1. (contd.)
2017/03/12 16:04:51 29.208 2017/03/12 16:04:56 29.208 2017/03/12 16:05:01 29.208 2017/03/12 16:05:06 29.208 2017/03/12 16:05:11 29.208 2017/03/12 16:05:17 29.208 2017/03/12 16:05:22 29.208 2017/03/12 16:05:27 29.208 2017/03/12 16:05:32 29.208 2017/03/12 16:05:37 29.208 2017/03/12 16:05:43 29.208 2017/03/12 16:05:48 29.208 2017/03/12 16:05:53 29.208 2017/03/12 16:05:59 29.208 2017/03/12 16:06:05 29.208 2017/03/12 16:06:12 29.208 2017/03/12 16:06:17 29.208 2017/03/12 16:06:22 29.208 2017/03/12 16:06:29 29.208 2017/03/12 16:06:34 29.208 2017/03/12 16:06:39 29.208 2017/03/12 16:06:45 29.208 2017/03/12 16:06:50 29.208 2017/03/12 16:06:56 29.208 2017/03/12 16:07:01 29.208 2017/03/12 16:07:06 29.208 2017/03/12 16:07:11 29.208 2017/03/12 16:07:18 29.208 2017/03/12 16:07:23 29.208 2017/03/12 16:07:28 29.208 2017/03/12 16:07:33 29.208 2017/03/12 16:07:39 29.208 2017/03/12 16:07:44 29.208 2017/03/12 16:07:49 29.208 2017/03/12 16:07:54 29.208 2017/03/12 16:08:01 29.208 2017/03/12 16:08:06 29.208 2017/03/12 16:08:11 29.208 2017/03/12 16:08:16 29.091 2017/03/12 16:08:22 29.208 2017/03/12 16:08:29 29.208 2017/03/12 16:08:35 29.208 2017/03/12 16:08:40
29.208 2017/03/12 16:08:45
2017/03/12 16:08:50 29.208 2017/03/12 16:08:55 29.208 2017/03/12 16:09:00 29.208
Fig. 11. Graph between Temperature and Time
X. CONCLUSION
In this paper, we have successfully demonstrated the deployment of Xbee module at remote end along with sensor module. While we have kept the Xbee, Arduino on coordinator side where received data were monitored in real time on computer screen and were stored also in a text file. Based on this data a plot was drawn which shows the variation of temperature with time. In this approach there is flexibility in changing the coding in software. A simplified temperature monitoring system with least number of components and less complexity has been developed. Most importantly the temperature monitoring application turned out to be very user – friendly. It is considerably very cheap and simple to measure remote area temperature data compared to a conventional setup. Such wireless system will prove to be revolutionary for Thermal Plants, Agriculture, Health Care, Industries, Storage areas and many more remote and critical areas.Range tested in our set up was pretty high. It was possible to measure the remote temperature data up to a distance of 200 meters under obstacles.
REFERENCES
1. K. Poornendu, Manoj G, Kannan E P,”Data Acquisition and Controlling in Thermal Power Plants using a Wireless Sensor Network and Lab View”, International Journal of Engineering Research & Technology (IJERT),Vol. 4, Issue 07, July-2015. 2. Sriram kagitha, T.S.S.Phani, A.Pravin,”Sensor Network based
Thermal Power Plant Interlock Control and Remote Monitoring System”, International Journal of Innovative Research in Science, Engineering and Technology, Vol. 3, Issue 12, December 2014.
3. Vongsagon Boonsawat, Jurarat Ekchamanonta, Kulwadee Bumrungkhet, and Somsak, “Xbee Wireless Sensor Networks for Temperature Monitoring”, Kittipiyakul School of Information, Computer, and Communication Technology,Sirindhorn International Institute of Technology, Thammasat University, Pathum-Thani, Thailand.
4. Vijay S. Kale, Rohit D., Kulkarni, “Real Time Remote Temperature & Humidity Monitoring Using Arduino and
Xbee S2”, International journal of innovative research in Electrical, Electronics, Instrumentation and Control Engineering, Vol. 4, Issue 6, June 2016.
5. Madhukar S. Chavan, Mithil G. Mehta, Rahul K. Munde,
“Wireless Temperature Controlling and Monitoring System using ARM and Xbee”, International Journal of Advanced Scientific and Technical Research, Vol. 2, Issue 5 March-April 2015.
6. Anil.H.Sonune, S.M.Hambarde, “Monitoring and Controlling of Air Pollution Using Intelligent Control System”, International Journal of Scientific Engineering and Technology, Vol. 4, Issue 5, pp: 310-313 01 May. 2015.
7. Suresh Y. Sankpal, Dr.Mrs.S .B.Patil, “Zigbee felicitated Wireless Data Acquisition and Measurement System”, International Journal of Research in Advent Technology, Vol.3, Issue 10, October 2015.
8. PM Korake and MK Bhanarkar, “Humidity and Temperature Measurement WSN node for Grapes Environmental Condition Monitoring”, European Journal of Advances in Engineering and Technology, 2(5), 2015. 9. https://www.arduino.cc/en/Main/ArduinoBoardUno.
10. Kawa Haji Mahmoud, “Data Collection and Processing from Distributed System of Wireless Sensors”, Brno, 2013
11. DIGI. Xbee ® / Xbee – PRO ® ZB OEM RF MODULES. 2008, http://www.digi.com.
12. Exploring Xbees and XCTU – learn.sparkfun.com 13. http://www.digi.com/products/Xbee-rf-solutions/xctu- Software/XCTU
AUTHORSPROFILE
First Author R.K.Dhammi did his B.E. in Electronics and Communication from M.BM. Engineering College, University of Jodhpur, Rajasthan, India in 1985. Completed his M.B.A and Post Graduation in Information Technology from SMU, India and presently pursuing his Ph. d. from Amity University, Noida,India. He is Deputy Director (Technical) and HoD (Mechatronics) in Delhi Institute of Tool Engineering, Govt. of Delhi, New Delhi, having 32 years of Academic and Industrial experience. He is having expertise in Programmable Logic Controller and Wireless Sensor Networks. He has the vast experience of C-DOT Technology Telephone Exchange. He is author/co-author of six papers in referred conferences and journals. He has published one book on “Basic Electronics” for CBSE students. He is life member of IETE and IoE.
Second Author Prof. (Dr.) K.M. Soni did his B. E. in Electrical Engineering & M.E. in Control & Instrumentation from Motilal Nehru National Institute of Technology, Allahabad, India & PhD in Electrical Engineering from Jamia Millia Islamia, A central University, New Delhi, India. Dr. Soni is Professor in Amity School of Engineering & Technology, Dy. Dean (Engg. & Tech.), Advisor (Amity School of Architecture & Planning and Amity School of Design) and also In-charge of Ph.D. Programmes in AUUP. He is the author of books on Circuits and Systems, Signals and Systems, Basic System Analysis, Network Analysis and Synthesis and Advanced Control Systems etc. Also, He is author/co-author of over 25 technical research papers in refereed conferences and journals and served as Reviewer, Programme Committee Member, Session Chair of many National & International Conferences in India and Abroad and also served as Reviewer of several journals. He is Life Member of Indian Society for Technical Education (ISTE), Institution for Electronics and Telecommunication Engineers (IETE), International Journal of Engineering Research and Industrial Applications (IJERIA), CSI,
International Journal of Innovative Technology and Exploring Engineering (IJITEE) ISSN: 2278-3075, Volume-8 Issue-8, June, 2019
Published By: Power System, Advanced Control Systems, Signal Processing and other
related areas.
Third Author Dr. S.Selvam graduated from
Coimbatore Institute of Technology (CIT), India in 1990 in Electronics & Communication Engineering. He did his M.S in System and Information. He did his Ph.D from Jamia Millia Islamia, A central University,New Delhi. He is working as Director (Operation) in National Power Training Institute (NPTI), Neyveli,Chennai. He is having vast experience of Academics and Industry. He worked as a Design Engineer in Centre for Electronics Design and Technology (CEDT) for 4 ½ years. He has an expertise in C & I of power stations and Power plant replica Simulators. He is author/co-author of around 25 technical research papers in refereed
conferences and journals.
Fourth Author Shubham Thakur received his
B.tech. Mechatronics degree in Engineering from the Guru Govind Singh Indraprastha University, India, in 2017, and the. Diploma in Electrical Engineering
from the Guru Tegh Bahadur Institute of Technology, New Delhi, India, in 2014. In 2017, he joined the Department of Application Engineering, at Micromatic Grinding Technology, as an