A New Plug in EV Strategy for Mitigation of Power
Variations in Distribution systems
J.T. Ramalingeswar, K. Subramanian
Abstract–Increasing penetration levels of renewable energy sources in electrical grid distribution systems causes raped power variations drawing from the penetration levels variation in electrical vehicle charging creates the problem in the unity grid. In this paper a new artificial intelligence control technique is introduced in electrical vehicles in order to reduce the power variations caused by the solar power and high low demand. The fluctuations in electrical vehicle scheduling with energy storage has been studied the main effort is the minimizing of power variations in slack bus from the specified value and high utilization storage capability. Energy forecasting and renewable power generation are major considerations in electrical vehicle scheduling. The fuzzy technique is used to define power storage rate of electrical vehicles. Buttery life time was taken as key aspect and parameters that cause buttery degradation are considered while prioritizing PEVs for grid support. However, primary purpose of PEV (to travel) is given highest priority by ensuring maximum energy level before starting a trip.
Index Terms –PEV, ESU, Fuzzy controller, load scheduling and flattening.
Nomenclature
T Time period
Α Battery drain rate
Ƞ Efficiency of storage unit
P Charging and discharging ratio
Q Effective storage of battery
SoC Sate of Charge
DoD Discharging depth
𝑃𝑟𝑎𝑡𝑒𝑡 Charge rate
𝑃𝑟𝑎𝑡𝑒𝑚𝑖𝑛 Storage unit power rating
𝑃𝑟𝑎𝑡𝑒𝑚𝑎𝑥 Storage unit maximum power rating
𝑃𝑟𝑎𝑡𝑒𝑑𝑖𝑓 Change of rate of power
𝑃𝑟𝑎𝑡𝑒
𝑟𝑒𝑓 ,𝑡 Reference Power
P𝑙𝑜𝑎𝑑𝑡 Power at average load demand P𝑒𝑠𝑡.𝑐,P𝑒𝑣𝑡.𝑐 Charging rate of EV and ESU 𝑬𝑺𝒊𝒏, 𝑬𝑽𝒊𝒏 ES and EV storage capacity 𝑺𝒐𝑪𝑬𝑺, 𝑺𝒐𝑪𝑬𝑽 ES and EV energy vectors
Revised Manuscript Received on November 06, 2019.
J T Ramalingeswar,School of Electrical Engineering, VIT University, Vellore, Indi jt.ramalingeswar2015@vit.ac.in
K.Subramanian, School of Electrical Engineering, VIT University, Vellore, India ksubramanian@vit.ac.in
ESN , EVM Energy storage vectors at grid side 𝐸𝑏𝑎𝑙𝑡 Required energy at time t 𝐸𝑒𝑠𝑐𝑎𝑝 ,𝑖 Energy storage unit vector 𝐸𝑒𝑣𝑐𝑎𝑝 ,𝑖 Vehicle energy capacity
𝐸𝑒𝑠𝑖,𝑡 Levels of energy at time t 𝐸𝑒𝑣𝑖,𝑡 Plug-in- EV energy
𝐸𝑒𝑠(𝑡)4𝑑𝑖𝑠ℎ ESU energy available for discharge in tth
interval
𝐸𝑒𝑠(𝑡)4𝑐ℎ𝑟𝑔 Available energy of ES
𝐸𝑒𝑣(𝑡)4𝑑𝑖𝑠ℎ EV energy available
I. INTRODUCTION
Electric vehicle unscheduled charging and discharging creates many drawbacks to the utility operation which cause frequency of the grid and voltage deviation will occur. Photo voltaic systems generates maximum power at afternoon time is an another consideration to handle the distribution systems. ICT having an advantage of its effect on electrical vehicles integration [1]. Electrical vehicles can make simple grid ancillary utilities which are load fattening grid support electrical vehicle charge cost reduction. The integration of electric grid and renewable energy sources such as solar, tidal, wind and electrical vehicle have more advantages [2]. Wind power generation mainly depends on atmospheric conditions and solar power generation will depend on sun light irradiation intensity and temperature conditions. However this power generations are not constant and electrical vehicle plugging time period is and defendable. Hence this are the constrains which makes the grid complicity due to the overall power generation system efficiency get reduced.
voltage unbalance, huge power loss and higher frequency fluctuations. This disturbances occurred due to the high energy density and less cost of electrical vehicle [4].
In future excess member of electrical vehicles are going to be connected to the distribution systems. The uncertainty in electrical vehicle causes unbalanced charging in patterns. In other hand electrical vehicle will act as a shunt compensator with that the reactive power variation can be balanced in distribution grid connected systems [5]. Most of researchers working on multi way of using electrical vehicles for grid side management. The combination of electrical vehicle and energy storage systems playing a major role in order to determine the level of participation and flexibility in power clarity improvement.
Most of the researchers have been developed different technologies in order to make the electrical vehicles store energy by using different renewable sources. Which are wind and solar photo voltaic systems. In article 11, the authors proposed a technology to utilize the electrical vehicle charging with the wind power generation without fluctuating the power. The author marra proposed a technology in order to mitigate the impact of electrical vehicle on solar power generation. Electrical vehicle generation energy is used to mitigate the PV power fluctuation instead of using for buttery storage. The author alam has been introduced a technology for supporting the peak-peak load at night time and it is reduced PV impact on energy storage o buttery without using electrical vehicle [6]. Increasing number of electric vehicles on one hand and increases uncertainty of charging timings on the other hand imposes frequency deviations in the grid. The exploitation of bulk number of PEVs can be a resourceful thing at distribution level to mitigate the impact of solar and wind sources. Solar PV produces maximum power during noon time whereas maximum residential power demand will appear at evening and morning timings [7]. The excess amount of energy produced (during mid-day) by solar PV will be directed to grid (reverse power flow) and hence causes voltage rise. To ensure continuity of power supply from solar PV there must be sufficient storage capacity installed along with it to mitigate the fluctuations. And this is also true for wind power plant. So, to withstand fluctuations caused by both RES and load, large, low cost ESUs needed. To reduce extra investment on storage units, available storage capacity with PEVs can be used which needs no extract investment. Another advantage of storage units‟ distribution network is instantaneous power demand fluctuations can be compensated whereas conventional generation units takes much time [8].
In this article the unit commitment of plugging electrical vehicle and energy storage is explained by consideration of the features are variation demand and high charging capability.
II. DETERMINATION OF FLUCTUATIONS IN SOLAR PV AND LOW DEMAND
At distribution level, all the residential loads will be concentrated at evening timings and morning timings, whereas the solar PV output power will be very less or zero during these two timings and also throughout the night. Coincidence of all the vehicles charging at a particular time
zone affects the voltage and frequency and leads to power system instability. Basically electrical vehicles charged during night times as a result the adding of electrical vehicle charging into load requirement causes most bad situation occurred due to the rapid fluctuations in power demand and frequency deviations. As a result, due to this effects caused by the electrical vehicle will be converted to advantage with planning of electrical vehicle plugging. This process can be obtained by strategic commitment at right time. In addition the charging and discharging scheduling can be applied in a proper manner. The electrical vehicle and energy storage systems are the major support to the grid in order to overcome the effect of renewable energy sources fluctuations. The author Danish has considered an active distribution system with to voltage level 20kb and 400v. In addition, four loads, five photo voltage systems, 13 electrical vehicles and three different energy storage units [9].
Consumption power (Loads and Storage (charging)) is taken as „-ve‟ and generation power (RES and Storage (discharging)) is taken as „+ve‟. The balance in energy which is the algebraic sum of consumption and generation need to supplied (if deficit) or consumed (if excess) by grid. It is considered that the grid is always needed to supply some amount of energy to the distribution network. It means that the total generation in the active distribution network won‟t increase the load demand. Now the goal is to decrease the fluctuations in power flowing from the grid at the maximum possible extent by of exploiting ESU and PEV storage capacity.
In this article, a complete hour is divided into four time intervals and it is a time duration of fifteen minutes. The aggregate power source and load is given in Eq.1. From equation 1 right hand side part indicates photo voltaic power and left hand side part indicates energy storage. Electrical vehicle charging power and energy storage discharging power at fifteenth minute is given in Eq.2.
Pbalt = Prest − Ploadt − Pest.c− Ppevt,c + Pest,dc+ Ppevt,dc (1) Ebalt = Pbalt
t+15
t=1 t ∗ dt (2)
E
sneedt= E
balt+1− E
specslack(3)
III. DETERMINATION OF EXISTED ENERGY
STORAGE CAPACITY
A. Electrical Vehicle and Energy Storage Penetration.
the constraints in order to determine the life time and performance of the buttery. Buttery life time will depends on so many constraints and it is very complex problem to Annalise for a particular electrical vehicle application. In that the one as objective is to determine the rated power and energy fluctuations in an hour. The availability of energy storage capacity, energy required to store the energy at day time is given in below equations.
The storage capacity of energy is calculated from the energy storage levels. The energy storage levels during a time period t is followed as shown below.
𝑃𝑟𝑎𝑡𝑒𝑚𝑖𝑛 ≤ 𝑃 𝑡 ≤ 𝑃𝑟𝑎𝑡𝑒𝑚𝑎𝑥 (4)
𝑃𝑟𝑎𝑡𝑒𝑡 ≤ 𝑃𝑟𝑎𝑡𝑒𝑡−1 − 𝑃𝑟𝑎𝑡𝑒
𝑟𝑒𝑓 (5)
𝐸𝑒𝑠 (𝒕)4𝑑𝑖𝑠 = { 𝐸𝑒𝑠 𝑖,𝑡
− [0.2 ∗ 𝐸𝑒𝑠 𝑐𝑎𝑝 ,𝑖
] 𝑁
𝑖=1 } (6) 𝐸𝑒𝑣 𝒕 4𝑑𝑖𝑠 = { 𝐸
𝑒𝑠𝑖,𝑡 − [0.2 ∗ 𝐸𝑒𝑠 𝑐𝑎𝑝 ,𝑖
]} 𝑀
𝑖 (7)
Fig. 3.1. Power and energy fluctuations (a) Load demand (24 hour scale) (b) Energy Demand (15 minute intervals) (c) Energy deviation on the grid over a specified value (d) Available storage capacity for charging and discharging.
𝐸𝑒𝑠(𝒕)4𝑐𝑟𝑔 = [0.8 ∗ 𝐸𝑒𝑠 𝑐𝑎𝑝 ,𝑖
− 𝐸𝑒𝑠𝑖,𝑡 } 𝑁
𝑖=1 (8)
𝐸𝑒𝑣(𝒕)4𝑐𝑟𝑔 = [0.8 ∗ 𝐸𝑒𝑣 𝑐𝑎𝑝 ,𝑖
− 𝐸𝑒𝑣𝑖,𝑡 } 𝑀
𝑖=1 (9)
𝐸𝑎𝑣𝑎𝑖𝑙 (𝒕)4𝑑𝑖𝑠𝑐 = 𝐸𝑒𝑠4𝑑𝑖𝑠 (𝑡) + 𝐸𝑒𝑣4𝑑𝑖𝑠 (t) (10)
𝐸𝑎𝑣𝑎𝑖𝑙 (𝒕)4𝑐𝑎𝑟𝑔 = 𝐸𝑒𝑠4𝑐𝑎𝑟𝑔(𝑡) + 𝐸𝑒𝑣4𝑐𝑎𝑟𝑔(t) (11)
𝐸𝑠𝑎𝑣 𝑎𝑖𝑙𝑡 =
𝐸𝑎𝑣𝑎𝑖𝑙 (𝒕)4𝑑𝑖𝑠𝑐 for discharing
𝐸𝑎𝑣𝑎𝑖𝑙 (𝒕)4𝑐𝑎𝑟𝑔 for charing (12)
𝐸𝑠𝑛𝑒𝑒𝑑𝑡 =
For Discharing ; if p > 1
For Charing ; if p < 1 (13)
In Fig. 3.1(a), load demand (equation. (2.1)) is shown in a 24 hour scale, and the same is represented in terms of energy (equation. (2.2)) in Fig.3.1 (b). Deviation from the specified energy drawing from the grid is represented in terms of energy deviations for each interval „t‟ (Fig.3.1(c)).
IV. ELECTRICAL VEHICLE MOBILITY MODEL
Electrical vehicle mobility model gives information regarding availability of vehicle during the day and change in its SoC. To determine the electrical vehicle arrival time period and departure time period by using below equation.
Fig. 4.1. (a) PDF to commute (b) CDF to commute (c) Change in SoC of PEV-5 (d) PEV-5 availability during a
day
As an example, probability distribution function (PDF) and CDF are shown in Figure. 4.1(a) and 4.1(b) for commute trip (for PEV-5). Unavailability (away/trip) of the vehicle can be identified as the time zone where CDF value is in between its minimum and maximum. The time instant where the CDF is having its first non-zero value is taken as the starting time of a trip (Fig. 4.1(b)).
After the trip, vehicle‟s battery SoC change for a particular PEV (PEV 5) can be seen in the figure. 4.1(c) which is indicated as a negative value as it represents loss of SoC or discharging mode. Vehicle unavailability (away/trip) of PEV 5 is
[image:3.595.61.284.189.587.2] [image:3.595.313.543.244.592.2]indicates away and „0‟ indicates available at plug point/home. As the main purpose of the vehicle is to travel, ancillary support should not disturb the owner regular trips. In this regard, the prime constraint of PEV is to ensure maximum SoC before it starts for a trip. The SoC of the PEV at the time when PEV arrives at plug point after trip is calculated using equation (4.1). SoC and Pratet is taken as zero during trip hours which inturn helps to eliminate that particular PEV from grid support. The effect of unexpected trip delays and unscheduled plugging (mostly for charging) are not considered in this work.
V. COORDINATION OF ELECTRIC VEHICLE AND
ENERGY STORAGE UNIT
If the electric vehicle in charging mode, the rate of change of power is greater than zero and it indicates that the charging space available in storage unit. In other hand, the electric vehicle in discharging mode then the rate of change of power is less than one which indicates that the storage capacity of electricity vehicle discharge. In this article, the strategy is proposed to control the charging and discharging rate of power. The fluctuations in storage power is shown in Fig.5.1.
[image:4.595.320.536.237.593.2]In this article, it is desirable to maintain power drawing from grid closer to specified value in order to reduce the spinning reserves by the utility. In this work an attempt is made to effectively utilize all available storage capacity to maintain power drawing from the grid as flat as possible and closer to the specified value. Flowchart (Figure. 5.2) explains prioritization procedure while selecting storage units for grid support.
Fig. 5.1. Power fluctuations of slack bus
The flow of algorithm is explained as a flow chart in Figure. 5.2. It is assumed that the PEVs are under DSO monitoring control all the time and are authenticated for grid support. Smart tariff and incentives for grid support are
not considered in this work.
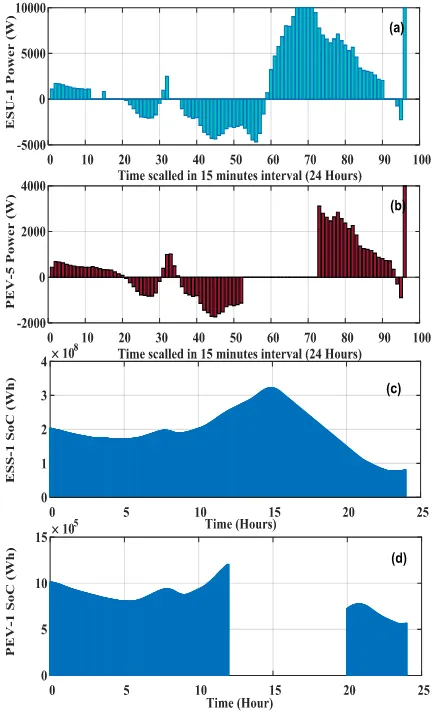
VI. SIMULATION RESULTS AND DISCUSSION Charging and discharging power rates for ESU and PEVs are shown in Fig. 6.1(a & b). Power rate of ESU-1 is shown in Fig. 6.1(a) and power rate of PEV-5 is shown in Fig. 6.1(b). During away period (during trip) PEV is assumed to have zero power rate and zero SoC level. This assumption is made in order to exclude respective PEV. Respective Energy or SoC levels of storage units are shown in Fig. 6.1(c & d). SoC level of ESU-1 is shown in Figure 6.1(c) and that of PEV-5 is shown in Figure. 6.1(d). The energy level of PEV before the trip time was ensured to be up to 80% of its maximum capacity (trip requirement).
Fig. 6.1. Storage unit’s charging and discharging rates(‘-‘ Charging, rates(‘-‘+’ Discharging): (a) ESS-1 (b) PEV-5 and
[image:4.595.68.284.479.595.2]Acquire Data: P_load, P_gen(solar PV), SoC_es, PEV_avail, SoC_pev.
START
Calculate E_bal(t), Eavg_pre, E_avail, p and q (using equations(1,2 and 3))
p < 1
YES NO
q > 1 q < 1
Apply constraints (equations 3, 7 and 8) and choose ESS and PEV units to participate in Grid Support (If PEV is away during time ‘t’ then it is excluded )
CHARGING DISCHARGING
YES
YES NO NO
EXCESS DEFICIT
DEFICIT BEXCESS
Use all available capacity for CHARGING
Use all available capacity for DISCHARGING Find storage unit with highest
SoC level and eleiminate
Find storage unit with lowest SoC level and eliminate
Calculate E_4charg(E_c)
Calculate E_4disch(E_d)
q >> 1 q<<1
Find PEV with lowest probability of avail (or) the one which is not going away next three hours and eliminate
Find PEV with lowest probability of avail (or) the one which is not
going away next three hours
YES YES
NO NO
Calculate avilable capacity E_avail = E_4charg / E_4dish
Fuzzy Controller Inputs: 1. E_avail, 2. E_need(t+1), and 3. E_need(t+2:t+4)
Fuzzy Controller Output: P_rate (apply constraint on change in P_rate(eq. (8))
STOP
NO NO
Give priority for those PEVs which will stay for long duration at home
Give priority for those PEVs which will stay for long duration at home
q<<1 q >> 1
Eliminate storage units that are out of SoC boundaries
Eliminate storage units that are out of SoC boundaries
[image:5.595.103.502.47.637.2]YES YES
Fig. 6.2. Slack bus power comparison and its variation VII. CONCLUSION
The forecasted power fluctuations on slack bus during upcoming hours are taken into account. After elimination of storage units that are not suitable for grid support, power rate is decided based on current energy demand, energy demand estimated during next hour and available storage capacity. The proposed control strategy has considered all the factors that affect maximum utilization of storage capacity while minimizing battery degradation. Results shows that proposed control strategy effectively reduces deviations in power drawing from grid. It indirectly mitigates distribution side load and solar PV power fluctuations. Effect of time interval duration is also studied and it can be concluded that lesser the time interval more accurate will be the monitoring and scheduling of available storage. This paper mainly focuses on effective utilization of both ESU and PEV storage capacities in coordination. The forecasted power fluctuations on slack bus during upcoming hours are taken into account. After elimination of storage units that are not suitable for grid support, power rate is decided based on current energy demand, energy demand estimated during next hour and available storage capacity. The proposed control strategy has considered all the factors that affect maximum utilization of storage capacity while minimizing battery degradation. Results shows that proposed control strategy effectively reduces deviations in power drawing from grid. It indirectly mitigates distribution side load and solar PV power fluctuations. Effect of time interval duration is also studied and it can be concluded that lesser the time interval more accurate will be the monitoring and scheduling of available storage.
REFERENCES
1. N. Rotering and M. Ilic, “Optimal charge control of plug-in hybrid electric vehicles in deregulated electricity markets,” IEEE Trans. Power Syst..,vol. 26, no. 3, pp. 1021-1029, Aug. 2011.
2. 2. F. Guo, E. Inoa, W. Choi, and J. Wang, “Study on global optimization and control strategy development for a PHEV charging facility,” IEEE Trans. Veh. Technol., vol. 61, no. 6, pp. 2431-2441, Jul. 2012.
3. Basha, CH Hussaian, C. Rani, and S. Odofin. "A review on non-isolated inductor coupled dc-dc converter for photovoltaic grid-connected applications." International Journal of Renewable Energy Research (IJRER) 7.4 (2017): 1570-1585.
4. S. Kushalini, J. M. Solanki, and N. N. Schulz, “ Development of 3-phase unbalanced power flow using PV and PQ models for DG and study of impact of DG models,” IEEE Trans. Power Syst., vol. 22. No. 3, pp. 1019-1025, Aug. 2007.
5. Global, E. V. “Outlook 2016, Beyond one million electric cars.” International Energy Agency: France (2016).
6. S. Deilami, A. S. Masoum, P. S. Moses, and M. A. S. Masoum, “ Real-time coordination of plug-in electric vehicle charging in smart grids to minimize power losses and improve voltage profile,” IEEE Trans. Smart Grid, vol. 2, no. 3, pp. 456-467, Sep. 2011.
7. K. Clement-Nyns, E. Heasen, and J. Driesen, “The impact of charging hybrid plug-in electric vehicles on a residential distribution grid,” IEEE Trans Psys., vol. 25, no. 1, pp. 371-380, Feb. 2010.
8. H. Sikai and D. Infield, “The impact of domestic plug-in hybrid el;ectric vehicles on power distribution system loads,” in Proc. Int. Conf. Power syst. Technol. (POWERCON), Hangzhou, chaina, 2010, pp. 1-7.
9. Padiha-Feltrin, Antanio, Darwin Alexis Quijano Rodezno, and Roberto Asnches Mantovani. “Volt-VAR Multi objective Optimization to peak-load relief and energy efficiency in distribution networks.” IEEE Transactions on Power Delivery 30.2 (2015): 618-626.
AUTHORS PROFILE
J T Ramalingeswar received his Bachelor degree in Electrical and Electronics Engineering from JNTUH, India and Master Degree in Power Electronics from JNTUA, India in 2008 and 2011 respectively. He is currently an external part time research scholar in Vellore Institute of Technology, Vellore, India. He is working as Assistant Professor in the department of Electrical and Electronics Engineering, S V Engineering College, Tirupati, India. His research interests include Power Electronics, Micro grid, Smart grid, Plug-In electric Vehicles.