Abstract: Sleep is judgmental to health and well-being. Deficient quality sleep is similar with a wide range of negative outcomes varies from schizophrenia to cardiovascular disorders. Obstructive sleep apnea is one of the sleep disorders. In order to identify the various syndromes the signals are need to record by using the sensors. Sleep signals are recorded by using the polysomnography (PSG) labs which is the old traditional and gold standard for recording the sleep signals. PhysioNet is a large online medical database that consists of a large collection of recordings of various physiological signals. PhysioNet database consist of sleep apnea database available. Physionet website is a universal service, physionet resource supported by the national institute of health’s National Institute of Biomedical Imaging and Bioengineering (NIBIB) and National Institute of General Medical Sciences (NIGMS). This survey paper aims to bring the different Signal Processing Techniques for Removal of Various Artifacts from Obstructive Sleep Apnea Signals to identify sleep apnea syndrome, because pre-processing is most effective and efficient to reduce unwanted signals from the original sleep signals. While recording the sleep apnea signals various artifacts records along with raw signals either directly or indirectly due to the internal and external sources like Power line interference, Muscle contractions, Electrode contact noise, Motion Artifacts, Baseline wandering, Noise generated by electronic circuits, while breathing and coughing, body position movements etc, and they need to be eliminated in order to acquire genuine health information. So in order to remove there artificats from the sleep signals the signal processing techniques (filtering techniques) are predominantly used for pre-processing of the sleep signals and have been executed in a wide variety of systems for analysis. Filtering of the sleep signal is contingent and should be implemented only when the required statistics remains cryptic.
Keywords:Additive White Gaussian, Artifacts, Moving average filter, Obstructive sleep apnea, Physionet, Polysomnography, Wavelet Transform.
* Correspondence Author
C. Kaushik *, Assistant Professor, Electronics and Communication Engineering , Vallurupalli Nageswara Rao Vignana Jyothi Institute of Engineering and Technology (VNR VJIET), Telangana, India. Email: [email protected]
G. Sahitya, Assistant Professor, Electronics and Communication Engineering , Vallurupalli Nageswara Rao Vignana Jyothi Institute of Engineering and Technology (VNR VJIET), Telangana, India. Email:
V. Krishna Sree, Associate Professor, Electronics and Communication Engineering, Vallurupalli Nageswara Rao Vignana Jyothi Institute of Engineering and Technology (VNR VJIET), Telangana, India. Email: [email protected]
Remalli Rohan, M.Tech, Embedded Systems, Electronics and Communication Engineering, Vallurupalli Nageswara Rao Vignana Jyothi Institute of Engineering and Technology (VNR VJIET), Telangana, India. Email: [email protected]
I. INTRODUCTION
A.Sleep
Over the average lifespan of humans, sleep is needed for about 1/3 of their lives. Sleep is described as “A state of mind and body which usually repeated for several hours every night, in which nervous system is idle, eyes shut, postural muscles are loosen and consciousness practically suspended”. Sleep plays a major role in human health and it is a key for intellectual and physical recreation. The human body cannot function appropriately without adequate sleep. Poor sleep quality normally connects with physical and mental health complications [1]. Sleep is not only a basic biological fundamental but also a physiological drive.
B. Obstructive Sleep Apnea (OSA)
Obstructive Sleep Apnea (OSA) is a syndrome that appears in the night sleep. It is explained as an interruption in airflow remaining for at least 10 seconds, and may occur multiple times per hour [2]. The word “Apnea” means “without breath”, this is derived from Greek language. In the year 1981 Sydney, Colin Sullivan was first described for the improvement of sleep apnea by introducing continues positive airway pressure (CPAP) [3].
OSA falls under the sleep-related breathing syndrome as shown in the figure 1 [4]. As per reports worldwide, sleep apnea syndrome is extremely frequent among in adults by about 4% in males and 2% in females [5-6]. Based on the breathing efforts sleep apnea is further divided into Obstructive Sleep Apnea (OSA), Central Sleep Apnea (CSA) and Mixed Sleep Apnea (MSA). CSA is initiated by unavailability of respiratory effort initiated by brain. MSA may occur because of mixed circumstances of OSA and CSA. The intensity of sleep apnea is analyzed using apnea hypopnea index (AHI). The value of AHI is studied by episodes of apnea events during an hour. Sleep apnea is further divided as further into 3 categories based on their frequencies: light OSA (5 ≤ AHI < 15 events/hour), average OSA (15 ≤ AHI < 30 events/hour) and extreme OSA (AHI ≥ 30 events/hour) [7].
Signal Processing Techniques for Removal of
Various Artifacts from Obstructive Sleep Apnea
Signals
Fig. 1. Normal Breath and Obstructive Sleep Apnea Syndrome Breathing
.
II. DATA BASE OF OBSTRUCTIVE SLEEP APNEA SIGNALS
Sleep signals are recorded by using the polysomnography (PSG) labs which is the old traditional and gold standard for recording the sleep signals. PSG study includes the parameters like breath air-flow, respiratory movement, blood de-saturation oxygen, body position, Electrocardiogram (ECG), Electroencephalogram (EEG) etc. The ECG signal gets modulated in amplitude and frequency due to breathing interruptions provoked in sleep apnea condition resulting in inadequate supply of oxygen to the heart. The database of sleep apnea signals used is available from the physionet website [8]. Physionet website is a public service. Physionet resource funded by the national institute of health’s NIBIB and NIGMS.
A. ECG-Apnea database
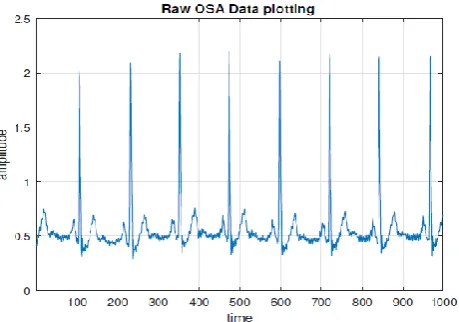
ECG-Apnea database of MIT’s physionet.org consist of 70 recordings of length from 8-10 hours sampled at 100 Hz. The database has ECG recordings of apnea patients (a01-a20), border line (b01-b05) and control patients (c01-c10). Another set of 35 apnea ECG recordings (X01-X35) are of both apnea patients and normal respiratory signals [9-10]. These data contains a single ECG varying in length, slightly less than 7-10 hours each. The sampling frequency was 100 Hz with 16-bit resolution. The subjects of these recordings were men and women between 27-63 years of age (mean: 43.8±10.8 years) with weight between 53-135 kg (mean: 86.3±22.2 kg) as shown in figure 2.
B. MIT-BIT Polysomnographic Database
[image:2.595.306.542.52.226.2]The MIT-BIH Polysomnography database consists of 18 records from 16 unique subjects. Two of the records are from the same subjects and is having the same name but differentiated by an “a” and “b” postfix. In this database, all 16 subjects were all male, aged from 32 to 56, with weight ranging from 89 to 152 kg. The recordings are sampled at a rate of 250 Hz. This database includes signals are EEG, EMG, EOG, ECG, respiratory signals, oxygen saturation etc [11] as showed in figure 3.
Fig. 2. ECG-Apnea database Obstructive Sleep Apnea Signal
Fig. 3. MIT-BIH Polysomnography database Obstructive Sleep Apnea Signal
[image:2.595.323.544.270.447.2] [image:2.595.313.543.497.658.2]C. UCD Sleep Apnea Database
Subjects were selected randomly over a 6-month period. Patients are referred from sleep disorders clinic at St Vincent’s University Hospital, Dublin. This database contains 25 full subjects (21M, 4F) were selected (age: 50 ± 10 years, range 28-68 years; BMI: 31.6 ± 4.0 kg/m², range 25.1-42.5 kg/m²; AHI: 24.1 ± 20.3, range 1.7-90.9), overnight polysomnography with simultaneous 3 channels Holter ECG, from adult subjects with suspected sleep disordered breathing, as showed in figure 4 and the recordings are sampled at a rate of 1 Hz.
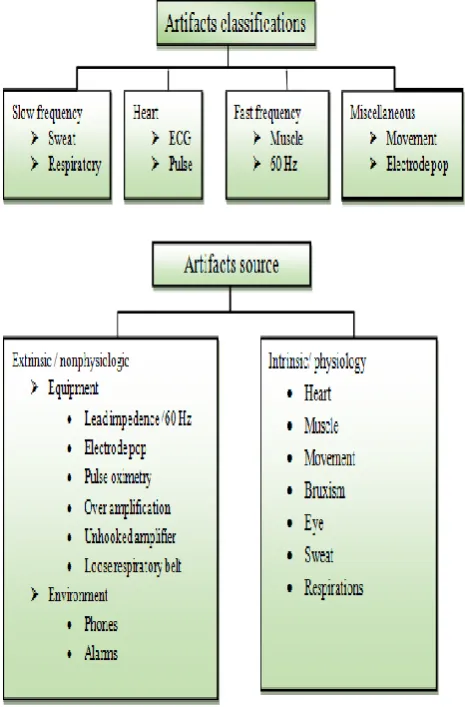
III. ARTIFACTS IN SLEEP APNEA
Artifacts are nothing but the noises present while recording the obstructive sleep apnea signals from the patients. Artifacts in apnea signal may be due to internal sources (body position, respiration, coughing) and external sources of the subjects. These artifacts are electrical disturbances created by electrical noise i.e., any outside source, placement or poor contact of leads, machine malfunctions, etc. various kinds of artifacts in an obstructive sleep apnea signal are listed below [12], as showed in figure 5 and they are eliminated in order to acquire genuine health information.
The major sources of artifacts are: 1. Power line interference 2. Muscle contractions 3. Electrode contact noise 4. Motion Artifacts 5. Baseline wandering
6. Noise generated by electronic circuits
There are various types of methods to extract the sleep apnea ECG parameters from the noisy sleep apnea signals. First we need to analyze sleep signal to get which type of noise engage up with the signals.
Power line interference: Power line interference consists of 50/60 Hz alternating current pickups and harmonic presents in the power supply. It appears as a spike in the frequency band of apnea signal which contains important information for diagnosis purpose. Major reasons for power-line interferences are:
Disconnected electrodes.
Electromagnetic interferences produced from the power supply.
Abnormal grounding of PSG machines.
Stray effects of alternative currents due to loops in the cables.
Electrical devices such as X-ray units, air conditions drawn heavy power line currents, which induces in the input circuit of the machine.
Base line wandering: Base line wander is also known as base line drift. And it is a low frequency noise caused by the displacement of electrodes due to cough, respiration (or) subjects body movements. Some other factors like moving cables, dirty leads/wires, loose electrodes etc can also cause these artifacts. Due to the presence of base line wander as a result signal is shifted to zero potential baselines causing difficulty in analyzing the signals for detection of sleep disorders.
Electromyography: also called as muscle contractions and also EMG noise which is induced by the subject’s movement.
Motion Artifacts: instantaneous movements due to cough, respiration, body position of the subject while signals are being recorded results in the motion artifacts.
[image:3.595.310.543.200.554.2]Electrode contact noise: the connections between subjects and the measuring system are interrupted for a short duration of the due to the poor connection of electrode to the human skin result to the electrode contact noise consequences.
Fig. 5. Obstructive Sleep Apnea Signal Source and Classification
IV. DIFFERENT METHODS TO REMOVE ECG SLEEP APNEA ARTIFACTS
In this section, different signal processing techniques for used for the elimination of various artifacts from the sleep apnea ECG signal have been described in the above section. There are various methods and some of them are having been explained below and these methods are very simple yet effective. Many researchers have worked towards reduction of noise in ECG signal. Some of them have explained below.
A. Obstructive Sleep Apnea Signal Processing Signal processing is achieved in the immeasurable majority of system for sleep apnea ECG analysis and clarification. It is used to
have been towards quantitative. The domain of biomedical signal investigation or processing has strengthened to the stage of practical application of signal processing and pattern analysis methods for efficient and improved non invasive diagnosis, online monitoring of critical ill patients.
The intention of sleep apnea ECG signal processing is manifold and contains the development of measurement reliability and reproducibility. ECG sleep apnea analysis interprets stress testing, ambulatory monitoring, intensive care monitoring which forms a basic set of algorithms/techniques that conditions the signals with respect to various types of artifacts, detects heartbeat, extract basis sleep apnea ECG measurements of wave amplitude and durations, and pack the data for efficient storage or transmission.
Artifacts removal plays the vital role in the processing of the sleep apnea ECG signals. The noise present in the sleep apnea signals should be removed; in order to encode the actual health information in the apnea signal if not it may lead to the false diagnosis and also affect the overall accuracy.
B. Techniques for Removal of Power Line Interference
[image:4.595.306.536.196.403.2]Notch filter are designed to eliminate power line interference generated by the other electric devices using alternating current. In the United States frequency of AC current is 60 Hz, where as in other countries it is 50 Hz.
Fig. 6. Raw Sleep Apnea Signal (above), Sleep Apnea ECG after power line interference removed (below). Since implementation of the filter can abstruse applicable physiologic electrical circumstances such as spike activity. Notch filter is used to reject the power line noise at 60/50 Hz and its harmonics in the sleep apnea signals. There for IIR digital notch filter is very selective filter with a very high rejection just for a tiny frequency band around the selected frequency. Notch filter will not attenuate other frequencies which belong to the apnea signal. From the figure 6 it is observed the after applying the notch filter in order to remove the power line interferences (spikes) from the raw input sleep signals.
C. Techniques for Removal of Baseline Wandering
[image:4.595.61.279.362.609.2]The Baseline wandering is caused due to improper electrodes (electrode-skin impedence), patient’s movement and breathing. Since the baseline signal is a low frequency signal therefore a straight forward approach is to the design a finite impulse response (FIR) high pass zero phase forward backward filtering. Wavelet transform is also be used to eliminate the baseline wandering from ECG sleep apnea signal. According to the discrete wavelet transform (DWT), first the original signal is decomposed by suing the subsequent low pass filter (LPF), and high pass filter (HPF). The cut-off frequency for the LPF and HPF will be half of the sampling frequency as shown in the figure 7.
Fig. 7. Decoposition Level of Discrete Wavelet Transform. The sampling frequency of MIT-BIT Polysomnographic Database is 250 Hz, and then 125 Hz will be the cut-off frequency for the both LPF and HPF in the first level of decomposition. In the second level decomposition it becomes 62.5 Hz, for the third level decomposition cut-off frequency becomes 31.25 Hz and the level of decomposition goes on till it removes baseline wandering from the sleep apnea ECG signal.
Fig. 8. Raw Sleep Apnea Signal with baseline wander (above), Sleep Apnea ECG after base line wander
[image:4.595.309.536.517.721.2]D. Techniques for Removal of Electromyography Noise
The electromyography (EMG) is a high frequency, the moving average filter it can be eliminated the noise or at least it terminates the EMG noise from the sleep signals. The general equation for moving average filter is
R (n) = kx(n-k) (1)
Where x and R are the input and output of the filter respectively.
ak are filter coefficient, k=0,1,2,3---N, N is the
[image:5.595.308.553.56.459.2]order of the filter.
Fig. 9. Sleep Apnea Signal after applying moving average filter
E. Techniques for Removal of Artifacts from other sources
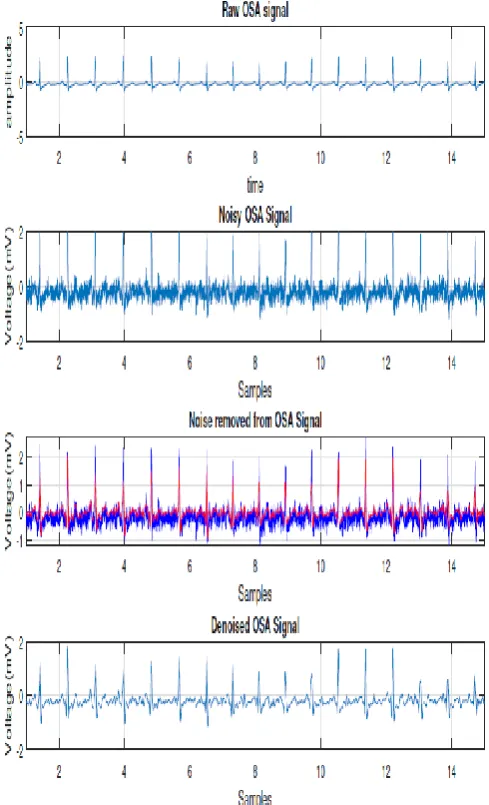
Basically artifacts in obstructive sleep apnea signals may be due to internal sources like body position, respiration, coughing and external sources of the subjects. These artifacts are electrical disturbances created by electrical noise i.e., any outside source, likely noise generated by electronic devices used in signal processing circuits, high-frequency noises, machine malfunctions, etc.
[image:5.595.49.290.194.428.2]One of the widely used methods for removing the noise generated by the electronic circuits is based on Additive White Gaussian noise (AWG). From the figure 10 the top signal is the raw sleep apnea signal. And second graph is the noised applied to the input signal. And third graph is the combination of both input and added noise signal and below graph is the de-noised signal (indicated as red signal) is filtered out after applying Additive White Gaussian noise.
Fig. 10. Artifacts are removed from sleep apnea signal using Additive white Gaussian.
REFERENCES
1. Takashi Nakamura, Valentin Goverdovsky, Mary J, Morrell and Danilo P. Mandic, “Automatic Sleep Monitoring Using Ear-EEG”, IEEE Journal of Translation Engineering in health and medicine, vol-5, no-2800108, 2017.
2. Sleep Apnea: What is sleep apnea? NHLBI: Health information for the public. U.S. Department of health and human services. 2009-05.
3. https://en.wikipedia.org/wiki/Sleep_apnea
4. https://www.shalby.org/blog/ent-surgery/things-you-should-know-abo
ut-obstructive-sleep-apnea-syndrome-osas/
5. Nathaniel S. Marshall, Keith K. H. Wong, Peter Y. Liu, Stewart R. J. Cullen, Matthew W. Knuiman, Ronald R. Grunstein, “Sleep Apnea as an Independent Risk Factor for All-Cause Mortality: The Busselton Health Study”, SLEEP, Vol. 31, No. 8, 2008.
6. Jonathan C. Jun, Swati Chopra, Alan R. Schwartz, “Sleep apnoea”, Eur Respir Rev. 25(139) 2016, 12 -18.
7. Fabio Mendonca, Sheikh Shanawaz Mostafa, Antonio G. Ravelo-Garcia, Fernando Morgado-Dias and Thomas Penzel, “A review of obstructive sleep apnea detection approaches”, IEEE journal of biomedical and health informatics, pp. 1-14, 2018. www.physionet.com
9. L. Goldberger, L. A. N. Amaral, L. Glass, J. M. Hausdor, P. C. Ivanov, R. G. Mark, J. E. Mietus, G. B. Moody, C. K. peng and H. E. Stanley, “physiobank, physiotoolkit and physionet: components of a new research resource for complex physiologic signals”, circulation, 2000. 10. Lee JM, Kim DJ, Kim IY, Park KS, Kim SI. Detrended fluctuation analysis of EEG in sleep apnea using MIT/BIH polysomnography data. Comput Biol Med 2002 Jan; 32(1):37-47.
11. https://intermountainphysician.org/intermountaincme/Documents/05
%20Lloyd.pdf
AUTHORS PROFILE
C. Kaushik finished Bachelor of Technology in Electronics and Communications Engineering (2014) from VNR Vignana Jyothi Institute of Engineering and Technology, Telengana, India. He
got Master of Science (M.S) in
Telecommunications Engineering (2016) from George Mason University, Virginia, USA, and now seeking after the Doctor of philosophy in Wireless Communications from GITAM University, Vishakhapatnam, India, and he is as of now working as Assistant professor in the Department of Electronics and Communications Engineering at VNR Vignana Jyothi Institute of Engineering and Technology, Telengana, India. He has 4 years of experience in teaching and in research field where he published papers in the reputed national, international journals and conference. His research interest includes Signals & Systems, Communication Systems, Logic Design, Digital Signal Processing, Computer Networks, Cellular & Mobile Communication, and Wireless Networks & Systems.
G. Sahitya received Bachelor of Technology in Electronics and Communications Engineering from Velagapudi Ramakrishna Siddhartha Engineering College [VRSEC], Vijayawada, Andhra Pradesh, India. She completed Master of Engineering from Jawaharlal technological University, Hyderabad Telengana, India and now pursuing the Doctor of philosophy in Wireless Communication from Jawaharlal Nehru technological University, Hyderabad, Telangana, India, ands he is as of now working as Assistant professor in the Department of Electronics and Communications Engineering at VNR Vignana Jyothi Institute of Engineering and Technology, Telengana, India. She has over 12 years of involvement in teaching and in research. Over 9 research papers were presented and published in the reputed national, international journals and conference in her account. And also she published 1 text books on ‘Digital Electronics’. Her research interest includes Wireless communications, Digital signal processing and image processing, Computer networks, ad hoc wireless sensor networks, switching theory and logic design, DSPA, wireless communications, cellular and mobile communication.
V. Krishna Sree Completed Bachelor of Technology in Electronics and Communications Engineering from Sri Venkateswara University college of Engineering, Tirupathi, India, completed Master of Engineering from Jawaharlal technological University, Hyderabad Telengana, India and now pursuing the Doctor of philosophy in Image processing from Jawaharlal Nehru technological University, Hyderabad, Telangana, India. She is presently working as Associate professor in the Department of Electronics and Communications Engineering at VNR Vignana Jyothi Institute of Engineering and Technology, Telengana, India. She has over 15 years of involvement in teaching and in research. 19 research papers were presented and published in the reputed national, international journals and conference in her account. And also she published 4 text books (‘Digital Electronics”, “Digital Electronics and computer architecture”, “Communication systems”, and “Advanced communications”). Her research interest includes Electronic devices and circuits, Circuit analysis, Linear and digital IC applications, EDA TOOLS, Analog communications, Satellite communications, Digital signal processing and digital image processing.