Participation in the sharing economy in the
Czech Republic
Jaroslav Stuchlý1and Michal Šuta1,*
1Institute of Technology and Businessin České Budějovice, Faculty of Corporate Strategy, Okružní 517/10, 37001 České Budějovice, Czech Republic
Abstract.The sharing economy currently forms a really important aspect of an economy. The authors set out to determine the size of the population participating in the sharing economy through the use of social networks and other channels with the purpose of identifying and describing individual factors (variables) affecting this type of market segment. The objectives of this paper were to determine the age gap between male and female participants in the sharing economy and to identify specific factors that may affect their participation in it, in particular among respondents who actively use social networks. It was concluded that gender did affect participation in the sharing economy, whilst financial position and permanent address did not have any influence on this market segment. The authors also set out to determine the level of education of the population that is dominant on this market. In terms of methodology, the information presented in this paper is based on the results of an empirical questionnaire survey on participation in the sharing economy in the Czech Republic and the application of general statistical methods.
Key words: sharing economy, p2p lending, age identification
1 Introduction
The sharing economy is among the macroeconomic aspects of the state. It is an issue which is very important for the state, companies and individuals due to the high degree of globalization. Many works have been written on this topic in general; however, the narrowly specified topic of this contribution appears very scarcely in professional literature.
A new type of economic interaction appeared at start of the 2008-2009 financial crisis. Initially originating on the western coast of the United States, it gradually rolled out to many developed countries, spreading particularly fast in municipal areas. This new type of economic interaction is called many different names, including joint consumption, access economy, peer-to-peer economy, collaborative consumption or on-demand economy. However, it is best known as the sharing economy [5].
The sharing economy is an important element of shared consumption. It can be considered a hybrid economic system built on property lending, sharing or rental without the need to own the assets. This type of economy is based on state-of-the-art technologies which make it possible to reduce costs, in particular transaction costs and overheads.
As early as 1978, Felson and Spaeth [11] defined collaborative consumption as follows: “Events in which one or more persons consume economic goods or series in the progress of engaging in joint activities with one or moreothers”. Russel Belk [3] disagreed with this definition by claiming it is very general and does not provide a satisfactory description of the acquisition and distribution of economic resources. Belk [4] therefore defines collaborative consumption as “people coordinating the acquisition and distribution of a resource for a fee or other compensation”. Belk’s definition therefore assumes that the sharing economy cannot exist without some form of compensation.
Teffer [18] states that the sharing economy is a remarkable trend that is disrupting traditional economic sectors, but that this phenomenon is very difficult to define and that empirical evidence of its impact is scarce. At present, two markets exist in the sharing economy, namely the peer-to-peer (P2P) and business-to-customer (B2C) markets [7]. The sharing economy provides temporary access to idle resources. The unused capacity of goods is financed by those who own them and consumers rent access to those goods without acquiring the assets themselves [13].
Botsman and Rogers [6] differentiate between three system subtypes of temporary access. The leading criterion is not the type of ownership, but in what form assets are shared. The first type of sharing is called “Product Service Systems”. It is a model that allows companies to offer goods as services rather than sell goods as products. Goods being private property can be shared and lent peer-to-peer. These systems appeal to the growing number of people arriving at the opinion that they want to have an advantageous product but do not need to own it. The second type of system is called “Redistribution Markets”. These markets redistribute used or previously owned goods from one place where they are not needed to another place where they are needed. In some markets, goods can be shared free of charge, in other markets in exchange or for a consideration. The third type of system is called “Collaborative Lifestyles”. Under this system, people with the same needs or interests jointly share and exchange intangible assets such as time, skills, or location. For the most part, this exchange is done at the local or neighbourhood level, whereby people share working space, gardens or parking space. However, lifestyles are also shared globally through activities such as peer-to-peer lending and the rapidly growing peer-to-peer travel. Unlike the aforementioned authors, Lisa Gansky [12] only distinguishes between two types of sharing based on the type of ownership. The first is the so-called Full Mesh Model, whereby a company owns some assets and rents them out via an application. The customer orders/books the given asset(s) through an application, thereby getting access to the specific asset(s) without the need to visit a registered office. The second is the so-called Own-to-Mesh Model. This model is based on the principle that a company does not own assets and that sharing is mediated by a company.
A study published by PricewaterhouseCoopers [16] claims that global revenues of the sharing economy across five key sharing sectors (travel, carsharing, finance, staffing and music / video streaming) have the potential to exceed USD 335 billion by 2025. Currently, 19% of US adults have undertaken sharing economy transactions, whereas only 7% of US citizens are providers in the sharing economy.
Peer-to-peer market
The peer-to-peer market involves the sharing of both tangible and intangible assets and human skills, whereby the owner shares them with someone else either free of charge or for a consideration through an internet platform. There are many forms of sharing in the peer-to-peer market, including carsharing, peer-peer-to-peer lending or couch surfing, as well as examples of the Own-to-Mesh model described by Gansky [12].
As early as 1978, Felson and Spaeth [11] defined collaborative consumption as follows: “Events in which one or more persons consume economic goods or series in the progress of engaging in joint activities with one or more others”. Russel Belk [3] disagreed with this definition by claiming it is very general and does not provide a satisfactory description of the acquisition and distribution of economic resources. Belk [4] therefore defines collaborative consumption as “people coordinating the acquisition and distribution of a resource for a fee or other compensation”. Belk’s definition therefore assumes that the sharing economy cannot exist without some form of compensation.
Teffer [18] states that the sharing economy is a remarkable trend that is disrupting traditional economic sectors, but that this phenomenon is very difficult to define and that empirical evidence of its impact is scarce. At present, two markets exist in the sharing economy, namely the peer-to-peer (P2P) and business-to-customer (B2C) markets [7]. The sharing economy provides temporary access to idle resources. The unused capacity of goods is financed by those who own them and consumers rent access to those goods without acquiring the assets themselves [13].
Botsman and Rogers [6] differentiate between three system subtypes of temporary access. The leading criterion is not the type of ownership, but in what form assets are shared. The first type of sharing is called “Product Service Systems”. It is a model that allows companies to offer goods as services rather than sell goods as products. Goods being private property can be shared and lent peer-to-peer. These systems appeal to the growing number of people arriving at the opinion that they want to have an advantageous product but do not need to own it. The second type of system is called “Redistribution Markets”. These markets redistribute used or previously owned goods from one place where they are not needed to another place where they are needed. In some markets, goods can be shared free of charge, in other markets in exchange or for a consideration. The third type of system is called “Collaborative Lifestyles”. Under this system, people with the same needs or interests jointly share and exchange intangible assets such as time, skills, or location. For the most part, this exchange is done at the local or neighbourhood level, whereby people share working space, gardens or parking space. However, lifestyles are also shared globally through activities such as peer-to-peer lending and the rapidly growing peer-to-peer travel. Unlike the aforementioned authors, Lisa Gansky [12] only distinguishes between two types of sharing based on the type of ownership. The first is the so-called Full Mesh Model, whereby a company owns some assets and rents them out via an application. The customer orders/books the given asset(s) through an application, thereby getting access to the specific asset(s) without the need to visit a registered office. The second is the so-called Own-to-Mesh Model. This model is based on the principle that a company does not own assets and that sharing is mediated by a company.
A study published by PricewaterhouseCoopers [16] claims that global revenues of the sharing economy across five key sharing sectors (travel, carsharing, finance, staffing and music / video streaming) have the potential to exceed USD 335 billion by 2025. Currently, 19% of US adults have undertaken sharing economy transactions, whereas only 7% of US citizens are providers in the sharing economy.
Peer-to-peer market
The peer-to-peer market involves the sharing of both tangible and intangible assets and human skills, whereby the owner shares them with someone else either free of charge or for a consideration through an internet platform. There are many forms of sharing in the peer-to-peer market, including carsharing, peer-peer-to-peer lending or couch surfing, as well as examples of the Own-to-Mesh model described by Gansky [12].
Carsharing is popular in the large cities of North America and Europe because people do not want to bear the additional costs of running their own car. Modern carsharing, which
was pioneered in Switzerland, has spread around the globe ever since. Europe is one of the largest world regions to have adopted carsharing. Other world regions are showing considerable growth in this sector, and although this growth is much higher than in Europe and North America, the total numbers are still quite low. At present, the success of carsharing is mostly linked to densely populated areas [10]. Peer-to-peer carsharing is an innovative approach to carsharing and involves owners temporarily renting their cars to other people in their neighbourhood. Peer-to-peer carsharing is part of the larger sphere of the sharing economy, namely the economic model based on the concept of joint consumption as opposed to ownership [2]. Carsharing reduces the number of cars on the roads because the players in this market segment do not have to own their own car. Hampshire & Gaites [14] highlight the many studies that show that carsharing reduces transportation costs for a large segment of society. However, the authors note that the traditional carsharing model is difficult to measure geographically in areas with a lower population density because the operator must know the fixed costs for the car purchase or rental in advance. Shaheen & Cohen [17] analysed the carsharing market and established that in 2006, more than 346,000 people around the globe used 11,501 shared cars. Over the next eight years, the number of people making use of carsharing rose by more than 4.4 million and the number of shared cars increased by more than 90,000. This change is illustrated in Table 1.
Table 1. Carsharing analysis
Year Users Shared cars
2006 346,000 11,501
2014 +4.4 million + 90,000. Source: Shaheen & Cohen [17]; authors.
Peer-to-peer lending (P2P) involves the provision of loans between individuals via online platforms, whereby financial institutions only act as intermediaries as required by law. The first commercial online platform for P2P lending (Zopa) was established in 2005 by groups on online social networks. This means that P2P lending is a relatively new field of research [1]. Peer-to-peer lending is becoming more and more popular around Europe because lenders are seeking to achieve higher returns than offered by banks and borrowers are applying for loans in market sectors where banks refuse to lend. Another reason why peer-to-peer lending is becoming more and more popular is that lenders offer borrowers lower interest rates than banks. In an article in the Economist [19] it states that lenders usually lend money to borrowers via online internet auctions. The loans issued often consist of smaller sums from different lenders who provide money to borrowers with a preset interest rate, and all without the intervention of banks [19]. Although this market is growing rapidly, the current volume of P2P loans is equivalent to only a small proportion of the loans provided by traditional financial institutions, which suggests that P2P platforms cannot compete with financial institutions. Tristan Hugo-Webb [15] says that P2P lending platforms may be considered an interesting phenomenon, but that they do not pose a threat to traditional loan providers. However, the origin of P2P lending provides a new, valuable source of funding in the global financial world after 2008, and has the potential to fill the loan gap in mature as well as developing markets. In future, the global economy may benefit from consumers and businesses being allowed to obtain funds through P2P lending.
2004, the CouchSurfing Company has switched from being a non-profit organisation making connections between travellers and local communities to a global community of people with the same travelling mindset and who participate in thousands of connections [8].
2 Data and Methods
The purpose of this paper is to determine the size of the population in the Czech Republic that participates in the sharing economy through the use of social networks and other channels with the purpose of identifying and describing individual factors (variables) affecting this market. The presented data were collected via an online questionnaire posted on social networks from June 1 to September 5, 2017 on Facebook. The authors used the aforementioned social network in order to distribute the questionnaires, as they believed they would be able to gain adequate number of randomly selected respondents in order to achieve the above mentioned objective of the contribution. This hypothesis was not confirmed; therefore, in the following part of the contribution, the authors decided only to deal with the description of the results in the sample and the results of the statistical tests will not be extrapolated to the whole population of the Czech Republic. In total, 88 randomly selected respondents completed the questionnaire via the aforementioned social network, with 78.41% stating that they participate in the sharing economy and 21.59% stating they do not. Since these were randomly selected respondents using Facebook social network, it was not possible to get basic information on the given respondents. The data obtained through the survey were analysed using Excel 2010 and R statistical software. When taking into consideration the small number of respondents (N=88), in particular due to the break down thereof according to multi-category variables (region and forms of participation in the sharing economy), some of the poorly represented categories were combined and the dependencies not generalised for the whole population across the social networks involved. As referred to above, only the description of the situation for the selected sample is only presented in the form of contingency tables and/or diagrams was involved.
For verification of the hypotheses, Pearson´s chi-square test, which is one of the most widely used statistical tests of independence in the contingency table, will be primarily used. The measurement for accepting or declining the hypotheses is so-called p-value with the Pearson´s chi-square test, which enables to verify whether the random variable has a pre-determined probability distribution. The hypotheses are tested on the level of significance “α“as follows: H0 = null hypothesis p-value > α is accepted, alternative
hypothesis Hais declined. The following formula serves for calculation of the Pearson´s
chi-square test:
(1)
X2chi-square
Xireal count
Npiexpected count of type i
3 Results and Discussion
The first question in the survey sought to determine the age of the population in the sample set that participate in the sharing economy in the Czech Republic across the selected social
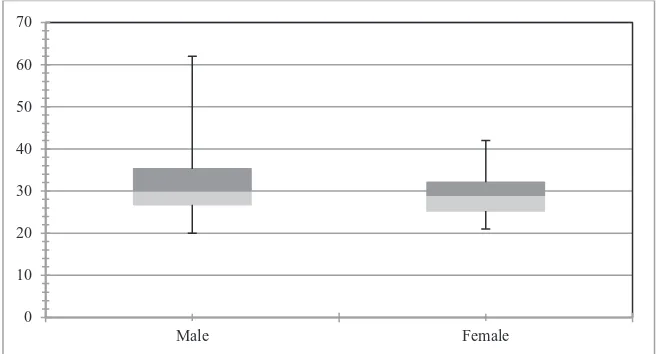
[image:5.482.76.405.108.285.2]networks. The arithmetic mean age of the men in the sample set was 31.73 years and of the women 29.22 years. The variable ratio of “male and female age” is illustrated in Figure 1.
Fig. 1. Age structure of participants in the sharing economy Source: Authors.
Figure 1 shows that the median age is 30 years for the men and 29 years for the women. The maximum age of the men in the sample set who participate in the sharing economy across the selected social networks was 62 years whilst that of the women was 42 years. Conversely, the minimum age among the men was 20 years and among the women 21 years. Figure 1 also clearly shows that the 25% age quantile is 26.75 years for the men and 25.25 years for the women, and that the 75% age quantile for the men is 35.25 years and 32.06 years for the women. The standard deviation of age is 8.01 years for the men and 6.82 years for the women. The coefficient of variation is 25.2% for the men and 23.3% for the women. In summary, the age level in the sample is only slightly higher among the men than the women, but the absolute and relative variability of age is substantially higher among the men. The value of the variation coefficient shows that both data files are homogenous.
Another objective was to identify whether the median age of the respondents in the sample who do and do not participate in the sharing economy is significantly different. This result is typically obtained from a two-sample t-test of median age values in the considered population. However, this test requires data normality of the “age” variable in both samples, or at least sufficient data in both samples. With only 19 measurements available in the set of respondents who do not participate in the sharing economy, it was necessary to first test thenormality of the “age” variable in both samples. R statistical software was used to apply the Shapiro-Wilk test of normality for this purpose.
The computer outputs were W = 0.9241, p-value = 0.000445 for the respondents who participate in the sharing economy, and W = 0.8013, p-value = 0.001195 for the respondents who do not participate in the sharing economy. This means that the null hypothesis of age normality in both sets was rejected at the 5% significance level.
A non-parametric two-sample Wilcoxon test was applied using R statistical software to identify whether the age was significantly different in both considered population samples. The null hypothesis H0: both population median ages are equal, was tested against the
alternative hypothesis H1: both population median ages are not equal. The computer outputs
were W = 733.5, p-value = 0.4283. The null hypothesis was therefore not rejected. This means that at the 5% significance level it was not proved that the median age of the
0 10 20 30 40 50 60 70
populations (in the sample) participating and not participating in the sharing economy across the selected social networks is significantly different.
[image:6.482.95.384.201.287.2]The next question in the survey sought to determine whether participation in the sharing economy is affected by the factor “Permanent Address”. Due to the lack of data for some regions, the results for the sample set are presented in the form of a contingency table. Regions with the least data are summarised in the category Other Regions. Table 2 shows the frequency (in percent) of the population in the sample set that participate in the sharing economy according to region and gender.
Table 2. Structure of participants in the sharing economy according to permanent address (region) and gender
Region Male Female Total
Prague 28.99% 4.35% 33.33%
Central Bohemian Region 14.49% 4.35% 18.84% Moravian-Silesian Region 7.25% 1.45% 8.70%
Zlín Region 7.25% 1.45% 8.70%
Other regions 28.99% 1.45% 30.43%
Total 86.96% 13.04% 100.00%
Source: Authors.
The table shows that most participants in the sharing economy in the sample set are located in Prague and the Central Bohemian Region. The responses to this question may be highly biased due to the low number of respondents and/or the structure of the respondents, both of which must be taken into consideration. In the tested sample, it has been revealed there is also a significant difference between the men and women. There are 2.5 times more male than female participants.
[image:6.482.86.410.468.632.2]Participation in the sharing economy (within the tested sample) was subsequently tested against the other identified variables (gender, employment and education of respondents). For this purpose, contingency tables were used and Pearson's chi-squared test of independence applied accordingly.
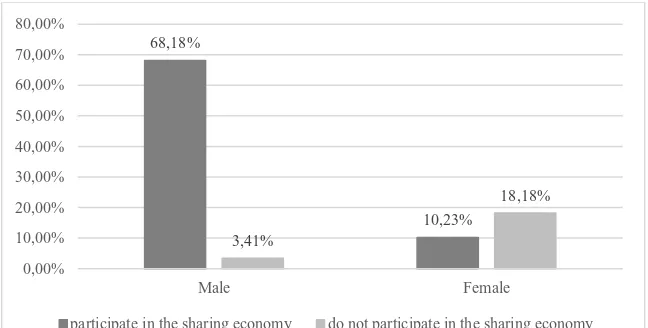
Figure 2 shows the participation of the population tested in the sharing economy across the selected social networks according to gender. The results reveal that 68.18% of men and only 10.23% of women participate in the sharing economy.
Fig. 2.Participation in the sharing economy according to gender Source: Authors.
68,18%
10,23% 3,41%
18,18%
0,00% 10,00% 20,00% 30,00% 40,00% 50,00% 60,00% 70,00% 80,00%
Male Female
populations (in the sample) participating and not participating in the sharing economy across the selected social networks is significantly different.
The next question in the survey sought to determine whether participation in the sharing economy is affected by the factor “Permanent Address”. Due to the lack of data for some regions, the results for the sample set are presented in the form of a contingency table. Regions with the least data are summarised in the category Other Regions. Table 2 shows the frequency (in percent) of the population in the sample set that participate in the sharing economy according to region and gender.
Table 2. Structure of participants in the sharing economy according to permanent address (region) and gender
Region Male Female Total
Prague 28.99% 4.35% 33.33%
Central Bohemian Region 14.49% 4.35% 18.84% Moravian-Silesian Region 7.25% 1.45% 8.70%
Zlín Region 7.25% 1.45% 8.70%
Other regions 28.99% 1.45% 30.43%
Total 86.96% 13.04% 100.00%
Source: Authors.
The table shows that most participants in the sharing economy in the sample set are located in Prague and the Central Bohemian Region. The responses to this question may be highly biased due to the low number of respondents and/or the structure of the respondents, both of which must be taken into consideration. In the tested sample, it has been revealed there is also a significant difference between the men and women. There are 2.5 times more male than female participants.
Participation in the sharing economy (within the tested sample) was subsequently tested against the other identified variables (gender, employment and education of respondents). For this purpose, contingency tables were used and Pearson's chi-squared test of independence applied accordingly.
Figure 2 shows the participation of the population tested in the sharing economy across the selected social networks according to gender. The results reveal that 68.18% of men and only 10.23% of women participate in the sharing economy.
Fig. 2.Participation in the sharing economy according to gender Source: Authors. 68,18% 10,23% 3,41% 18,18% 0,00% 10,00% 20,00% 30,00% 40,00% 50,00% 60,00% 70,00% 80,00% Male Female
participate in the sharing economy do not participate in the sharing economy
Pearson's chi-squared test was applied in the relevant contingency table to test the null hypothesis H0: participation in the sharing economy does not depend on respondents´ gender, against the alternative hypothesis. The outputs from the R statistical software were as follows: X-squared = 37.099, df = 1, p-value = 1.123.10-9. The null hypothesis was therefore rejected. It was demonstrated that at the 5% significance level the participation of the population from the tested sample in the sharing economy across the selected social networks is significantly dependent on respondents´ gender.
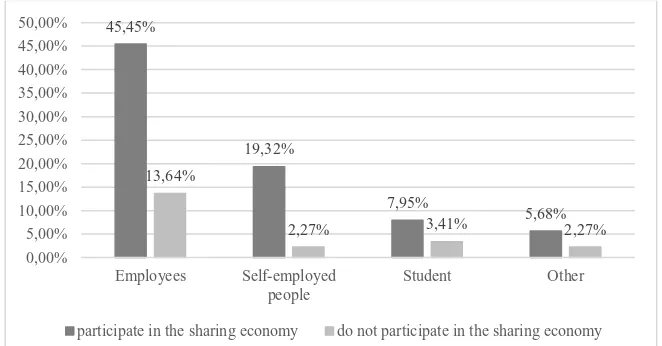
The dependency on the other identified variables was tested likewise. Figure 3 shows the participation of the population from the tested sample in the sharing economy across the selected social networks according to employment. The results reveal within the tested sample, the sharing economy is used by employees (45.45%), self-employed (19.32%), students (7.95%) and others (5.68 %).
Fig. 3.Participation in the sharing economy according to employment Source: Authors.
Pearson's chi-squared test was applied in the relevant contingency table to test the null hypothesis H0: participation in the sharing economy does not depend on the employment of respondents involved in the tested sample, against the alternative hypothesis. The outputs from the R statistical software were as follows: X-squared = 2.061, df = 3, p-value = 0.5598. The null hypothesis was therefore confirmed. It was demonstrated that at the 5% significance level the participation of the population tested in the sharing economy across the selected social networks is not significantly dependent on respondents’ employment.
Another variable that was possibly deemed to play an important role with regards to participation in the sharing economy was the education of respondents. Figure 4 shows that the majority of tested participants in the sharing economy across the selected social networks are tertiary-educated.
45,45%
19,32%
7,95%
5,68% 13,64%
2,27% 3,41% 2,27%
0,00% 5,00% 10,00% 15,00% 20,00% 25,00% 30,00% 35,00% 40,00% 45,00% 50,00% Employees Self-employed
people Student Other
[image:7.482.82.413.223.396.2]Fig. 4.Participationin the sharing economy according to education Source: Authors.
The results were similar to those of the previous Pearson's chi-squared test of independence (p-value = 0.5253). This means that the test did not demonstrate that participation in the sharing economy was significantly dependent on the education of the respondents from the tested sample.
Similar results were obtained for the other identified variables. It can therefore be concluded that, on the basis of the identified and tested variables, participation of the tested population in the sharing economy across the selected social networks is only affected by respondents’ gender.
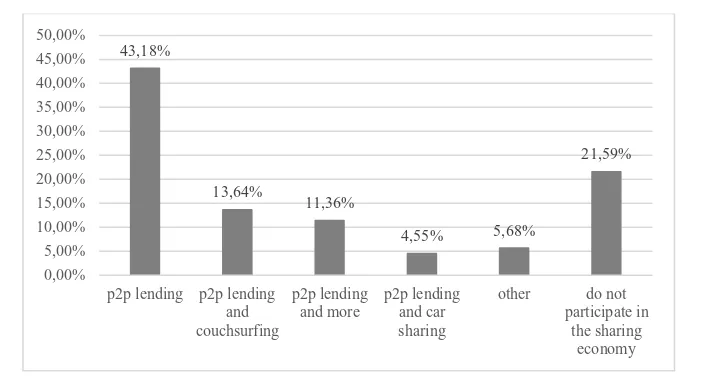
Figure 5 shows the segments of the sharing economy that are utilised the most by respondents in the population of the sample set.
2,27%
36,36%
39,77%
0,00%
7,95%
13,64%
0,00% 5,00% 10,00% 15,00% 20,00% 25,00% 30,00% 35,00% 40,00% 45,00%
Primary education Secondary education Higher education
[image:8.482.81.435.67.244.2]Fig. 4.Participationin the sharing economy according to education Source: Authors.
The results were similar to those of the previous Pearson's chi-squared test of independence (p-value = 0.5253). This means that the test did not demonstrate that participation in the sharing economy was significantly dependent on the education of the respondents from the tested sample.
Similar results were obtained for the other identified variables. It can therefore be concluded that, on the basis of the identified and tested variables, participation of the tested population in the sharing economy across the selected social networks is only affected by respondents’ gender.
Figure 5 shows the segments of the sharing economy that are utilised the most by respondents in the population of the sample set.
2,27%
36,36%
39,77%
0,00%
7,95%
13,64%
0,00% 5,00% 10,00% 15,00% 20,00% 25,00% 30,00% 35,00% 40,00% 45,00%
Primary education Secondary education Higher education
participate in the sharing economy do not participate in the sharing economy
Fig. 5.Participation in the sharing economy according to segment Source: Authors.
P2P lending is by far the biggest segment, followed by P2P lending and couch surfing. The chart shows that P2P lending (55.07%) and P2P lending couchsurfing (17.39%) are the mostly widely utilised services by respondents within the sharing economy.
4 Conclusion
The objective of this paper was to examine the age gap between male and female respondents participating in the sharing economy across selected social networks. It was determined that the gap between the arithmetic mean for male and female respondents was 2.51 years, that the gap between the upper age limit of the male and female participants in the sharing economy was 20 years, and that the lower age limit gap was negligible (only one year). The age breakdown of the male and female participants in the sharing economy was illustrated using a box diagram. A contingency table was used to describe the structure of participation in the sharing economy across the social networks according to the region of the permanent address of the respondents and their gender. Another objective of this paper was to identify other variables that may affect participation in the sharing economy of the respondents involved in the tested sample. The respondents’ gender was the first variable studied by the authors. The data obtained from a questionnaire survey were entered into a contingency table and subjected to a Pearson's chi-squared test of independence, the results of which demonstrated the importance of gender for participation in the sharing economy. This finding did not apply to the other identified variables in the analysis. The authors also determined that among the population of the sample set P2P lending was the most utilised service within this market segment.
References
1. A. Bachmann et al., Online peer-to-peer lending - A literature review. Journal of Internet Banking and Commerce, 16(2), 1-18, (2011)
2. I. B. Armet, et al., Peer-to-peer carsharing: Exploring public perception and market characteristics in the San Francisco Bay area. Transportation Research Record: Journal of the Transportation Research Board, 2(2416), 27-36, (2014)
43,18%
13,64%
11,36%
4,55% 5,68%
21,59%
0,00% 5,00% 10,00% 15,00% 20,00% 25,00% 30,00% 35,00% 40,00% 45,00% 50,00%
p2p lending p2p lending and couchsurfing
p2p lending
and more p2p lendingand car sharing
other do not
participate in the sharing
[image:9.482.66.421.67.255.2]3. R. Belk, Why Not Share Rather Than Own? The ANNALS of the American Academy of Political and Social Science, 611(1), 126-140, (2007)
4. R. Belk, You are what you can access: Sharing and collaborative consumption online. Journal of Business Research, 67(8), 1595-1600, (2014)
5. F. Bonciu, Impact of the sparing economy on the labour market. Romanian Economic and Business Review, 43-51, (2016)
6. R. Botsman, R. Rogers, Harvard Business Review, Beyond Zipcar: Collaborative Consumption [online], Available at:
https://hbr.org/2010/10/beyond-zipcar-collaborative-consumption (2010)
7. R. Botsman, Fast company, The Sharing economy lacks a shared definition [online], Available at:
https://www.fastcompany.com/3022028/the-sharing-economy-lacks-a-shared-definition (2013)
8. CouchSurfing International, CouchSurfing Raises $7.6 Million in Series A From Benchmark Capital and Omidyar Network to Expand Services and Fuel Growth in Cultural Exchange Network (2011)
9. Couchsurfing.cz, Co je Couchsurfing. [online] Available at: www.Couchsurfing.cz (2018)
10. A. Erceg, Carsharing situation in Croatia. Ekonomski vjesnik: Review of Contemporary Entrepreneurship, Business, and Economic Issues, 27(1), 183-195, (2014)
11. M. Felson, L. Spaeth, Community Structure and Collaborative Consumption: "A Routine Activity Approach". American Behavioral Scientist, 21(4), 614-624, (1978) 12. L. Gansky, The mesh: why the future of business is sharing, (2010)
13. A. Gregory, G. Halff, Understanding public relations in the ‘sharing economy’. Public Relations, Review, 43(1), 4-13, (2017)
14. R. Hampshire, C. Gaites, Peer-to-Peer Carsharing Market Analysis and Potential Growth. Transportation Research Record Journal of the Transportation Research Board, 2217(1), 119-126, (2011)
15. T. H. Webb, Peer-to-Peer Lending Market 2015, Platforms Revolutionizing Traditional
Practices, M2 Presswire [online] Available at:
https://www.m2.com/m2/web/publication.php/m2presswire (2015)
16. Pricewaterhousecopers, Consumer Intelligence Series: The Sharing Economy, PricewaterhouseCoopers [online] Available at: https://www.pwc.com/cz/cs.html (2015)
17. S. Shaheen, A. Cohen, Innovative mobility carsharing outlook carsharing market overview, analysis, and trends, (2016)
18. P. Teffer, The 'sharing economy' lacks a common definition, (2017)
19. The Economist, Banking without banks. The Economist Newspaper Limited [online] Available at: