RIT Scholar Works
Theses
Thesis/Dissertation Collections
11-16-2012
Micro-extrusion process parameter modeling
Anuj Datar
Follow this and additional works at:
http://scholarworks.rit.edu/theses
This Thesis is brought to you for free and open access by the Thesis/Dissertation Collections at RIT Scholar Works. It has been accepted for inclusion in Theses by an authorized administrator of RIT Scholar Works. For more information, please [email protected].
Recommended Citation
Micro-extrusion Process
Parameter Modeling
Anuj Datar
Thesis submitted to the Faculty of the
Rochester Institute of Technology
In partial fulfillment of the requirements for the degree of
Master of Science
in
Industrial Engineering
Thesis Committee
Dr. Denis Cormier
Dr. Marcos Esterman
Department of Industrial and Systems Engineering
DEPARTMENT OF INDUSTRIAL AND SYSTEMS ENGINEERING
KATE GLEASON COLLEGE OF ENGINEERING
ROCHESTER INSTITUTE OF TECHNOLOGY
ROCHESTER, NEW YORK
CERTIFICATE OF APPROVAL
November 16, 2012
M.S. DEGREE THESIS
The M.S. Degree Thesis of Anuj Datar
has been examined and approved by the
thesis committee as satisfactory for the
thesis requirement for the
Master of Science degree
Approved by:
Dr. Denis Cormier, Thesis Advisor
i
Abstract
Direct write processes are a family of technologies with the ability to deposit functional structures directly
onto planar and non-planar surfaces. Direct writing includes a variety of processes that use different
mechanisms to transfer materials on to substrates and can be generally distinguished from conventional
rapid prototyping processes by a feature resolution in the sub-micron to micron range. The dispensing
system studied in this thesis is a pneumatically actuated micro-extruder which is capable of processing a
wide variety of materials. This material dispensing tool is capable of depositing small amounts of material
to build three dimensional structures in an accurate and repeatable manner. The material dispensing
system in this study has a variety of manufacturing applications ranging from printed electronics to
biomedical applications.
The material dispensing system employs a needle valve mechanism that allows ink or slurry to be
deposited onto a substrate using air pressure. The dispensing tool used for this research is an nScrypt
SmartPump. This research is focused on analyzing the extrusion process and developing and validating a
parametric model for the input parameters using a design of experiments (DOE) approach. The aim is to
improve the repeatability and accuracy of the process.
A two phase approach was used to identify significant input parameters impacting the dimensional
properties of a printed track. The first set of experiments employed a 2-level fractional factorial screening
design where all user controllable parameters were tested against the response variables – height and
width of a printed track. Significant parameters from this analysis were then used to build a regression
equation for both height and width. It was observed that while the regression equation for height was
accurate in predicting the output at intermediate levels, the regression equation for width was unable to do
so and displayed signs of curvature. A higher order three-level regression model was then fit to the
significant parameters for width and was found to be satisfactory in predicting process output. The errors
observed between predicted outputs from the regression equations and actual output dimensions from the
ii
Acknowledgements
First and foremost I would like to thank Dr. Denis Cormier, for his guidance and support throughout my master’s degree. Without his input and inspiration, this thesis would not have been possible. I am grateful
to have had the opportunity to learn from him and work with him on the HeteroFoaM research project. I
would also like to thank Dr. Marcos Esterman for his patience and the invaluable guidance he provided
during the course of my thesis. I would like to express my gratitude towards the Industrial and Systems
Engineering Department for their help and support over the last three years.
I would like to thank my lab mates Sundaresan Balasubramanian, Prasanna Khatri-Chhetri, Niranjan
Damle Hrushikesh Godbole, and Matt Purcell, who made working in the lab such a wonderful experience.
I would also like to thank my friends Tejas, Kaushik, Sujay, Bhavesh, Vignesh, Ashish, Kamlesh and
many others whose names are not in the list, for making my stay at Rochester enjoyable and memorable.
Finally, I would like to thank my parents Surekha and Vishwas Datar and my brother Akshay for their
unwavering faith and support. Without them this would not have been possible.
This work was supported by Heterogeneous Functional Materials Center (HeteroFoaM), an Energy
Frontier Research Center (EFRC) funded by the U. S. Department of Energy and Office of Basic Energy
iii
Contents
Chapter 1: Introduction ... 1
1.1 Additive Manufacturing ... 1
1.1.1 Applications of Additive Manufacturing ... 2
1.1.2 The Generic Additive Manufacturing Process ... 3
1.2 Direct Write ... 3
1.2.1 Droplet Based Processes ... 4
1.2.2 Laser Based Processes ... 5
1.2.3 Focused Ion Beam and Electron Beam CVD ... 7
1.2.4 Flow Based Processes ... 7
1.2.5 Tip Based Processes ... 8
1.2.6 Materials in DW ... 9
1.2.7 Applications of DW ... 9
1.3 nScrypt ... 10
1.3.1 Operating Mechanism ... 13
1.4 Problem Statement ... 14
1.4.1 User Controlled Process Parameters ... 15
1.5 Thesis Objectives ... 16
Chapter 2: Literature Review & Research Methodology ... 17
2.1 Literature Review ... 17
2.1.1 Robocasting ... 17
2.1.2 Process Parameter Modeling ... 18
2.2 Methodology ... 19
2.2.1 Ink Preparation ... 19
2.2.2 Printing ... 20
iv
Chapter 3: Experimental Results and Discussion ... 22
3.1 Preliminary Experiments... 22
3.1.1 Paste Properties ... 23
3.1.2 Feasibility Test ... 24
3.1.3 Validation ... 26
3.2 Screening Experiment ... 28
3.2.1 Analysis of Height Data ... 30
3.2.2 Analysis of Width Data ... 32
3.2.3 Validation ... 34
3.3 Higher Order Model ... 36
3.3.1 Validation for Higher Order Regression ... 39
Chapter 4: Conclusions and Recommendations ... 41
4.1 Summary ... 41
4.2 Contributions ... 42
4.3 Future Work Recommendations ... 43
Bibliography ... 45
Appendix A: nScrypt Machine Code ... 48
Appendix B: Screening Experiment ... 49
B.1 Screening Experiment Data ... 49
B.2 Screening Experiment for Height – Minitab Output ... 53
B.3 Screening Experiment for Width – Minitab Output ... 56
Appendix C: Higher Order Experiment for Width ... 59
C.1 Experimental Data ... 59
v
List of Figures
Figure 1: (a) Continuous ink jetting (CIJ) system; (b) Drop-on-demand (DOD) inkjet system [9] ... 4
Figure 2: Schematic diagram of the aerosol jet direct write system [9] ... 5
Figure 3: (a) Laser activated electroplating; (b) Laser induced forward transfer (LIFT) [9] ... 6
Figure 4: A laser based DW system used in both additive (right) and subtractive (left) modes [12] ... 7
Figure 5: Material deposition using DPN [11] ... 8
Figure 6: Material deposition using NFP [9] ... 9
Figure 7: A 35GHz fractal antenna printed on the abdomen of a dead honeybee using MAPLE DW [2] 10 Figure 8: SmartPump schematic ... 11
Figure 9: Flowrate vs. dispensing height [15] ... 13
Figure 10: Functioning of the SmartPump; (a) syringe with paste attached to the assembled valve body; (b) air pressure applied to the syringe; (c) when air pressure is applied and valve is opened. ... 14
Figure 11: Mixing cycle program for the Thinky mixer ... 20
Figure 12: Ink vehicle viscosity vs. spindle rpm ... 23
Figure 13: Viscosity vs. shear rate of paste with 24g/ml solid loading ... 24
Figure 14: Width vs. pressure ... 26
Figure 15: Prediction value using Eureqa ... 27
Figure 16: Half normal plot for screening height analysis ... 30
Figure 17: Residual plots of regression analysis of height from screening experiment ... 31
Figure 18: Normality test for residuals from regression analysis of height from screening experiment .... 31
Figure 19: Half normal plot for screening width analysis ... 32
Figure 20: Residual plots of regression analysis of width from screening experiment ... 33
Figure 21: Normality test for residuals from regression analysis of width from screening experiment ... 33
Figure 22: Residual plots of regression analysis of width from higher order model ... 38
Figure 23: Normality test for residuals from regression analysis of width from higher order model ... 38
Figure 24: Main effects plots for higher order experiment ... 64
vi
List of Tables
Table 1: Possible outcomes of printing ... 16
Table 2: Preliminary experiment data ... 25
Table 3: Factor levels for screening design ... 28
Table 4: Validation experiment process parameter settings ... 34
Table 5: Validation experiment output for height ... 35
Table 6: Validation experiment output for width ... 35
Table 7: Factor levels for higher order experiment ... 36
Table 8: Factor levels for validation of higher order experiment ... 39
Table 9: Data from validation experiment of higher order experiment ... 39
Table 10: Design table and data from the screening experiment ... 49
Table 11: Mean and standard deviation for screening experiment width data ... 51
Table 12: Mean and standard deviation for screening experiment height data ... 52
Table 13: Design table and data from higher order experiment for width ... 59
1
Chapter 1
Introduction
1.1 Additive Manufacturing
Additive manufacturing (AM), also known as solid freeform fabrication (SFF), refers to a group of
technologies wherein a part is manufactured directly from graphical computer data [1]. Additive
manufacturing techniques work by virtually slicing 3D CAD models into a series of cross-sections, or
layers with finite thickness. Material is then deposited one layer at a time to build up a part. This gives
one the latitude of building complex 3D parts that are otherwise either difficult or impossible to produce
using conventional manufacturing methods like CNC machining. Additive manufacturing is often referred
to as Rapid Prototyping. These techniques generally eliminate the lead time necessary to design and
manufacture specialized tools or dies required during the product design and development process.
Stereolithography was the first of such techniques, developed in the mid 1980’s [2, 3]. Since then, several
technologies have emerged that enable the use of a variety of materials. Additive manufacturing
techniques can be classified in many ways based on materials, processes, tools, etc. Additive
manufacturing techniques can be classified as solid, liquid, and powder based processes. Solid based
processes include sheet based processes; liquid based processes include photo-polymerization processes,
extrusion based processes, and printing processes; powder based processes include powder bed fusion
processes, and beam deposition processes [2, 4].
Stereolithography, a process developed by 3D Systems, works on the principle of photo-polymerization
where a laser scans the surface of a photo-sensitive resin curing one layer at a time. Fused deposition
modeling, developed by Stratasys Inc., works by melting a thermoplastic material and extruding this
molten material through a nozzle. Inkjet printing has been used to deposit a variety of materials, for
example powders (metals, ceramics) suspended in liquids, metals with low melting points, wax,
photo-sensitive polymers, proteins and others [5]. Another process that uses inkjet printing, known as 3D
printing, works by printing droplets of binders onto powder beds of metals, ceramics, etc. 3D printing was
or a thermal print head is used to print drops of a liquid material that has a viscosity similar to that of
water.
Beam deposition systems and powder bed fusion processes are similar in the fact that they both use
energy beams like electron-beams or lasers. Beam deposition systems melt material while it is being
deposited, whereas powder bed fusion processes melt material in a pre-laid bed of powder. Laser sintering
has the ability to work with a large number of materials including metals, ceramics, polymers, etc. [2, 4,
6, 7], while electron beams can only be used for conducting materials[2]. Extrusion based processes
involve extruding a gel or paste like material through an orifice or nozzle. In processes like fused
deposition modeling a solid is melted and the resulting liquid is extruded through a nozzle [2, 4].
Extrusion based processes have been used to deposit bio materials for host frameworks called scaffolds
for tissue formation [2, 8]. Sheet lamination processes use different mechanisms to bond sheets of
material and cut the individual sheets or the stack [2].
1.1.1 Applications of Additive Manufacturing
Additive manufacturing (AM) has a wide variety of applications. Initially additive manufacturing was
used to create visualization models, i.e. prototypes for products as they were being developed, as physical
models are more useful than drawings or CAD renderings in the design process. Hence these processes
were initially termed rapid prototyping. As technologies developed and improved, the number of
applications for AM increased. AM, when used in conjunction with other technologies to form process
chains, can be used to significantly shorten product development times and costs. For example, parts
fabricated using conventional CNC machining or even 3D printing used in conjunction with maskless
deposition of electronic circuits can be used to fabricate functional prototypes in a short duration. Certain
AM technologies have been developed to the point where their output is suitable for end use. Some
technologies have also been adapted for mass production. For example, Invisalign braces by Align
Technology Inc. are mass produced dental braces using 3D printing. The ability to use lasers and energy
beams to process metals has greatly increased the possibilities and applications for AM. Some
applications of AM include biological or human implants such as hip, dental replacements, custom bone
1.1.2 The Generic Additive Manufacturing Process
In order to manufacture an object using additive manufacturing, the first step is to create a CAD model
(solid or surface representation) of the object. This can be done using a professional CAD package or by
reverse engineering techniques such as laser scanning, CT scanning, etc. The next step is to export or
convert this model to the .STL file format. STL files represent the surface of a solid or surface model
using triangles. Coordinates of these triangles are stored in a text or binary file [3]. This STL format is
used by most additive manufacturing processes. Next this .STL file is sliced into a series of layers of
finite thickness based on the height resolution of the process. This file now is ready to be transferred to
the machine controller for tool manipulation. Once the machine is set up with the right materials, the
parameters are set and the sliced .STL file is loaded, the build process is initiated. Most machines are
automated and only require superficial monitoring during the build process. Once building is complete,
the part has to be removed from the machine. Some processes produce functional parts that can be used
right out of the machine, while others require a certain degree of post processing. Post processing may
include cleaning, removal of support material, a finishing operation, a surface treatment operation, heat
treatment, etc. Now the part is ready for use.
Certain geometries, such as overhangs or delicate geometries, have a tendency to curl or fall apart during
the build process. These geometries cannot be produced without the use of proper support structures.
Fused deposition modeling by Stratasys utilizes a water soluble support material. In processes where
powder beds or resin reservoirs are used, the powder bed or reservoir themselves perform the function of
supporting structures. For such parts, a post processing step is required where support material is removed
and the part is cleaned. This is especially important in cases where these parts may be used for biomedical
application such as implants, or with Stereolithography parts where the photo-polymer can be a health
hazard.
1.2 Direct Write
Direct write (DW) is a subgroup of additive manufacturing technologies that have the ability to build up
structures on any functional surface, planar or non-planar, without any masking or tooling. These
techniques are generally associated with feature resolution in the micron range [2, 9, 10]. Employing
several mechanisms these techniques can process a variety of materials, from metals, ceramics, polymers
to electrically and optically functional materials [9]. DW processes can be broadly classified as droplet
based processes, laser and energy beam based processes, tip based processes and flow based processes.
1.2.1 Droplet Based Processes
Inkjet printing processes
Inkjet printing usually involves deposition of droplets of liquid precursor inks which solidify post printing
due to evaporation, cooling, chemical reactions, or other post processing. These processes are similar to
inkjet printing from additive manufacturing, but are mainly used to deposit thin layers of material, usually
electrically conducting circuits, on relatively flat surfaces rather than to build up height [2]. There are two
methods commonly used to generate droplets. These are continuous inkjet, and drop on demand inkjet
heads [9]. The continuous mode (CIJ), as shown in Figure 1(a) has a steady stream of electrically charged
ink droplets that are deflected onto a substrate electrostatically. The amount of charge induced and the
amount of deflection produced in each droplet is controlled by electrostatic fields generated between
electrodes. Uncharged particles fall back into a gutter and are recycled through the system. The drop on
demand (DOD) method, as shown in Figure 1(b) ejects drops of ink only when the system is required to
print. Liquid is ejected using either a thermal or a piezoelectric actuator using trigger signals.
(a) (b)
Figure 1: (a) Continuous ink jetting (CIJ) system; (b) Drop-on-demand (DOD) inkjet system [9]
Aerosol-Jet deposition
Aerosol-Jet direct write deposits material in the form of a jet or beam of aerosol mist. It works by
atomizing an ink, precursor or a colloidal suspension, and then delivering this aerosol mist in a stream of
may not be conformal. Originally developed by Optomec with the name Maskless Mesoscale Material
Deposition (M3D), this system utilizes pneumatic or ultrasonic mechanisms to atomize inks based on ink
properties. The system uses nitrogen as the carrier gas, as N2 is chemically stable and does not react
easily with most materials used in the process. Other carrier gases have been used in research as well. The
carrier gas is used to transport aerosol mist from the atomizer to the deposition head. A separate stream of
this carrier gas is also used to create annular flow at the nozzle to focus and collimate the Aerosol-Jet and
to provide precise control over printed tracks while maintaining zero contact of material with the nozzle,
thus avoiding clogging. Figure 2 shows a schematic diagram of the Aerosol-Jet deposition process.
Figure 2: Schematic diagram of the Aerosol-Jet direct write system [9]
1.2.2 Laser Based Processes
Laser based direct write methods use laser energy to transfer or deposit material from solid, liquid or
gaseous precursors to form 3D structures. These include laser chemical vapor deposition (LCVD), laser
enhanced electroless plating (LEEP), laser enhanced or activated electroplating, laser induced forward
transfer (LIFT), laser induced backward transfer and matrix assisted pulsed laser (MAPLE DW). LCVD
uses a gaseous precursor and the heat produced by the laser selectively transforms precursor gases to solid
material. LEEP uses a liquid precursor and the heat produced by the laser leads to decomposition of the
liquid and material deposition. Laser enhanced or activated electroplating uses the heat produced by the
laser scanning to accelerate material deposition during electroplating as displayed in Figure 3(a). LIFT
uses lasers to transfer a thin film of material from an optically transparent disk coated with material onto a
substrate. Laser induced backward transfer, shown in Figure 3(b) uses a laser to vaporize material and
deposit it onto an optically transparent surface. MAPLE is similar to LIFT but it uses a carrier material to
Laser processes are accurate, highly repeatable and may not need any further post processing. Certain
laser based DW processes, such as MAPLE DW or other similar forward transfer techniques, can also be
used with subtractive laser micromachining [11, 12]. Figure 4 shows a schematic of a laser based DW
system that can be used for both additive as well as subtractive DW.
(a) (b)
[image:15.612.74.536.179.443.2]Figure 4: A laser based DW system used in both additive (right) and subtractive (left) modes [12]
1.2.3 Focused Ion Beam and Electron Beam CVD
Focused ion beam (FIB) direct write or FIB CVD and electron beam CVD both operate in a manner
similar to laser CVD. An energy beam focused using an electrostatic lenses scans over a substrate in the
presence of a gaseous precursor, thus depositing solid material onto the substrate. FIB CVD utilizes a
beam of gallium ions generated from a liquid gallium source whereas electron beam CVD uses a beam of
electrons. Electron beam CVD is slower that FIB and laser CVD, but FIB and electron CVD offers better
resolution at the cost of a lower deposition rate as compared to laser CVD [2, 9]. If used directly on a
substrate, a focused ion beam causes sputtering and removal of atoms, and hence finds applications in
micro/nano machining as well [2].
1.2.4 Flow Based Processes
Flow-based direct write processes are characterized by technologies where a continuous flow of ink
occurs when printing. This is unlike inkjet printing or Aerosol-Jet systems where individual droplets are
deposited. Flow-based direct write systems involve pushing an ink through an orifice or nozzle onto a
plunger is activated using pneumatics or a mechanical push rod. They use 3-axes of motion control
similar to CNC machining to manipulate the nozzle in order to deposit three dimensional structures. A
pump-like system developed by nScrypt, which is based on Sciperio’s Micro-Dispense Direct Write
(MDDW) technology, uses a micro-dispensing pump and a syringe mechanism with precise air pressure
control to accurately deposit material. A system developed by nScrypt, called the Micro Mixer pump,
allows the user to mix up to three materials on the fly, thus producing engineered structures with locally
controlled mechanical or chemical properties. The MicroPen developed by OhmCraft is based on a
micro-capillary tip which uses a syringe and pneumatic ram to extrude material through the micro-micro-capillary
writing tip. Both of these technologies can be used to print on flat as well as conformal surfaces.
1.2.5 Tip Based Processes
These processes deposit inks using mechanisms similar to that of quills or pens. When a pen tip with ink
adhering to its surface is placed near a substrate, ink transfers from the tip to the substrate. Dip-pen
nanolithography (DPN), shown in Figure 5, works by dipping an atomic force microscope (AFM) tip into
an ink well. The specially formulated ink adheres to the AFM tip and is then used to write a pattern onto a
substrate. An array of such tips can also be used to deposit material simultaneously to increase the
throughput. Another tip based DW process known as a nanofountain pen (NFP), as shown in Figure 6, is
similar to the AFM tip DW process. However, it uses a nano-pipette instead of an AFM tip. A pipette is
filled with the ink solution and flows when the tip is brought in contact with the substrate. Tip based
[image:17.612.152.464.504.691.2]processes have been used to deposit proteins, polymers, other bio materials, etc.
Figure 6: Material deposition using NFP [9]
1.2.6 Materials in DW
Direct write processes utilize high grade starting materials. These inks, slurries or pastes may contain
powders, flakes, binders, organic precursors, vehicles, solvents, dispersants, or surfactants to produce
customized chemical and rheological properties [9]. As long as the materials that need to be deposited are
compatible with the substrate and can be bonded to be substrate with post-post processing techniques (if
required), they can be used in direct write. Materials that can be processed using DW include metals,
ceramics and salts. Inks and pastes made from powders are most common. Nano-powders are also used
but require special safety considerations due to health hazards and high surface energy of powder
particles.
1.2.7 Applications of DW
Due to their ability to produce parts of various sizes from nano to meso scale, and due to the wide range
of materials that can be printed, direct write techniques can be adapted to a variety of applications such as
microelectronics, MEMS, pharmaceutics, biomedical and tissue engineering, to name a few. Processes
such as inkjet DW, LCVD and LIFT are well established for micro-optics applications [9]. Wanke et al.
[13] used LCVD to deposit aluminum oxide 3D structures to totally reflect certain bands in the
electromagnetic spectrum to form mirrors. MAPLE DW has been used to deposit fractal antennas on
non-conformal bio-substrates, the abdomen of honeybees to be precise [2, 10]. Due to speed limitation of the
laser, only partial antennas were printed on the live specimen. However, a complete antenna was printed
on a dead honeybee. Figure 7 shows a printed a printed antenna on the abdomen of the dead honeybee
Tong et al. used a combination of thermal spraying (additive DW) and ultrafast laser micromachining
(subtractive DW) to fabricate embedded microheater structures [14].
Figure 7: A 35GHz fractal antenna printed on the abdomen of a dead honeybee using MAPLE DW [2]
1.3 nScrypt
nScrypt, Inc. formed in 2002, developed a direct write system based on Sciperio’s Micro-dispense
Direct-Write (MDDW) technology through the DARPA (US Government Defense Advanced Research Projects
Agency) MICE program (Mesoscopic Integrated Conformal Electronics). The nScrypt tabletop material
dispensing system uses a syringe based high precision extrusion pump to dispense inks or pastes. It uses
precision slides to accurately manipulate motion in the X, Y and Z directions in a reproducible manner.
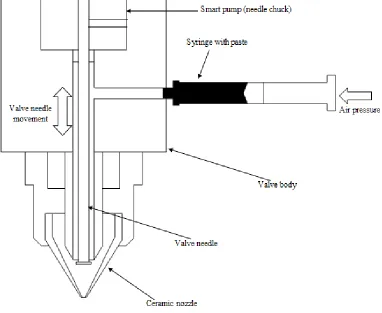
The SmartPump is a device that uses air pressure at the syringe end and a valve mechanism near the
nozzle to precisely control the amount of material dispensed. Figure 8 provides a schematic of the valve
mechanism in a SmartPump. It is available in two sizes, 20 pico-liters and 100 pico-liters. An nScrypt
system incorporating a precision Z stage with a height sensor has the ability to print on non-conformal
surfaces. The height sensor scans the surface of the substrate prior to deposition and then adjusts machine
code in order to follow the non-conformities in the surface. It is a time-pressure dependent system in
which the amount of material dispensed is directly proportional to the duration and amount of the applied
pressure. The process is controlled by motion control software which allows the user to control the
following process parameters – air pressure, valve opening, valve opening and closing speeds, feed rate,
motion delays, and dispensing height. A conical ceramic nozzle tip attached to the pump controls the
shape of the extrudate. These conical nozzles, developed by nScrypt Inc., are optimized to dispense
greatly reduced as compared to traditional tubular nozzles [15, 16]. Nozzle tips are available in various
orifice sizes from 12.5 to 125 microns inner diameter. Precisely controlled parameters allow the system to
produce a negative pressure inside the valve body when the machine is ordered to stop printing. This causes a phenomenon nScrypt terms as “self-aspirating” or “suck-back” [15], that sucks the ink back into
the nozzle to reduce material build up at the tip of the nozzle over time. This phenomenon is used to
overcome the drawback with other such dispensing systems which are prone to material build up at the
nozzle tip over time, reducing their accuracy in placement and dispensing [15]. nScrypt also produces a
micro mixer pump that allows the user to print up to three materials simultaneously in order to vary the
ratios of the three materials being deposited. This is done by controlling individual air pressures and valve
openings. The SmartPump is capable of dispensing liquids with viscosities ranging from 1 up to
1,000,000 cP [15]. Chen et al. [17] used a silver paste, of about 275,000 cP, to pattern high aspect ratio
conducting grid lines on silicon solar cells. Upon investigation, it was observed that the high aspect ratio
and fine printed lines promote conductivity and reduce impedance. The overall efficiency of the cell is
[image:20.612.123.505.360.673.2]increased by 0.5% as compared to screen printed cells.
Due to its ability to handle a wide range in viscosities, the nScrypt material dispensing system prints most
materials as long as they can be converted into a paste and provided the diameter of the largest particles in
the paste are less than the inner diameter of the nozzle used [18]. Li et al. [15] have used this system to
print solder paste with a viscosity of 30000cP, as well as a silver particle loaded conductive ink, resistive
inks, and polycaprolactone (PCL) dissolved in acetic acid as a bio-scaffold material for tissue engineering
applications. Blackburn et al. [18] used ceramic powders such as gadolinia-doped ceria (GDC),
yittria-stabilized zirconia (YSZ), LSM and LSCF, from solid oxide fuel cell and gas sensor applications with
particle sizes from 150 to 750 nm. Pastes were prepared by mixing them with binder vehicles. These
mixtures were prepared using a Thinky centrifugal mixer. Pastes with high solids loading were produced
by mixing the powders with a water-based solution. Darvan-C was used to disperse the sub-micron
particles [18].
Kadara et al. [16] demonstrated volumetric reproducibility of electrochemical platforms using an nScrypt
material dispensing tool. The authors compared its performance to those of electrochemical platforms
produced using screen printing. A carbon-graphite ink was used to manufacture 3mm diameter circles of
20µm thickness on a polymer substrate, and the tested samples exhibited electrochemical responses and
reproducibility comparable to samples manufactured using screen printing [16].
Lopes et al. [19] used a conjunction of stereolithography and the nScrypt SmartPump 100pL to fabricate
2D and 3D embedded electronic circuits as an alternative to conventional PCB manufacturing.
Conventional techniques limit the PCB to a planar design and increased space requirements. Li et al. [15]
implemented the precise control of the SmartPump’s pumping technology to print an array of 1000 dots,
with only a 10% variation in dot size, to demonstrate applications in the electronics and MEMS industry.
As discussed above, existing research on nScrypt material dispensing systems has primarily been focused on replacing conventional material deposition processes with nScrypt’s maskless non-contact printing
technique, especially in the printed electronics field. Li et al. [15] have done some preliminary research
on the effects of dispensing height or tip standoff on the flow rate of material exiting the nozzle. Figure 9
is a graphical representation of the effect of dispensing height and pressure on the flow rate as studied by
Figure 9: Flowrate vs. dispensing height [15]
1.3.1 Operating Mechanism
The nScrypt tabletop dispensing system uses a three axis motion platform with X and Y stages to move
the work table, and a Z stage to move the deposition head. The deposition head, or SmartPump employs a
needle valve type mechanism that very accurately controls material flow using air pressure and valve
position control. The valve body holds the ceramic nozzle through which the ink is extruded and
deposited onto a substrate. An ink or paste is made and is drawn into a 3cc plastic syringe barrel. The
syringe is then attached to the valve body using a 10-32 luer adapter. Figure 8 shows a schematic of a
SmartPump with a syringe connected to the valve body. A source of pressurized air is connected to the
rear side of the syringe. Air pressure is then applied to the syringe, and the ink or paste flows into the
valve body. When the valve rod is moved down, the hermetic seal between the valve rod and valve body
is opened. Ink then flows into the nozzle. Figure 10 shows the operating mechanism of a SmartPump in
the three steps described above. When the pressure crosses a certain threshold level for a given ink’s
rheological properties, ink flows out of the nozzle. By manipulating movement of the X, Y and Z, stages
three dimensional structures can be built layer by layer. When the valve rod moves back up, the valve
closes and the flow of ink stops. This upward movement of the valve rod produces a small negative
pressure within the valve body which sucks the ink at the tip of the nozzle back up into the chamber. This
keeps the nozzle tip clean, reduces material buildup at the tip, and provides precise control over material
flow at the start and stop of a print cycle. 0
0.5 1 1.5 2 2.5
10 20 30 40 50 75 100
Flow
R
at
e
(n
L/
s)
Dispensing height (microns)
20 PSI
10 PSI
(a) (b) (c)
Figure 10: Functioning of the SmartPump; (a) syringe with paste attached to the assembled valve body; (b) air pressure applied to the syringe; (c) when air pressure is applied and valve is opened.
All machine parameters are controlled by software provided by nScrypt. The air pressure and print home
or job home (starting X, Y and Z, meaning starting standoff) are controlled by the software. Other
parameters, namely feed rate, valve positions, valve opening and closing speeds, and feed rate (tool
manipulation in X, Y and Z) are controlled using a script file in text format (*.TXT). A sample machine
code used in the experiments is given in Appendix A.
1.4 Problem Statement
Process parameter values used with the nScrypt tool will dictate dimensional properties of print tracks.
Depending on the application, one might need to control the height and/or width of a track. For example,
large area fill patterns may require wide tracks with controlled layer thickness, whereas applications
requiring a large number of features packed in a small area may require narrow print tracks that are tall
enough to provide a sufficient cross-section for applications requiring high electric/ionic conductivity. A
large part of the research conducted on the nScrypt SmartPump deals with its application to fields such as
printed electronics, MEMS, sensors etc. Blackburn et al. [20] conducted two experiments to plot the
effects of feed rate and air pressure in the thickness and width of printed lines. Li et al. [15] conducted an
experiment to measure the effects of standoff distance and air pressure on the volumetric flow rate of
or solid loading fraction on the dimensions of printed lines is lacking. Also, a single process model
incorporating all the user controlled process parameters has not yet been presented in literature. The
primary goal of this thesis is to develop such a process model.
1.4.1 User Controlled Process Parameters
The nScrypt material dispensing system is based on a micro-extrusion process, and the output feature size
is controlled by varying user controlled input parameters fed into the system. Controllable parameters of
the nScrypt system with the SmartPump tool attachment are as follows.
1. Valve position – the position of the valve needle when valve is opened, influences the flow rate of
the ink exiting the valve body and entering the nozzle.
2. Standoff distance – the distance between the nozzle tip and the printing substrate, measured in ‘mm’. This influences the shape of the track.
3. Air pressure – applied at the back end of the syringe that contains the ink or paste that the system
needs to extrude. Air pressure influences the flow rate of the ink and is measured in PSI
4. Valve opening speed – the speed at which the valve needle translates, in mm/sec, when the valve
is opened. It influences the flow of the material at the start of the print cycle.
5. Feed rate – travel speed, in mm/sec, of the nozzle during printing controls the amount of ink
deposited per unit length, and affects the width and continuity of the bead.
6. Motion delay – the time for which the nozzle waits at the point where the needle valve is opened
to allow initial flow of material and to obtain a uniform bead width over the entire bead. It is
measured in seconds.
7. Nozzle diameter – diameter of the nozzle opening in µm. It affects the flow rate of the ink and the
diameter of the extruded track.
8. Ink viscosity – this property of the ink affects the flow of the ink throughout the print cycle.
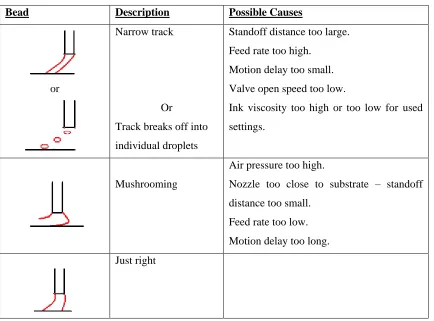
Some effects of individual parameters or a combination of parameters on the dimensional properties of a
Table 1: Possible outcomes of printing
Bead Description Possible Causes
or
Narrow track
Or
Track breaks off into
individual droplets
Standoff distance too large.
Feed rate too high.
Motion delay too small.
Valve open speed too low.
Ink viscosity too high or too low for used
settings.
Mushrooming
Air pressure too high.
Nozzle too close to substrate – standoff
distance too small.
Feed rate too low.
Motion delay too long.
Just right
In order to accurately print a designed structure, it is imperative to be able precisely predict process output
based on machine input parameters. Hence, a statistical model that relates the input parameters of the
nScrypt micro-extrusion process to the dimensional properties of the output of this micro-extrusion
process is required.
1.5 Thesis Objectives
As discussed previously, this thesis aims to fill the knowledge gap left by the lack of a method to
accurately predict the process output of an nScrypt SmartPump by investigating the effects of changing
process parameters on process output. The primary objectives of this thesis are to study the process
parameters of the nScrypt tool and to develop a mathematical relationship between process input
17
Chapter 2
Literature Review & Research Methodology
2.1 Literature Review
2.1.1 Robocasting
Traditional additive manufacturing techniques for processing ceramics, such as 3D printing onto ceramic
beds, produce porous parts. Several techniques have been used to produce dense ceramic parts such as
fused deposition of ceramics (FDC), laminated object manufacturing (LOM) with ceramic loaded tapes,
modified stereolithography (STL) with ceramic loaded UV-curable resins and extrusion techniques using
organic solvent based particulate slurries. These techniques require binder burnout prior to sintering.
Sandia National Labs developed a technique called robocasting which is a slurry or paste extrusion based
additive manufacturing process similar to nScrypt’s SmartPump technology. Robocasting employs
aqueous particulate slurries not requiring organic binders. Since binder burnout is not required, parts can
be printed, dried and sintered within 24 hours [21, 22]. The slurries used in this process are highly loaded
with ceramic powder (50-65% by volume) and have 35-50 vol.% volatile solvent (usually water) with less
than 1 vol.% organic additives or dispersants [21, 22]. Computer controlled robotics are used to deposit
these ceramic slurries through an orifice. The size of the orifice can range from as small as 200 µm to as
large as 2 mm [21]. The slurries are developed such that they are pseudoplastic enough to flow through
the orifice. However, the solvent needs to be volatile enough to stop the mass from flowing after
deposition. This allows accurate shape reproduction and gives the user the ability to stack layers and build
structures with high aspect ratios. Robocasting equipment has the ability to print on flat or curved
surfaces made from plastics, ceramics or metals [23]. As the material is extruded, the orifice motion
relative to the substrate, coupled with the given flow rate of material at the orifice, produces the required
diameter of the extruded bead. A mixing head developed for robocasting, at Sandia National Labs, has
the ability to deposit up to four different materials at once. The mixing system uses a rotating paddle in a
small mixing chamber just before the orifice to uniformly mix the materials before deposition [21].
Cesarano et al. [21, 22] have printed functionally graded materials (ceramics and metals) [24], and three
Denham et al. [25] studied the mechanical behavior of robocast alumina. They concluded that the
densities exhibited by robocast samples were comparable to alumina processed by traditional techniques
such as slip casting and pressing. However, the mechanical strength of robocast alumina was dependent
on the tool paths used to build the test samples. Strengths of robocast samples along the print direction
were comparable to the slip cast samples. Whereas strengths of robocast samples perpendicular to the
direction of print were less than slip cast samples, but higher than that of the pressed samples. Russias et
al. [26] employed robocasting to fabricate porous hybrid organic/inorganic biocompatible scaffolds. The
inorganic components were either hydroxyapatite powders or high-silica bioactive glass, and their
inclusion increased the stiffness of the scaffold without making the scaffold brittle. Scaffolds with up to
70 wt.% ceramic content could also be machined. The organic content of the scaffolds used were two
Food and Drug Administration (FDA) approved bioresonable polymers for medical applications, namely
poly lactic acid (PLA or polylactide) and polycaprolactone (PCL) [27, 28].
2.1.2 Process Parameter Modeling
Process parameter settings can greatly influence the productivity, quality, and costs of production for a
given process. Determining optimal process parameter values is beneficial in any industry. Trial-and-error and Taguchi’s parameter design methods have commonly been used as tools for determining optimal
process parameters [29]. Taguchi’s parameter design technique is a variation of the classical design of
experiments concept. Oktem et al. [30] applied the Taguchi optimization technique to reduce warping in
thin-shell plastic injection molding parts. They used MoldFlow to generate data from different
combinations of process parameters based on a three level orthogonal Taguchi design and analyzed the
data using signal-to-noise and analysis of variance (ANOVA) to determine the effects of process
parameter on warpage and shrinkage.
Deng et al. [31] explain that using a trial-and-error process can be costly and time consuming. Moreover,
it is impossible to verify the actual optimal process parameter settings using the trial and error method.
And although Taguchi’s parameter design method offers orthogonal and robust designs, one can only find
the optimal output levels using discrete values of parameter levels and level combinations that are
specified in the design [29, 31, 32]. Hence Taguchi’s approach becomes unsuitable when one of the
process parameter variables is continuous. Furthermore, when engineers deal with a multi-response
process parameter design problem, the conventional Taguchi parameter design method runs into
Linear regression and linear programming are widely used techniques for solving optimization problems
[29]. This method basically expresses the response or dependent variable as a linear function of process
parameters or independent variables where the terms of the function, parameters, and unknown constants
are linear. Deng et al. [31] used a combination of Taguchi’s parameter design method, regression analysis
and the Davidon-Fletcher-Powell (DFP) method to determine optimal process parameter settings of
injection molding. They used a three phase process where the first step was to use Taguchi’s parameter
design method to obtain an initial optimal solution. This is followed by regression analysis to build a
prediction model where the target response variable is expressed as a dependent variable in terms of the
controllable process parameters (the independent variables). In the third phase, the DPF method was
applied so that the target value for the response variable was used to search for the final optimal process
parameter settings.
When using experimental design, it is critical to decrease the number of runs in the study. This helps
reduce the amount of time required with the machine, and it limits the use of material resources as well
[33, 34]. To reduce the number of runs, high-order interactions are assumed to be negligible so that the
information for main effects and low-order interactions can be obtained from a fraction of the
experimental runs of a full factorial experiment [34]. This is done by confounding main effects and
low-order interactions with high-low-order interactions. Designs where main effects are confounded with
three-factor interactions and designs where two-three-factor interactions are confounded with two-three-factor interactions
are called Resolution IV designs. Resolution IV designs allow the experimenter to estimate all the main
effects and some of the two-factor interaction effects. Resolution IV or better designs are ideally preferred
[35].
2.2 Methodology
For this work, all experiments have been conducted using an nScrypt Tabletop Material Dispensing
System with the SmartPumpTM tool. The ink formulation and printing conditions are further detailed as
follows.
2.2.1 Ink Preparation
All experiments were carried out using NiO-YSZ (a mixture of Nickel Oxide and Yttria-stabilized
Zirconia) based ink. NiO-YSZ is a typical anode material in a YSZ based solid oxide fuel cell (SOFC).
purchased from Fuel Cell Materials (www.fuelcellmaterials.com). Predetermined quantities of powder
and ink vehicle were measured and transferred to a 35ml mixing cup. A homogenous paste was prepared
using a Thinky ARE-310 planetary centrifugal mixer. The ink vehicle uses a low vapor pressure terpineol
solvent. The spinning of the ink in a centrifugal mixer causes the mixture to heat up. To avoid solvent
loss, a mixing cycle with pauses in between steps was followed to allow for cooling of the mixture.
Figure 11 shows a graphical representation of the mixing cycle. Once mixed, paste was transferred to a
3cc syringe and used for printing.
Figure 11: Mixing cycle program for the Thinky mixer
Since materials used for paste preparation have a high cost, and a large quantities of paste are required for
accurate and repeatable viscosity measurements, the solid loading fraction of the paste was used in place
of viscosity, viz. the ratio of the mass of powder (in grams) to the volume of ink vehicle (in ml).
2.2.2 Printing
The 3cc syringe, once filled with paste, was connected to the valve body in an nScrypt SmartPump
dispensing system using a luer to 10-32 adapter. An air pressure line was connected to the rear end of the
syringe. The valve rod was moved to its open position, and pressure was turned ON. Once the paste
started flowing and equilibrium was reached, the valve was closed. A 3”x4” sheet of Mylar was cut and
placed on the vacuum platen of the nScrypt machine. The vacuum pump was turned on to securely hold
the substrate down during printing. The printing surfaces were cleaned using 2-propanol before printing.
The nozzle tip was then brought to the desired printing location. Once all parameter were set to the
0 500 1000 1500 2000 2500
0 31 60 91 121 152
Mixing
Speed
(rpm)
experimental value and equilibrium was reached, the script file was loaded and executed. The printed
lines were then allowed to air-dry for 24 hours before being transferred to the measuring apparatus.
2.2.3 Measurement
Two different measuring instruments were used to conduct the measuring part of the experiment.
1. Hirox KH 7700 digital microscope
Printed samples were placed on a white background under the microscope to provide adequate
contrast. The microscope was focused on the bottom layer of the printed line, and line width was
measured from edge to edge of the printed line using parallel measure bars.
2. Keyence IL-030 laser profilometer
The IL-030 laser sensor was used in conjunction with an amplifier unit, IL-1000 and a serial
communication unit, DL-RS1A. The communication unit was set up using a mechanical relay and
a function generator such that it sent six data points every second. The substrate was translated at
30µm/sec. The effective sampling rate of the system became one data point every 5µm. Printed
samples were placed on the nScrypt platen, and the laser profilometer was zeroed on the surface
of the Mylar sheet. The output from the communication unit was stored in an MS Excel
22
Chapter 3
Experimental Results and Discussion
3.1 Preliminary Experiments
Initial experiments were conducted to test the feasibility of fitting a regression model to predict process
output as a function of parameter settings. It was hypothesized that the following effects would result
from changes in input parameters:
1. Air pressure should control the mass flow rate, i.e. amount of material being pushed out of the
nozzle tip. Higher pressures should translate to higher mass flow rates.
2. Higher viscosities (solid loading fractions) make it difficult for the ink to flow. Thus higher air
pressures should be required to extrude highly viscous pastes.
3. Lower viscosity (solid loading fraction) allows the ink to flow more easily. This would cause the
ink to flow laterally after it has been deposited. Hence the resulting line width should be wider
than what was initially deposited.
4. The amount of material deposited should be inversely proportional to the feed rate. At lower
speeds more material is deposited, whereas at excessively high speeds too little material will be
deposited per unit travel. In this case the printed track should break up into small beads.
5. Standoff distance affects the flow rates of ink extruded through the nozzle. If the nozzle is too
close to the substrate, there should not be enough room for the ink to flow and material flow
should be reduced. If the nozzle is too high up from the substrate, beads of paste flowing out of
the nozzle will break up due to surface tension and the printed track will not be continuous [15].
6. Ease of flow also depends upon the nozzle size. Smaller nozzles should require lower viscosities
and/or higher pressures.
7. Motion delay and valve opening/closing speed affect the quality of the beginning or end of the
printed line. A large value for motion delay or a high valve opening speed should cause excessive
material deposition at the start of a line.
8. High pressure and low standoff distance will cause excessive material to flow laterally out of the
9. Table 1. Excessive material will stick to the nozzle and will distort the printed line and will drag
material in the direction of the feed causing non-uniform printing.
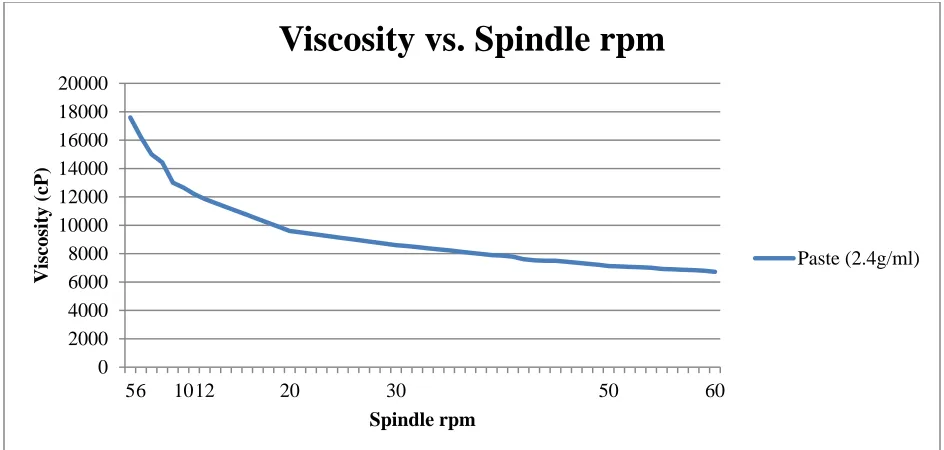
3.1.1 Paste Properties
Paste rheology strongly influences its behavior within the system and post extrusion as well as
dimensional properties following extrusion. To understand some of the properties of the pastes used in the
experiments, a Brookfield DE-V viscometer was used to measure the viscosity of the ink vehicle at
different shear rates produced when spindle speed is varied. Figure 12 displays the viscosity profile of ink
vehicle. A minor shear thinning behavior was observed in the ink vehicle which is beneficial in an
extrusion process. To check its behavior when the ink vehicle is loaded with solid particles, a paste of
NiO-YSZ and ink vehicle with a solid loading fraction of 2.4 g/ml was mixed in the Thinky mixer. The
same test was repeated. The viscosity profile of the paste is given in Figure 13. It was observed that a
[image:32.612.90.522.374.598.2]significant shear thinning occurred in the paste.
Figure 12: Ink vehicle viscosity vs. spindle rpm
710 715 720 725 730 735 740 745 750 755
1 3 4 5 6 10 12 20 30
Viscosity
(cP)
Spindle rpm
Viscosity vs. Spindle rpm
Figure 13: Viscosity vs. shear rate of paste with 24g/ml solid loading
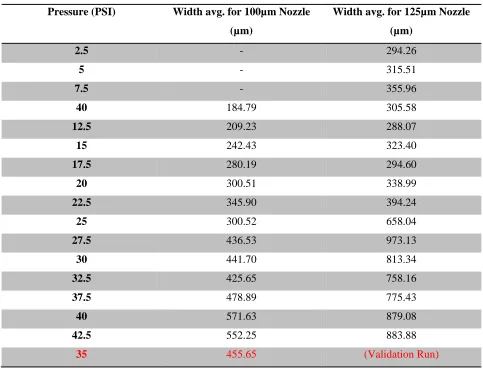
3.1.2 Feasibility Test
For the feasibility test, a simple experiment was conducted by varying only two parameters – nozzle size
and pressure. The remaining six input parameters, namely valve position, valve opening speed, feed rate,
motion delay, standoff distance and solid loading fraction (viscosity) were kept constant. The response
measured in the experiment was the width of the printed line. This was measured using the Hirox digital
microscope. The constant parameter settings were:
1. Valve position– 1.8 mm
2. Valve opening speed – 10 mm/sec
3. Feed rate – 5 mm/sec
4. Motion delay (Wait) – 0.1 sec
5. Standoff – 50 µm
6. Solid loading fraction – 5.75 g/ml
Two nozzle sizes were used – 100 µm and 125 µm, and air pressure was varied from 0-42.5 PSI in steps
of 2.5 PSI. Three lines were printed for each parameter combination in the experiment, and one width
measurement was conducted for each line. The average width response was then calculated and
considered as a single replicate for the experiment. Eureqa (http://creativemachines.cornell.edu/eureqa), a
0 2000 4000 6000 8000 10000 12000 14000 16000 18000 20000
56 1012 20 30 50 60
Viscosity
(cP)
Spindle rpm
Viscosity vs. Spindle rpm
software tool developed at Cornell University for detecting mathematical relationships in data, was used
[image:34.612.65.548.174.544.2]to generate a regression equation to fit the data using mean square error as the error metric.
Table 2: Preliminary experiment data
Pressure (PSI) Width avg. for 100µm Nozzle (µm)
Width avg. for 125µm Nozzle (µm)
2.5 - 294.26
5 - 315.51
7.5 - 355.96
40 184.79 305.58
12.5 209.23 288.07
15 242.43 323.40
17.5 280.19 294.60
20 300.51 338.99
22.5 345.90 394.24
25 300.52 658.04
27.5 436.53 973.13
30 441.70 813.34
32.5 425.65 758.16
37.5 478.89 775.43
40 571.63 879.08
42.5 552.25 883.88
Figure 14: Width vs. pressure
Data from the experiment is tabulated in Table 2. Figure 14 shows a plot of the data obtained from the
experiment. Using Eureqa, the width (y) of a printed line was defined as a function of the nozzle size (n)
and air pressure (x).
( ) ( ) ( )
3.1.3 Validation
To verify the model generated using Eureqa, we use the function to predict the width for parameter setting
within the experimental space that were not included in the model. A line was printed at this setting, and
its actual width was compared with the predicted width. For this case, process settings considered were –
a 100 µm nozzle diameter and 35 PSI air pressure. Predicted width was calculated as 465.295 µm using
equation (1) in Eureqa. Figure 15 shows the prediction window from Eureqa.
0.00 100.00 200.00 300.00 400.00 500.00 600.00 700.00 800.00 900.00 1000.00
0 10 20 30 40 50
Width av
g
(µm)
Pressure (PSI) ->
100µm Nozzle
Figure 15: Prediction value using Eureqa
The printed width for these settings was found to be 455.65 µm. In comparison to the predicted value of
465.295 µm, a 2% error was observed. It was concluded that more data than the single replicate used here
would help to build a more accurate model and reduce the error further. Also, outliers such as the one
observed in Figure 14 with the 125µm nozzle at 27.5PSI air pressure can be analyzed with more data and
eliminated if anomalous.
Feasibility Test Discussion
A regression model was successfully fitted to the experimental data, and the observed effects of varying
air pressure and nozzle size were consistent with the initial hypothesis. An increase in air pressure leads to
increased material flow and increased line width. It was also observed that an increase in nozzle diameter
resulted in increased width.
It was observed in the experimental data in Table 2 that with the smaller nozzle diameter at lower
pressures, no material was extruded thus giving null data points, viz. process settings where material was
not extruded. To avoid such data points in future experiments, it was decided that a lower solid loading
3.2 Screening Experiment
The first step was a screening experiment carried out to determine the factors that have a significant effect
on the response variable. This was done in order to conserve resources and to weed out insignificant
factors so that further analysis could be carried out only on the significant factors. For this screening
experiment, all eight controllable parameters in the nScrypt micro-extrusion process were taken into
consideration. Minitab was used to investigate possible design options for a two level eight factor
experiment. Both 28-3 and 28-4 designs have a resolution of IV, which means all the main effects are only
confounded with three-way interactions effects or higher. To use the least amount of resources without
sacrificing the amount of information gathered from the experiments, a two level fractional factorial 28-4
experiment was selected. Randomization of runs would cause the pressure value to shift between its high
and low levels repeatedly throughout the experiment. It has been observed that repeated cycling between
low and high air pressure settings causes the formation of air pockets inside the syringe and valve body.
This in turn causes non-uniform and interrupted printing. In order to incorporate randomization into the
experiment, the entire system would have to be flushed and cleaned after each run, which would take an
inordinate amount of time and would require excessive use of cleaning supplies leading to waste of
experimental paste materials. Also, two distinct pastes were to be printed, which meant a changeover
would also require a system clean up. In the interest of time and resources, the experiment was therefore
not randomized. A four replicate experiment was designed to account for some of the random variability
[image:37.612.139.476.507.721.2]in the response variable and these replicates were printed in a single setup without changeovers.
Table 3: Factor levels for screening design
Factor Low
(-1)
High (+1)
1. Feed (F) 5 mm/sec 10 mm/sec
2. Pressure (P) 10 PSI 20 PSI
3. Nozzle (N) 100 µm 125 µm
4. Solid loading fraction (V) 2.4 g/ml 4.8 g/ml
5. Standoff (S) 50 µm 100 µm
6. Valve position (VP) 1.7 mm 2.5 mm
7. Valve opening speed (VOS) 5 mm/sec 10 mm/sec
Discussion
Factor levels used in the screening experiment are shown in Table 3. Factor levels for the screening
experiment were determined as follows
1. Solid loading fraction – based on the preliminary experiment and to avoid parameter settings
where no line is printed, lower solid loading fractions were used
2. Feed rate – based on the preliminary experiment and the fact that lower viscosities were used a
higher range of feed rates was selected for the screening experiment
3. Pressure – air pressure levels were selected based on the levels used in the preliminary
experiment
4. Nozzle size – nozzle size was selected based on their availability
5. Standoff – the range was based on the preliminary experiment and on the level and range of
standoff distances used in the work done by Li et al. [15]
6. Valve opening – was based on the level used in the preliminary experiment and the allowable
limits of valve positions given in the system’s user manual
7. Valve opening speed – was based on the preliminary experiment level and the maximum allowable speed as given in the system’s user manual
8. Wait time – was based on the preliminary experiment
The design table and data from the screening experiments are tabulated in Appendix B.1. The height and
3.2.1 Analysis of Height Data
Minitab was used to analyze the factorial data. The half normal plot for height is shown in Figure 16.
14 12 10 8 6 4 2 0 98 95 90 85 80 70 60 50 40 30 20 10 0
Absolute Standardized Effect
P e rc e n t A F B P C N D V E S F V P G V O S H W F actor Name
Not Significant Significant Effect Type AH AG AF AB H E D C B A
Half Normal Plot of the Standardized Effects
[image:39.612.91.523.150.445.2](response is height, Alpha = 0.05)
Figure 16: Half normal plot for screening height analysis
From the half normal plot in Figure 16, it was established that factors D (V/solid loading fraction), B
(P/pressure) and E (S/standoff) were the most significant. While other factors and interaction terms are
shown as significant in the half normal plot, it should be noted that because four replicates of the
experiment were executed, the error term is based on those replicates. Since the runs were not
randomized, this likely resulted in an artificial low level of experimental error. Using these factors a
regression analysis was carried out in Minitab and a regression equation was generated. The residual plots
from the regression analysis are shown in Figure 17. A visual inspection of the normal probability plot
and histogram revealed normality of residuals. This was verified using a test for normality in Minitab.
Figure 18 shows a normal probability plot of the residuals with a goodness of fit test. The p-value
obtained was 0.326, hence it was concluded that the residuals were normally distributed. The ‘Versus
non-constant variance. The ‘Versus Order’ plot did not exhibit any patterns. Hence we accepted the
model and proceeded to test the validity of the regression equation.
( ) 50 25 0 -25 -50 99.9 99 90 50 10 1 0.1 Residual P er ce nt 100 80 60 40 30 15 0 -15 -30 Fitted Value R es id ua l 24 12 0 -12 -24 16 12 8 4 0 Residual Fr eq ue nc y 60 55 50 45 40 35 30 25 20 15 10 5 1 30 15 0 -15 -30 Observation Order R es id ua l
Normal Probability Plot Versus Fits
Histogram Versus Order
[image:40.612.123.492.152.396.2]Residual Plots for height
Figure 17: Residual plots of regression analysis of height from screening experiment
50 25 0 -25 -50 99.9 99 95 80 50 20 5 1 0.1 RESI1 P e rc e n t
Goodness of F it Test Normal A D = 0.415 P-V alue = 0.326
Probability Plot for RESI1
Normal - 95% CI
[image:40.612.137.477.439.666.2]3.2.2 Analysis of Width Data
A factorial analysis was carried out on width data using Minitab.
60 50 40 30 20 10 0 98 95 90 85 80 70 60 50 40 30 20 10 0
Absolute Standardized Effect
P e rc e n t A F B P C N D V E S
F V P
G V O S
H W
F actor Name
Not Significant Significant Effect Type DE BE AE AD AC AB HF E D B A
Half Normal Plot of the Standardized Effects
[image:41.612.127.487.146.391.2](response is width, Alpha = 0.05)
Figure 19: Half normal plot for screening width analysis
From the half normal plot in Figure 19, factors D (V/solid loading fraction), E (S/standoff), B
(P/pressure), A (F/feed) and interaction BE (P/pressure*S/standoff) were deemed the most significant. As
noted above, an artificially low level of experimental error is suspected. Using these factors, a regression
analysis was carried out in Minitab and a regression equation was generated. The residual plots from the
regression analysis are shown in Figure 20. A preliminary visual inspection of the normal probability and
histogram plots and a test for normality in Minitab were conducted to verify normality of the residuals.
Figure 21 shows a normal probability plot of the residuals with a goodness of fit test. The p-value was
obse
![Figure 3: (a) Laser activated electroplating; (b) Laser induced forward transfer (LIFT) [9]](https://thumb-us.123doks.com/thumbv2/123dok_us/109590.10168/15.612.74.536.179.443/figure-laser-activated-electroplating-laser-induced-forward-transfer.webp)
![Figure 4: A laser based DW system used in both additive (right) and subtractive (left) modes [12]](https://thumb-us.123doks.com/thumbv2/123dok_us/109590.10168/16.612.167.449.72.339/figure-laser-based-used-additive-right-subtractive-modes.webp)
![Figure 5: Material deposition using DPN [11]](https://thumb-us.123doks.com/thumbv2/123dok_us/109590.10168/17.612.152.464.504.691/figure-material-deposition-using-dpn.webp)
![Figure 6: Material deposition using NFP [9]](https://thumb-us.123doks.com/thumbv2/123dok_us/109590.10168/18.612.188.429.73.222/figure-material-deposition-using-nfp.webp)
![Figure 9: Flowrate vs. dispensing height [15]](https://thumb-us.123doks.com/thumbv2/123dok_us/109590.10168/22.612.125.491.70.292/figure-flowrate-vs-dispensing-height.webp)