This content has been downloaded from IOPscience. Please scroll down to see the full text.
Download details:
IP Address: 129.11.22.19
This content was downloaded on 20/01/2016 at 11:24
Please note that terms and conditions apply.
Refining soil organic carbon stock estimates for China’s palustrine wetlands
View the table of contents for this issue, or go to the journal homepage for more 2015 Environ. Res. Lett. 10 124016
Environ. Res. Lett.10(2015)124016 doi:10.1088/1748-9326/10/12/124016
LETTER
Re
fi
ning soil organic carbon stock estimates for China
’
s palustrine
wetlands
Kun Ma1
, Junguo Liu1
, Ying Zhang1
, Lauren E Parry2
, Joseph Holden2
and Philippe Ciais3
1 School of Nature Conservation, Beijing Forestry University, Qinghua East Road 35, Haidian District, 100083, Beijing, People’s Republic
of China
2 water@leeds, School of Geography, University of Leeds, Leeds, LS2 9JT, UK
3 Laboratoire des Sciences du Climat et de 1’Environment, CEA-CNRS-UVSQ, F-91191, Gif sur Yvette, France
E-mail:junguo.liu@gmail.com
Keywords:ecosystem services, climate change, China, peatland, swamp, marsh Supplementary material for this article is availableonline
Abstract
Palustrine wetlands
(
PWs
)
include all bogs, fens, swamps and marshes that are non-saline and which
are not lakes or rivers. They therefore form a highly important group of wetlands which hold large
carbon stocks. If these wetlands are not protected properly they could become a net carbon source in
the future. Compilation of spatially explicit wetland databases, national inventory data and
in situ
measurement of soil organic carbon
(
SOC
)
could be useful to better quantify SOC and formulate
long-term strategies for mitigating global climate change. In this study, a synergistic mapping
approach was used to create a hybrid map for PWs for China and to estimate their SOC content. Total
SOC storage in PWs was estimated to be 4.3
±
1.4 Pg C, with a SOC density of 31.17
(
±
10.55
)
kg C
m
−2in the upper 1 m of the soil layer. This carbon stock is concentrated in Northeast China
(
49%
)
and the Qinghai
–
Tibet Plateau
(
41%
)
. Given the large pool of carbon stored in PWs compared to
other soil types, we suggest that urgent monitoring programmes on SOC should be established in
regions with very few datasets, but where PWs appear to be common such as the Tibet region and
Northwest China.
1. Introduction
Palustrine wetlands (PWs) cover the majority of wetland types in the world(Lehner and Döll2004). PWs refer to non-tidal marshes, swamps, bogs, and fens (Ramsar Convention Secretariat 2013). Only lakes, rivers and saline wetlands are not included as wetland types within the PW classification. PWs are important in the global carbon(C)cycle because of their large soil carbon pools held under largely anaerobic conditions, their high methane emissions, and their potential for considerable future carbon sequestration (Page et al 2011, Vicari et al 2011, Carlsonet al2012, Kleinenet al2012, Sapartet al2012, Charman et al 2013). Undisturbed PWs are usually observed to be small sinks of C annually, but large sinks over many years (Gorham 1991, Thormann et al1999, Bellamyet al2005, Huanget al2010, Vicari et al2011, van der Valk2013, Maltchiket al2014).
However, if there is warming-induced acceleration of organic matter decomposition then net C release could occur. Alternatively, if climate change enhances plant productivity over decomposition then there may be an enhanced net C uptake. There is large uncertainty as to how different types of PWs will respond in different regions to climate change but it is clear that as a starting point there is an urgent need to map and quantify the existing extent of PWs and their C stock so that better estimates of potential feedbacks to climate change may be developed.
Human activities such as drainage and prescribed burning threaten PWs and may enhance C release. Protection of PWs has been considered as an impor-tant component of climate change mitigation( Hol-den 2005, Davidson and Janssens 2006, Song et al2006, Smithet al2007, Vicariet al2011), but with-out good maps or reliable soil organic carbon(SOC) stock estimates, organizing such protection by
OPEN ACCESS
RECEIVED 16 July 2015
REVISED 11 November 2015
ACCEPTED FOR PUBLICATION 1 December 2015
PUBLISHED 15 December 2015
Content from this work may be used under the terms of theCreative Commons Attribution 3.0 licence.
Any further distribution of this work must maintain attribution to the author(s)and the title of the work, journal citation and DOI.
national and international agencies becomes more
dif-ficult (Post et al 1982, Sigua et al 2009, Charman et al2013, Lu and Xu2014).
In China there are a number of soil maps and data-bases on SOC. However, the maps vary in spatial reso-lution and detailed estimates of SOC storage for PWs in China are only available for some wetland-rich regions(Tianet al2003, Penget al2005a,2005b, Kang et al2009, Li2009, Baiet al2010). The lack of spatially explicit wetland area databases combined with a lack of representativein situdata on SOC is a major con-straint for accurate estimation of SOC storage in Chi-na’s wetlands. Thus previous estimates of wetland SOC storage in China are highly uncertain (Wang et al 2003,2014, Mitraet al 2005, Wang 2009, Liu et al2012, Zhenget al2013). Many of the earlier SOC studies have predominantly focused on the Northeast of China(NEC), Zoige plateau and the middle and lower reaches of the Yangtze River, and do not provide a representative estimate of country-wide SOC stocks. In addition, the method of quantification of SOC stock for each region differs between studies, resulting in difficulties with comparisons between regions.
High-resolution remote sensing (RS) data, geo-graphical information systems(GIS)and global posi-tioning systems have made the mapping of PWs feasible. Maps of national and global PWs are now becoming available (Lehner and Döll 2004, Niu et al2009, BFU2011, Chen and Jessel2011)but con-siderable discrepancies remain between these datasets, due to both different wetland classification systems and the methods used for mapping wetlands(table S1). Comparisons of these spatially explicit wetland area datasets with the Chinese first wetland census
(National Bureau of Statistics of China2007), showed large disagreements between the maps and national and provincial wetland census data. For example, the
first Chinese wetland census suggested the total PW area was 137 002 km2around the year 2000, while Niu et al (2009) reported the total PW area to be only 90 885 km2in 2000. Based on thefirst Chinese wetland census database, PWs accounted for 35.6% of the total wetland area in China(National Bureau of Statistics of China2007). However, there is no map focused on the spatial distribution of PWs in China. The SOC stock in the PWs of China is also not clear. In this study, we establish thefirst standardised map of PWs for China, evaluated against ground-based data. In a second step, we combined this dataset within situSOC measure-ments to provide a spatially explicit estimate of the SOC storage distribution across Chinese PWs.
2. Materials and methods
2.1. Materials
We adopt the classification of wetlands used by the Ramsar Convention on Wetlands. The treaty was adopted in 1971 with 168 contracting parties and the
Chinese government is one contracting party of the Ramsar Convention and the classification of wetland in China is officially based on that from the Ramsar Convention (State Forestry Administration, P. C. R2004, Ramsar Convention Secretariat2013). In the national wetland census in China, PWs were investi-gated and their areas were reported to the public for each province in mainland China (State Forestry Administration, P. C. R2004). PWs include eight types in the census: moss bog, herbaceous marsh, swamp meadow, shrub marsh, forest swamp, inland marsh, geothermal wetland and freshwater spring or oasis wetland.
The landmass of China is large, with a very wide range of topographical conditions. As a result, a wide range of climatic regimes exists, which in turn may cause spatial variability in the amount and character-istics of PW across the nation. We carried out SOC mapping and quantification in each of China’s eight eco-regions(Chen and Jessel2011): NEC, Northwest of China(NWC), Qinghai–Tibet Plateau(QTP), Mid-dle temperate humid zone(MTH), North subtropical humid zone(NSH), Middle subtropical humid zone
(MSH), South subtropical humid zone (SSH), and Tropical humid zone(TH).
Six existing datasets which map wetlands in China were used to develop a standardised hybrid PWs map
(see table S1). Each of these datasets provides the dis-tribution and area for different kinds of PWs. These include: the wetland database of the Chinese Academy of Science (Wetland-CAS) which provides the dis-tribution and area of swamp, inland marsh and coastal marshes; the wetland database of Beijing Forestry Uni-versity(Wetland-BFU)which provides the distribu-tion and area of marsh, swamp, bog, fen, mire, and forest wetland; the wetland database of Chinese Land Use(Wetland-LU)which provides land use and cover information for China including the distribution and area of marsh and peatland; the Global Lake and Wet-lands database (GLWD-3) which provides the dis-tribution and area of marsh, swamp, bog, fen, mire, and forest or flooded forest, marshland soil data extracted from 1:4million China soil data (www. geodata.cn); and the Chinese wetland census dataset, which reports PW area by province. The formalfive datasets provided spatially explicit wetland distribu-tion, while the census reported wetland areas by pro-vince. To further refine the hybrid PWs map, we used historical temperature and precipitation datasets available from the Chinese Academy of Agricultural Science’s weather station network (http://geodata. cn.)as auxiliary data(see section2.2). We also used a 1 km resolution Digital Elevation Model (DEM)
(available from http://westdc.westgis.ac.cn) as aux-iliary data(see section2.2).
compiled from data within peer reviewed literature and postgraduate theses. A database consisting of 4996 samples across 297 sites from 73 individual literature sources was created(table S2). In order for these data to be comparable with other global and national SOC stock estimates(Sjörs1980, Mitraet al2005)and Chi-nese wetland or peatland SOC stocks(Wanget al2003, Zhenget al2013), we gathered data from the upper 1 m of the soil profile, divided into two layers, topsoil
(0–30 cm)and subsoil(30–100 cm). For the TH zone, we used data from the Harmonized World Soil Data-base (HWSD) because no other suitable data were available in the literature. The HWSD is a global soil database compiled from a number of different data sources (Nachtergaele et al 2008). In China, the 1:1million soil map, based on the second national soil census, is used in HWSD. This was provided by the Institute of Soil Science, Chinese Academy of Science
(http://westdc.westgis.ac.cn). The HWSD gives the distribution of internationally recognized soil associa-tions, which are defined by their SOC content (%), volume of stones(%), and bulk density(kg dm−3)by standard layers(0–30 cm and 30–100 cm).
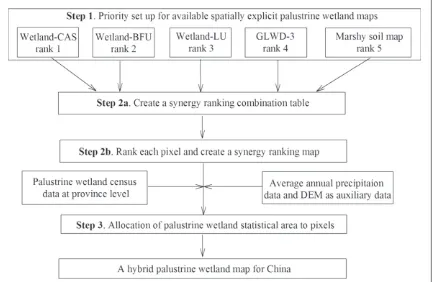
2.2. Synergy mapping of PWs
A synergistic approach, which gives each mapping pixel a score based on the agreement among different wetland databases, was used to combine census and spatially explicit datasets. In this study, we collected four spatially explicit wetland distribution datasets, plus one marshland soil dataset and one national wetland census dataset. The spatial resolution of these
five datasets was different as summarised in table S1. Wetland-CAS is 1 km, Wetland-LU is 2 km(but was created based on 1 km land use data), and GLWD-3 is 30 arc seconds (equivalent to approximately 1 km). Wetland-BFU and Marshland soil map are not in raster data format. Hence, we standardized all datasets into the raster data format with the same spatial resolution of 1 km. We performed three processing steps to combine each dataset and create a single inventory of PW spatial extent in China, following the procedures from Maet al(2012) (figure1). These three
processing steps are described below in
sections2.2.1–2.2.3.
2.2.1. Ranking available datasets
[image:4.595.121.553.64.346.2]First, the datasets were ranked based on their data quality. As a general rule, a dataset was given a higher rank if it was created specifically for mapping PWs in China. The Wetland-CAS map, 1 km resolution, was created using RS data (Landsat ETM+) and was specifically calibrated to China’s PWs and as a result was given the highest rank. The Wetland-BFU map was created based on directly surveyed Chinese wet-land data, but this dataset was originally not in a raster format. Hence it was not given a rank as high as the Wetland-CAS, but a second rank. The Wetland-LU dataset, 2 km resolution, was specifically developed for land-use mapping (not wetland mapping) and it contains a specific land type of PWs. Therefore, it was classed as the third rank. The GLWD-3, 30 s resolu-tion, is a global map of wetlands including PWs. It was produced based on various data sources and is not Figure 1.Schematic diagram showing the process for the creation of the hybrid palustrine wetland map.
specific to China. It is difficult to confirm the consistence and reliability of this dataset, and as a result we assigned it as the fourth rank. The marshland soil map was given the lowest rank, as it was extracted from the 1:4 million China soil map and was developed to specifically consider only marshland soils.
2.2.2. Ranking pixels
The second step in the synergy mapping process was to create a priority table and to rank each 1 km pixel. Sincefive different PW datasets were used in order of rank of confidence, there are 31 different possible combinations of confidence from 1 to 31(table S3). When allfive maps indicated a pixel as a PW, then we gave it the highest rank of 1. If four maps showed a pixel as a PW(four yes[Y]combinations), then we created the rank based on the priority orders of these four maps. For example, when the marshland soil map
(the map with lowest priority) is the only map indicating no PW present on that pixel we gave the highest rank for the 4Y combination(or 2, table S3). However, when Wetland-CAS (the map with the highest priority)was the only map not indicating a PW for a pixel then we assigned that situation the lowest rank for a 4Y combination(a score of 6, table S3). A similar approach was applied for 3Y, 2Y and 1Y combinations. Rank 1 implies that a pixel is associated with the highest confidence that a PW exists on the pixel, while rank 31 means the pixel is associated with the lowest confidence of a PW existing on that pixel. The synergy map was then created after implementing the ranking(figure S1).
2.2.3. Allocating the PW area to pixels
The third step in the mapping process was to allocate the statistics of PW area for each province reported in the Chinese wetland census database to pixels. We here considered the census data for each province to be the most accurate source of PW area because this wetland inventory was produced with greatest rigour (State Forestry Administration, P. C. R2004). While a more recent survey has been completed (2009–2013), the results of wetland area in each province are not accessible. Hence, in our study, we selected thefirst national survey of wetlands as our benchmark. Thus, the results of SOC presented in this paper represent the situation for the years around 2000.
To create a raster map, the census of the PW area for each province was allocated into different pixels of the synergy map. There were two situations in the allo-cation process. Thefirst case was when the total area of pixels with a rank from 1 to 31 was higher than the total census PW area. In this case, PW areas werefirst allocated to the pixels with a higher rank. We then added the area of pixels in a province with a rank of 1. If this area was smaller than the total PW area in this province, we assume all these pixels with rank 1 are PWs. Then we added the area of pixels in this province
with rank of 1 and 2. This process was repeated until the total area of pixels with a rank of 1 toi(whereiwill be an integer from 1 to 31)was larger than the census PW area. At this point a decision was required as to how to allocate PWs in pixels with the rank ofi. Since all of these pixels have the same rank, we used the 1960–2000 average annual precipitation data and DEM data as a secondary criterion to reorder these pixels, and assumed the pixels with higher precipita-tion and lower relative elevaprecipita-tion have a higher prob-ability of PWs. For example, suppose the census area of PWs for a province is 100 km2, the sum of areas with rank from 1 to 3 is 90 km2, and the sum of areas with rank from 1 to 4 is 110 km2. In this case, we need to reorder the pixels that are rank 4 with precipitation and DEM information and allocate the remaining 10 km2of PWs according to the criterion of precipita-tion and DEM. The second allocaprecipita-tion situaprecipita-tion was when the total area of pixels with a rank from 1 to 31 in a province was lower than the province’s census PWs area. In this case, we assumed all these pixels with ranks 1–31 are PW, and other pixels were excluded.
2.3. Calculation of SOC stock using literature data Using the geographical coordinates of directly mea-sured soil parameters from our soil physical properties database(table S2), the Thiessen polygon method was applied within each eco-region using ArcGIS to divide each eco-region into several subareas where geogra-phically relevant soil physical property values could be applied in SOC stock calculations(figure3). For each subarea, SOC stock was calculated as follows:
A H R
SSOCji =SOCCji´BDji ´ ji ´ ´ , ( )1
where, SSOCjiis the SOC stock of subareajin
eco-regioni(kg C), SOCCjiis the SOC content of subareaj
in eco-regioni(% weight or g kg−1), BDjiis the bulk
density(g cm−3),Ajiis the total PW area of subareajin
eco-region i (m2), His the depth (m) of soil layer. Because the units of the measured soil parameters(i.e. SOC content, bulk density)were not consistent, we used the transfer coefficientRto standardize the SOC stock into the same unit(i.e. kg C). The volume of stones was omitted due to lack of data. In this study, we calculated the SOC stock of 1 m depth of soil in the area of PWs. The SOC density was calculated by SOC content multiplied by the bulk density. However, in 41% of the PW area, we could only obtain in situ experimental data from the literature for soil layers shallower than 1 m. For these areas, we assumed the soil had the same SOC density values from the deepest point for which experimental data were available down to 1 m depth. A total of 28% of PW area lacked bulk density data. These areas were gap-filled using the mean carbon density and standard error for the given eco-region. Then, the SSOCji was calculated for the
topsoil(0–30 cm)and subsoil(30–100 cm).
SSOCi SSOC , 2 j n ji 1
å
= = ( )SSOCt SSOC , 3
i i i 1
å
= = ( )where, SSOCiis the total SOC stock of PWs in
eco-regioni(kg C),nis the number of subareas in eco-regioni,iis the code of the eco-regions while SSOCt:
the total SOC stock of PWs in China(kg C).
Based on the total SOC stock and PW area, we cal-culated the mean SOC density for each eco-region and the whole country as below
A
SOCD i SSOCi, 4
i
mean, = ( )
A
SOCD SSOCt, 5
t
mean = ( )
where, SOCDmean,i is the mean SOC density (kg C
m−2)of eco-regioni,Aiis the total PW area(m
2)
of eco-regioni, SOCmeanis the mean SOC density(kg C
m−2)of China’s PWs andAtis total PW area(m2)of
China.
3. Results
3.1. Distribution of PWs
A new hybrid PW map for China(Hybrid Palustrine Wetland Map of China, HPWMC)is shown infigure2. The total PW area of China is 136 963 km2, 1% of the total national land surface area (National Bureau of Statistics of China 2007). The final results from the hybrid map are close to the areas for PW from the census provided for each province with a range of relative error of −0.8%–1.0%, except for Guizhou, Guangdong and Zhejiang provinces (table S4). The Heilongjiang province has the highest PW area, with 24% of China’s total PW area. The highest PW fractional coverage is also found in Heilongjiang, Inner Mongolia, Qinghai and Tibet. These four provinces altogether have 85% of China’s total PW area. At eco-region scale, most PWs are distributed in the NEC, QTP, and NWC. These three ecological regions possess 97% of the PWs in China.
3.2. PW SOC stock
Our study indicates that the total SOC stock in the upper 1 m of China’s PWs is 4.3±1.4 Pg C with an average SOC density of 31.2±10.1 kg C m−2. The NEC has the highest SOC storage with 2.1±0.6 Pg C, and this area accounts for 49% of the total national SOC storage in PWs. The second largest store of SOC is found in the QTP with 41%(1.8±0.8 Pg C)of the total national SOC storage in PWs. Even though Northwest China contains 22% of the total PW area of China, its SOC storage is low due to a lower SOC density with a value of 0.4±0.1 Pg C, only 8% of the total national PW SOC pool. The SOC pools of other eco-regions are much lower than for the three
dominant PW eco-regions (figures 3(A) and (B1), table1).
The total SOC stock stored in China’s PW topsoil
(0–30 cm) (figure 3(B2), table1)was 1.6±0.6 Pg C with an average SOC density of 11.9±4 kg C m−2. The NEC contains approximately 0.8±0.3 Pg C and 51% of the national PW total SOC topsoil stock. The NEC has the highest topsoil SOC stock, due to both a large spatial coverage of PWs and a high carbon den-sity. The second highest topsoil SOC stock can be found in the QTP which contains 0.6±0.2 Pg C or 39% of the national PWs total SOC stock. The SSH zone contains the lowest topsoil SOC due to the lower carbon density and scarce PW distribution.
For the subsoil(30–100 cm), the average SOC den-sity was 19.3±6.6 kg C m−2, and the total SOC stock was 2.6±0.9 Pg C. The NEC contains approximately 1.3±0.2 Pg C or 48% of the national total subsoil SOC stock for all PWs (figure 3(B3), table 1). QTP contains the second highest subsoil SOC stock with a value of 1.1±0.6 Pg C, or 42% of the national total subsoil SOC stock for all PWs. The SSH zone has the lowest PW subsoil SOC stock among all of the eco-regions of China.
4. Discussion
4.1. Comparison between hybrid PW map and other data-sets
Our approach helps reduce uncertainties in mapping PWs but it is clear that there are still some locations where uncertainties are great. The available datasets were given different priorities based on their authority, geographical focus, and spatial resolution. Allocation of PW area based on the rank of each pixel was estimated by considering the agreements between, and ranking of, existing datasets.
The area of the HPWMC shows some consistency with the national PW census(figure2(B)). At a pro-vincial scale, the PW area of HPWMC also has a good consistency with the provincial PW census
(figure2(A)). However, in some areas there are incon-sistencies particularly in terms of reporting presence or absence of PWs. Our results suggest that the posi-tion of existing mapped PWs do not correspond between the four datasets. For Guangxi, Jiangsu and Anhui, the original four maps all indicated that some PWs exist there. However, the hybrid map suggests that no PW is present. This is because thefirst wetland census reported no PWs in these provinces. Therefore, in order to provide better estimates of PW distribu-tion, surveys with improved spatial accuracy are nee-ded in these regions. The HPWMC provides a reference of PW distribution and quantification in China, but also indicates that better directly surveyed datasets are required.
[image:6.595.178.265.55.119.2]4.2. Comparisons of SOC density
In this study, the mean SOC density of PWs calculated with data from the literature is 31.2±10.6 kg C m−2 in the upper 1 m. And the value we calculated for China is more than three times the national average SOC density(Yuet al2007). The mean SOC density for PWs in China is lower than that Northern peat-lands such as the peatpeat-lands in Russian(81.2 kg C m−2, Stoblovoi2002). Tarmocaiet al(2009)reported that the average SOC density to a depth of 1 m for peatlands in the Northern permafrost region was 66.6 kg C m−2 for Histels and 69.6 kg C m−2for Histosols. The lower
mean SOC density of PWs was driven by PWs in some eco-regions which have a lower C content, such as those of inland marshs in NWC. Xu et al (2010)
reported the SOC density ranged from 0.08 to 1.77 kg C m−2in the PWs around Ebinur Lake.
On a national scale, based on the Chinese wetland RS map and the 1:1million soil map, Zhenget al(2013)
reported the SOC density of wetland soils in China to vary from 2.4 to 101 kg C m−2while Yuet al(2007)
[image:7.595.121.554.57.564.2]Chinese peatlands was 143.8 kg C m−2. There is clearly considerable variability in SOC density between wet-land types. Comparisons with non-wetwet-land ecosys-tems suggest, as expected, that the SOC density of PWs is greater. Based on the Chinese national soil census database, Yuet al(2007)suggested that the SOC den-sity of forestland was 14.3 kg C m−2, with shrub
(11.5 kg C m−2), grassland(8.2 kg C m−2), farmland
(9.2 kg C m−2), desert(2.9 kg C m−2)and urban areas
(8.17 kg C m−2)all having lower SOC density.
SOC densities in China’s PWs are highly variable between the eight eco-regions. The highest SOC den-sities were found in the QTP, NEC and the NSH zone.
[image:8.595.122.553.61.572.2]The SOC density is dependent on plant productivity and the mineralization intensity of organic matter, which are both strongly controlled by hydrology, cli-mate conditions and soil texture(Duchaufour1982, Paul 1984, National Soil Survey Office 1998, Wu et al2003). The NWC has 22% of the total PW area, but SOC density is much lower than the national mean wetland SOC density. In the NWC, the climate is arid due to the moisture barrier effect of the QTP and the long distance from the ocean. The arid climate pat-terns and coarse soil textures(Wuet al2003)result in lower SOC density and carbon storage in this eco-region.
Figure 3.Palustrine wetland SOC stock in eco-region and national scale for each soil layer.(A)is the spatial distribution of total SOC storage in the upper 1 m,(B1)is the total SOC storage in the upper 1 m(0–100 cm),(B2)is the total SOC storage in the topsoil (0–30 cm), and(B3)is the total SOC storage in subsoil(30–100 cm).
4.3. SOC stock at different spatial scales
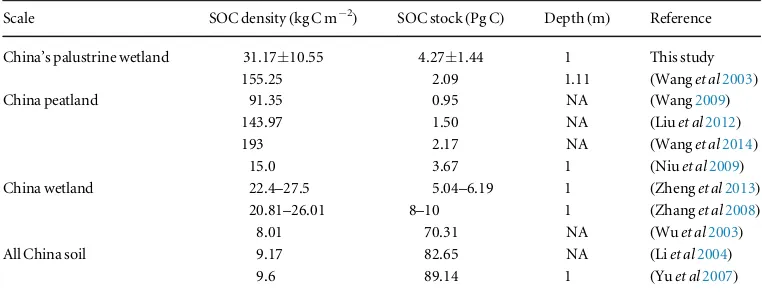
Estimates of national and global terrestrial SOC stock vary greatly(Mitraet al2005). For example, the SOC stock in China’s wetlands has previously been esti-mated to be somewhere between 3.7 and 12.2 Pg C(Yu et al2007, Zhanget al 2008, Niu et al2009, Zheng et al2013). Our study indicates that the SOC stock in China’s PWs is 4.3±1.4 Pg C. This is thefirst such estimate for PWs alone. For Chinese peatlands (a subset of PWs), the total SOC stock has previously been estimated to range from 1 to 2.2 Pg C(Wang et al2003,2014, Wang2009, Liuet al2012). The SOC stock of PWs calculated with data from literature in the upper 1 m of the soil layer was found to be 2–4 times larger than the SOC stock previously reported for‘peatlands’(note that bog and fen peatlands belong to the PW class), and 1–3 times smaller than SOC stock previously reported for wetlands as whole(table 2). This comparison implies that SOC storage in PWs is large not only in China’s peatlands, but also in other types of PWs. There is therefore a need to conduct further in-depth analysis of SOC storage in these ecosystems.
At a national scale, Yuet al(2007)reported that China’s soil contains 89 Pg C in the top 1 m with an average SOC density of 9.6 kg C m−2based on the sec-ond national soil survey. Other estimates showed that the total SOC stock in China’s soil are 92 Pg C(Wang
et al2001), 70 Pg C(Wuet al2003), and 83 Pg C(Li et al2004). In the meeting of the 236th Xiangshan, Chinese soil experts accepted 90 Pg as the total SOC stock in China’s soil (Zhang et al2008). Our result shows that 5% of China’s total SOC is held in PWs even though these ecosystems only occupy 1% of the total national land surface area. The SOC density of PWs is three times larger than the national average soil carbon density. In addition, the C sequestration rate of other ecosystems(such as forest, shrub, grassland and cropland)is 0.075±0.025 Pg C yr−1(Piaoet al2009). Hence these other ecosystems combined may take more than 50 years to capture the same amount of car-bon currently stored by the PWs in China.
At a global scale, Lehner and Döll(2004)reported that the total area of global wetland is about 11–13 mil-lion km2, and Mitraet al(2005)showed that estimates of carbon in global wetlands ranged from 202 to 535 Pg. PWs cover a broad class of wetlands, and our results show that Chinese PWs occupy 1% of global total wetland area, but hold 1%–2% of global wetland SOC in the upper 1 m of soil.
5. Conclusions
[image:9.595.119.553.82.237.2]The hybrid map produced in this study provides a new reference for PW distribution and quantification in Table 1.SOC stock and density(mean±standard error of the mean)in palustrine wetlands calculated with data from literature. The location of regions are shown infigure3.
Top soil(0–30 cm) Subsoil(30–100 cm) Total over upper 100 cm
Region Area(km2)
SOC stock (Pg C)
SOC density(kg C m−2)
SOC stock (Pg C)
SOC density(kg C m−2)
SOC stock (Pg C)
SOC density(kg C m−2) NEC 58 890 0.83±0.32 14.13±5.43 1.28±0.23 21.67±3.96 2.11±0.55 35.80±9.39 NWC 30 170 0.14±0.01 4.63±0.24 0.22±0.04 7.16±1.27 0.36±0.05 11.79±1.50 QTP 44 128 0.63±0.21 14.39±4.83 1.11±0.62 25.24±14.06 1.75±0.83 39.63±18.88 MTH 1659 0.01±0.00 3.40±0.46 0.01±0.00 6.22±0.98 0.02±0.00 9.62±1.44 NSH 717 0.01±0.00 14.28±2.77 0.01±0.00 18.86±4.52 0.02±0.01 33.14±7.29 MSH 1242 0.01±0.00 6.45±2.42 0.01±0.01 5.86±1.55 0.02±0.00 12.31±3.98 SSH 35 0.00±0.00 2.60±2.02 0.00±0.00 5.74±4.48 0.00±0.00 8.35±6.50 TH 122 0.00±0.00 4.94±0.98 0.00±0.00 4.43±1.46 0.00±0.00 9.37±2.44 China 13 6963 1.62±0.54 11.91±3.98 2.64±0.90 19.26±6.56 4.27±1.44 31.17±10.55
Table 2.Comparisons SOC stock and density of palustrine wetlands with peatlands, wetlands and country-wide soils within China.
Scale SOC density(kg C m−2) SOC stock(Pg C) Depth(m) Reference
China’s palustrine wetland 31.17±10.55 4.27±1.44 1 This study
155.25 2.09 1.11 (Wanget al2003)
China peatland 91.35 0.95 NA (Wang2009)
143.97 1.50 NA (Liuet al2012)
193 2.17 NA (Wanget al2014)
15.0 3.67 1 (Niuet al2009)
China wetland 22.4–27.5 5.04–6.19 1 (Zhenget al2013) 20.81–26.01 8–10 1 (Zhanget al2008)
8.01 70.31 NA (Wuet al2003)
All China soil 9.17 82.65 NA (Liet al2004)
[image:9.595.145.526.277.424.2]China which will be valuable for wetland planning and management. However, considerable differences exist when comparing the hybrid map with other available datasets, especially in Guangxi, Jiangsu, Anhui. For these provinces our results indicate that careful PW investigation is urgently needed to improve the accur-acy of the PW maps and SOC estimates.
PWs in China are widespread. Our results show that Chinese PWs occupied 1% of global total wetland area, but hold 1%–2% of global wetland SOC in the upper 1 m of soil. However, the existing research on these Chinese systems is most concentrated in the San-jiang plain, Zoige plateau, and the middle and lower reaches of Yangtze River. There is therefore a clear need to both broaden the studies across different regions and for regional co-operation in collecting data and building databases based on such systems. Given the global significance of the response of SOC to environmental change and the very large pool of car-bon stored in PWs, we suggest that regions with very limited datasets such as the PWs of the Tibet region and the NWC require an urgent monitoring pro-gramme and inventory effort. International co-opera-tion is also required to ensure that consistent and comparable datasets on wetland carbon content are developed to support the protection and enhancement of these systems. Given the difficulty in compiling data on the spatial extent and carbon content of wetland systems, this makes understanding whether these sys-tems are currently net sinks or sources for carbon even more challenging. Regional and international co-operation must be developed to ensure that the cur-rent and future carbon response of wetlands to global environmental change is understood and factored in to international and national policy and the IPCC wet-land supplement (Agrawala et al 2014, Stavins et al2014).
Acknowledgments
This study was supported by the International Science & Technology Cooperation Program of China
(2012DFA91530), the National Natural Science Foun-dation of China (41161140353, 91325302), the 1st Youth Excellent Talents Program of the Organization Department of the Central Committee, and the Fundamental Research Funds for the Central Univer-sities (TD-JC-2013-2). The research was also sup-ported by a Cheney Fellowship awarded to Professor Junguo Liu by the University of Leeds as part of the water@leeds research programme. We also want to thank Prof. Changhui Peng(Institute of Environmen-tal Sciences, Department of Biological Science, Uni-versity of Quebec at Montreal, Canada) for useful discussions on an earlier version of this manuscript. The data used in the paper can be requested from Professor Junguo Liu(junguo.liu@gmail.com).
References
Agrawala Set al2014 Regional development and cooperation Climate Change 2014: Mitigation of Climate Change Contribution of Working Group III to the Fifth Assessment Roport of the Intergovernmental Panel on Climate Change (Cambrige: Cambridge University Press)
Bai J, Ouyang H, Xiao R, Gao J Q, Gao H F, Cui B S and Huang L B 2010 Spatial variability of soil carbon, nitrogen, and phosphorus content and storage in an alpine wetland in the Qinghai–Tibet Plateau, ChinaAust. J. Soil Res.48730–6 Bellamy P H, Loveland P J, Bradley R I, Lark R M and Kirk G J D
2005 Carbon losses from all soils across England and Wales 1978–2003Nature437245–8
BFU 2011Mapping China’s Wetland Based on the First National Wetland CensusBeijing Forestry University
Carlson K M, Curran L M, Ratnasari D, Pittman A M, Soares-Filho B S, Asner G P, Trigg S N, Gaveau D A, Lawrence D and Rodrigues H O 2012 Committed carbon emissions, deforestation, and community land conversion from oil palm plantation expansion in West Kalimantan, IndonesiaProc. Natl Acad. Sci. USA1097559–64 Charman D, Beilman D W, Blaauw M, Booth R K, Brewer S,
Chambers F M, Christen J A, Gallego-Sala A, Harrison S P and Hughes P D M 2013 Climate-related changes in peatland carbon accumulation during the last millenniumBiogeosciences10929–44
Chen Y and Jessel B 2011Ecosystem Services and Management Strategy in China(Beijing: China Environmental Science Press) (in Chinese)
Davidson E A and Janssens I A 2006 Temperature sensitivity of soil carbon decomposition and feedbacks to climate change Nature440165–73
Duchaufour P 1982Pedology(London: George Allen and Unwin) Gorham E 1991 Northern peatlands: role in the carbon cycle and probable responses to climatic warmingEcol. Appl.1182–95 Holden J 2005 Peatland hydrology and carbon release: why
small-scale process mattersPhil. Tran. R. Soc.A3632891–913 Huang Y, Sun W J, Zhang W, Yu D S, Su Y H and Song C C 2010
Marshland conversion to cropland in Northeast China from 1950 to 2000 reduced the greenhouse effectGlob. Change Biol. 16680–95
Kang W, Tian H, He J N, Xi H Z, Cui S S and Hu Y P 2009 Carbon storage of the wetland vegetation ecosystem and its distribution in dongting lakeJ. Soil Water Conserv.23129–33 (in Chinese)
Kleinen T, Brovkin V and Schuldt R J 2012 A dynamic model of wetland extent and peat accumulation: results for the HoloceneBiogeosciences9235–48
Lehner B and Döll P 2004 Development and validation of a global database of lakes, reservoirs and wetlandsJ. Hydrol.2961–22 Li H 2009Studies on Changes of Landscape Pattern and Soil Organic
Carbon Storage in Rorergai WetlandSichuan Agricultural Univerisity(in Chinese)
Li K R, Wang S Q and Cao M K 2004 Vegetation and soil carbon storage in ChinaSci. ChinaD4749–57
Liu Z, Wang M and Ma X H 2012 Analysis of organic carbon storage and characteristics of China’s peatlandsChina Environ. Sci. 321814–9(in Chinese)
Lu Y and Xu H 2014 Distribution characteristic of soil organic carbon fraction in different types of wetland in hongze lake of ChinaSci. World. J.3246–61
Ma K, You L Z, Liu J G and Zhang M X 2012 A hybrid wetland map for China: a synergistic approach using census and spatially explicit datasetsPLoS One7e47814
Maltchik L, Lanés L E K, Keppeler F W, Rolon A S and Stenert C 2014 Landscape and habitat characteristics associated with
fish occurrence and richness in Southern Brazil palustrine wetland systemsEnviron. Biol. Fish.97297–308 Mitra S, Wassmann R and Vlek P L G 2005 An appraisal of global
wetland area and its organic carbon stockCurr. Sci. India88 25–35
Nachtergaele F, van Velthuizen H and Verelst L 2008Harmonized World Soil DatabaseFAO
National Bureau of Statistics of China 2007China Statistical Yearbook(2007) (Beijing: China Statistics Press) (in Chinese) National Soil Survey Office 1998Soil of China(Beijing: China
Agriculture Press) (in Chinese)
Niu Z Get al2009 Geographical characteristics of China’s wetlands derived from remotely sensed dataSci. ChinaD52723–38 Page S E, Rieley J O and Banks C J 2011 Global and regional
importance of the tropical peatland carbon poolGlob. Change Biol.17798–818
Paul E 1984 Dynamics of organic matter in soilsPlant Soil76275–85 Peng P Q, Zhang W J, Tong C L, Qiu S J and Zhang W C 2005a Soil
C, N and P contents and their relationships with soil physical properties in wetlands of Dongting lakefloodplainChin. J. Appl. Ecol.161872–8(in Chinese)
Peng P Q, Zhang W J, Tong C L, Wang X L and Cai C G 2005b Vertical distribution of soil organic carbon, nitrogen and microbial biomass C, N at soil profiles in wetlands of dongting lakefloodplainJ. Soil Water Conserv.1949–53(in Chinese)
Piao S L, Fang J Y, Philippe C, Philippe P, Huang Y, Stephen S and Wang T 2009 The carbon balance of terrestrial ecosystems in ChinaNature4581009–13
Post W M, Emanuel W R, Zinke P J and Stangenberger A G 1982 Soil carbon pools and world life zonesNature298156–9 Ramsar Convention Secretariat 2013The Ramsar Convention
Mannual: A Guide to the Convention on Wetlands6th edn (Ramsar, Iran, 1971) (Gland, Switzerland : Ramsar Convention Secretariat)
Sapart C, Monteil G, Prokopiou M, Van De Wal R S W, Kaplan J O, Sperlich P, Krumhardt K M, Van Der Veen C,
Houweling S and Krol M C 2012 Natural and anthropogenic variations in methane sources during the past two millennia Nature49085–8
Sigua G C, Coleman S W and Albano J 2009 Beef cattle pasture to wetland reconversion: impact on soil organic carbon and phosphorus dynamicsEcol. Eng.351231–6
Sjörs H 1980 Peat on earth: multiple use or conservation?Ambio9
303–8
Smith P, Chapman S J, Scott W, Black H I J, Wattenbach M, Milne R, Campbell C D, Lilly A, Ostle N and Levy P E 2007 Climate change cannot be entirely responsible for soil carbon loss observed in England and Wales, 1978–2003Glob. Change Biol.132605–9
Song C, Wang Y Y, Wang Y S and Zhao Z C 2006 Character of the greenhouse gas emission in the freshwater mire under human activitiesSci. Geogr. Sin.2682–6(in Chinese)
State Forestry Administration, P. R. C 2004The National Wetland Resources Census—Report(in Chinese)
Stavins Ret al2014 International cooperation: agreements and instrumentsClimate Change 2014: Mitigation of Climate
Change Contribution of Working Group III to the Fifth Assessment Report of the Intergovernmental Panel on Climate Change(Cambridge: Cambridge University Press) Stoblovoi V 2002 Carbon in Russian SoilsClim. Change55131–56 Tarmocai C, Canadell J, Schuur E, Kuhry P, Mazhitova G and
Zimov S 2009 Soil organic carbon pools in the Northern circumpolar permafrost regionGlob. Biogeochem. Cycles23
GB023
Thormann M N, Szumigalski A R and Bayley S E 1999 Aboveground peat and carbon accumulation potentials along a bog-fen-marsh wetland gradient in Southern boreal Alberta, Canada Wetlands19305–17
Tian Y B, Xiong M B, Xiong X S and Song G Y 2003 The organic carbon distribution andflow in wetland soil-plant system in Ruogegai plateauChin. J. Plant Ecol.27490–5(in Chinese) van der Valk A G 2013 Seed banks of drainedfloodplain, drained palustrine, and undrained wetlands in Iowa, USAWetlands. 33183–90
Vicari R, Kandus P, Pratolongo P and Burghi M 2011 Carbon budget alteration due to landcover-landuse change in wetlands: the case of afforestation in the lower delta of the paraná river marshes(Argentina)Water Environ. J.25378–86 Wang C 2009A Dynamic Research on Carbon Storage and Carbon
Budget in Peatlands in ChinaNortheast Normal University (in Chinese)
Wang Met al2014 Carbon dynamics of peatlands in China during the HoloreneQuat. Sci. Rev.9934–41
Wang S Q, Liu J Y and Yu G R 2003 Error analysis of estimating terrestrial soil organic carbon storage in ChinaChin. J. Appl. Ecol.14797–802(in Chinese)
Wang S Q, Zhou C H, Li K R, Zhu S L and Huang F H 2001 Estimation of soil organic carbon reservoir in ChinaJ. Geogr. Sci.113–13
Wu H B, Guo Z T and Peng C H 2003 Distribution and storage of soil organic carbon in ChinaGlob. Biogeochem. Cycles171048 Xu H H, Zeng C S, Wang W Q and Zhai J H 2010 Study on vertical
distribution and the influencing factors of soil organic carbon in Ebinur Lake wetlandJ. Fujian Norm. Univ.2686–91(in Chinese)
Yu D S, Shi X Z, Wang H J, Sun W X, Chen J M, Liu Q H and Zhao Y C 2007 Regional patterns of soil organic carbon stocks in ChinaJ. Environ. Manage.85680–9
Zhang W J, Xiao H A, Tong C L, Su Y R, Xiang W S, Huang D Y, Syers J K and Wu J S 2008 Estimating organic carbon storage in temperate wetland profiles in Northeast ChinaGeoderma 146311–6
Zhang X H, Li D Y, Pan G X, Li L Q, Lin F and Wu X W 2008 Conservation of weltand soil C stock and climate change of ChinaAdv. Clim. Change. Res.4202–8(in Chinese) Zheng Y M, Niu Z G, Gong P, Dai Y J and Shangguan W 2013