This is a repository copy of Towards smart electrolytic plasma technologies: An overview of methodological approaches to process modelling.
White Rose Research Online URL for this paper: http://eprints.whiterose.ac.uk/87137/
Version: Accepted Version
Article:
Parfenov, E.V., Yerokhin, A., Nevyantseva, R.R. et al. (3 more authors) (2015) Towards smart electrolytic plasma technologies: An overview of methodological approaches to process modelling. Surface and Coatings Technology, 269. 2 - 22. ISSN 0257-8972 https://doi.org/10.1016/j.surfcoat.2015.02.019
[email protected] https://eprints.whiterose.ac.uk/
Reuse
Unless indicated otherwise, fulltext items are protected by copyright with all rights reserved. The copyright exception in section 29 of the Copyright, Designs and Patents Act 1988 allows the making of a single copy solely for the purpose of non-commercial research or private study within the limits of fair dealing. The publisher or other rights-holder may allow further reproduction and re-use of this version - refer to the White Rose Research Online record for this item. Where records identify the publisher as the copyright holder, users can verify any specific terms of use on the publisher’s website.
Takedown
If you consider content in White Rose Research Online to be in breach of UK law, please notify us by
Towards Smart Electrolytic Plasma Technologies:
an Overview of Methodological Approaches to Process Modelling
E.V. Parfenov1, A. Yerokhin2*, R.R. Nevyantseva1, M.V. Gorbatkov1, C.-J. Liang2, A. Matthews2
1 Ufa State Aviation Technical University, 12 Karl Marx Street, Ufa, 450000, Russian Federation
2 The University of Sheffield, Sir Robert Hadfield Building, Mappin Street, Sheffield, S1 3JD, United Kingdom
Abstract
This paper reviews the present understanding of electrolytic plasma processes (EPPs) and approaches to their modelling. Based on the EPP type, characteristics and classification, it presents a generalised phenomenological model as the most appropriate one from the process diagnostics and control point of view. The model describes the system ‘power supply – electrolyser –electrode surface’ as a system with lumped parameters characterising integral properties of the surface layer and integral parameters of the EPP. The complexity of EPPs does not allow the drawing of a set of differential equations describing the treatment, although a model can be formalised for a particular process as a black box regression. Evaluation of dynamic properties reveals the multiscale nature of electrolytic plasma processes, which can be described by three time constants separated by 2-3 orders of magnitude (minutes, seconds and milliseconds), corresponding to different groups of characteristics in the model. Further developments based on the phenomenological approach and providing deeper insights into EPPs are proposed using frequency response methodology and electromagnetic field modelling. Examples demonstrating the efficiency of the proposed approach are supplied for EPP modelling with static and dynamic neural networks, frequency response evaluations and electromagnetic field calculations.
Keywords: Electrolytic plasma processing; Smart technology; Phenomenological model; Process diagnostics; Process control; Frequency response; Electromagnetic field
CONTENTS
INTRODUCTION 4
CLASSIFICATION OF ELECTROLYTIC PLASMA PROCESSES AND CORRESPONDING MODELS 5
2.1. Brief characteristics of electrolytic plasma processes... 5
2.2. Process classification ... 6
2.3. Model classification ...11
PHENOMENOLOGICAL MODELLING OF ELECTROLYTIC PLASMA PROCESSES 3.1. Generalised structure ...13
3.2. Formalisation possibilities ...18
3.3. Dynamic properties of EPPs as multiscale systems...20
3.4. Regression modelling and design of experiments ...21
3.5. Frequency response approach to the process diagnostics ...23
3.6. Electromagnetic field modelling ...25
3.7. Perspective on phenomenological modelling and research of electrolytic plasma processes ...26
EXAMPLES OF EPP PHENOMENOLOGICAL MODELLING 4.1. Regression neural network modelling ...28
4.2. Frequency response modelling ...30
4.3. Electric field modelling ...31
CONCLUSIONS
List of abbreviations
AC – alternating current
COMSOL – commercial multiphysics modelling software package DC – direct current
EIS – electrochemical impedance spectroscopy EP – electrolytic plasma
EPCS – electrolytic plasma coating stripping EPHT –electrolytic plasma heat treatment EPP – electrolytic plasma process/processing EPPo – electrolytic plasma polishing
EPSC – electrolytic plasma surface cleaning FR – frequency response
GRNN – general regression neural network
Hi-PIMS – high-power impulse magnetron sputtering
NARX – nonlinear autoregressive network with exogenous inputs NDR – negative differential resistance
PEC/N – plasma electrolytic nitrocarburising
PE-CVD – plasma enhanced chemical vapour deposition PEO – plasma electrolytic oxidation
1. Introduction
Electrolytic plasma processes (EPPs) have recently gained significant attention from coating and metal finishing industries due to their capability to considerably enhance surface properties and environmental compatibility [1, 2]. Being a progression of conventional electrochemical treatments into high voltages, EPPs feature electrolyte boiling and/or discharging phenomena in the vicinity of the working electrode [3, 4]. They are also known to exhibit highly non-linear behaviour manifested in current-voltage and boiling characteristics featuring inflections, extremes and sometimes negative slope regions [1]. These non-linearities may explain why EPPs could in practice surpass their conventional counterparts but represent major challenges for their theoretical description. As will be discussed below, although a range of partial EPP models has been developed, none of them covers all varieties of processing conditions ranging from plasma electrolytic oxidation (PEO) [5] to coating stripping (EPCS) [6] and from heat treatment (EPHT) [7] to surface cleaning (EPSC) and polishing (EPPo) [8].
and Hi-PIMS [11, 12]; for EPPs however this still remains in a rudimentary state despite some recent progress [13].
This review puts together information regarding electrolytic plasma processes in a structure which helps in understanding their generic features and corresponding electrical characteristics that are important in different practical applications as well as retrieving observable and controllable variables that contribute to the process diagnostics and control. It is also intended to provide a perspective into further possible developments based on the phenomenological approach as well as achieving better insights into electrolytic plasma processing.
2. Classification of electrolytic plasma processes and corresponding models
2.1. Brief characteristics of electrolytic plasma processes
Electrolytic plasma treatments were introduced in the 1950-s [14, 15], although the first reports of underlying physical effects and phenomena date back to the 19th century [16]. These processes are used for surface finishing, including case hardening, nitriding and carbonitriding, [3, 7, 17-20], surface oxidation [21-25], cleaning [26, 27] and polishing [28-30] as well as stripping of defective coatings [6, 31].
EPPs operate in the voltage range 80-1000 V which is higher than that for conventional electrochemical treatments. Aqueous solutions of salts, acids or alkali with low concentration (from 1 to 20%) are used in most cases, and these electrolytes are usually non-toxic and easy to recycle. In the beginning of the process, high current density at the surface of the working electrode (which is usually smaller than the counter electrode) leads to intensive electrolyte evaporation; electrochemical gas evolution and oxide formation also take place.
across the VGE which is a non-stationary object with a high field, promoting a plasma discharge in the gas media. With the reverse biased junction, the EPP on the anode features formation of a stationary oxide film which attains the majority of the voltage drop. Upon achieving a breakdown field strength in this thin film, microdischarges appear on its surface. These phenomena distinguish EPPs from other electrolytic processes and justify the use of term ‘plasma’.
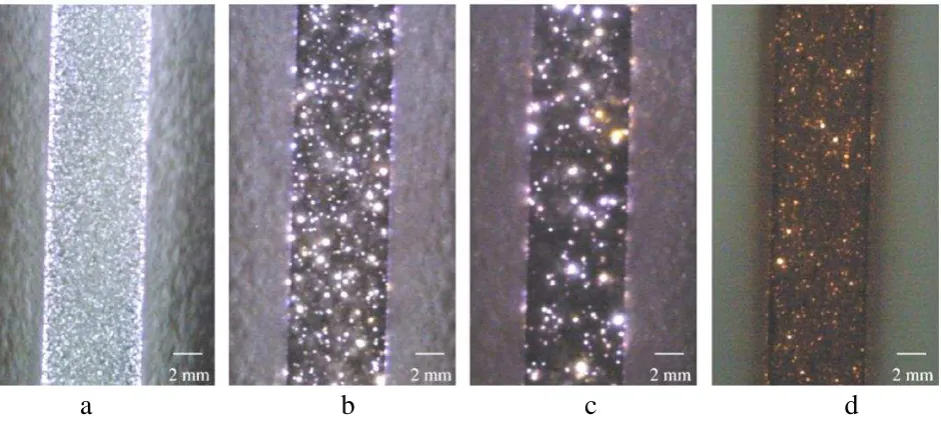
Visualisation of EP processes has been improved by the availability of high speed digital video recording technology. For the processes with the VGE, typical images are presented in Fig 2 [34, 35], illustrating a progression from gas bubble evolution (a) to VGE formation (b) and microdischarge development (c,d) which results in surface polishing. Typical images of microdischarges in the pores of oxide films are provided in Fig. 3, demonstrating that both average size and population density microdischarge events evolve with treatment time in a complex manner [36-39].
The main characteristics of EPPs are the current-voltage relationship [1, 40, 41] and boiling characteristics [1, 42]. Both are substantially non-linear and exhibit at least one range with a negative slope. This indicates that EPPs are complex and non-linear systems that can be described by neither electrochemical nor plasma models alone; therefore, a synergetic approach should be adopted for modelling of these processes.
2.2. Process classification
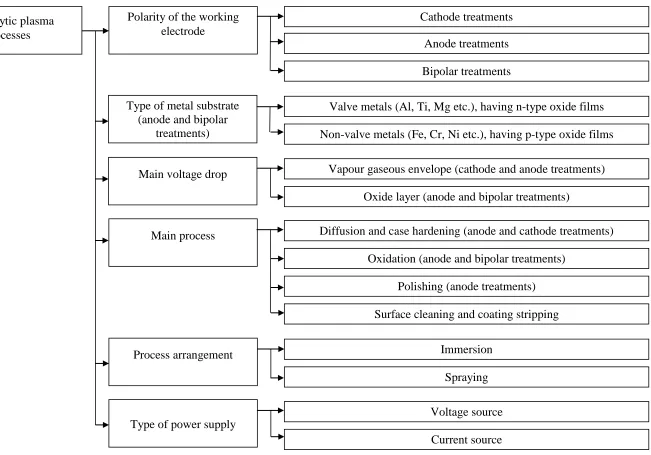
EPPs can be categorised by several features as shown in Fig. 4 and discussed below.
2.2.1. Working electrode polarity
By the polarity of the working electrode, cathode [43] and anode [44] treatments can be distinguished, which are different in the electrochemical processes involved and the electron emission mechanism responsible for discharge generation.
oxidation (2). Depending on electrolyte chemical activity, the latter could result in either surface dissolution or formation of an anodic oxide film (3). Hydrogen evolution (4) and/or cation reduction (5) occur on the cathode surface:
2H2O – 4e– O2 + 4H+ (1)
Me – ne– Men+ (2)
x n+ + 3/2xnH2O MexOn
+ xn
H3O+ (3) 2H++ 2 H2 , (4)
Catn++ n Cat0 (5)
For cathode EPP, the working electrode area must be less (by at least an order of magnitude) than that of the anode, to provide high local current densities promoting electrolyte boiling. This, together with hydrogen evolution, contributes towards formation of VGE, whereas deposition of reduced cations changes electrode surface composition. The metal electrode in the cathode treatments can be heated up to 1000 °C, which enables plasma electrolytic carburising and nitrocarburising (PEC/N) and other diffusion-based treatments [45, 46]. For the anode EPPs, the electrode area ratio is less critical. Instead surface passivation of the working electrode is important which can lead to the growth of oxide films according to reaction (3), giving rise to a wide variety of PEO processes [47-49], or if (3) is overcome, to the surface cleaning and polishing to a mirror finish [50] as well as case hardening [51, 52], nitriding [3] and coating stripping [6].
2.2.2. Metal substrate type and the main voltage drop in the system
For PEO treatments, the type of metal substrate is of high importance as various oxides can be formed on the anode surface according to (3) [32]. Valve metals (Al, Ti, Mg, Ta, Zr) form n-type semiconductor oxide films due to the presence of anionic vacancies at the metal-oxide interface and a space charge region (SCR) within the film [57]. The SCR width depends on the concentration of charge carriers, oxide relative permittivity, interfacial potential drop, magnitude and polarity of applied voltage. At the anodic polarisation, the surface layer exhibits low conductivity (the valve effect) and the major voltage drop occurs across it. With the SCR thickness usually being less than a micron, the electric field there at voltages typically applied in EP treatments can reach breakdown values (~ 107 V/cm) [33]. PEO treatments can therefore be easily implemented to grow protective coatings on the valve metals [2, 58]. For other metals, such as Fe, Cr, Ni, W, Cu etc., that either form p-type oxide films (3) or do not form stable oxides at all (2), high anodic potentials result in VGE formation, promoting non-oxidising treatments, e.g. polishing [59], although recent developments of fluorine containing electrolytes also help in carrying out polishing of valve metals [60].
2.2.3. Processing conditions and required surface properties
EPPs can also be categorised into several types of processes (as indicated in Sections 1 and 2.1) intended to achieve different surface characteristics and properties, requiring different processing conditions and parameters to be controlled.
[40]. For prolonged EPHTs, the bulk of the working electrode can be heated up in order to achieve a desired microstructure and/or phase transformation.
PEO is used to form oxide ceramic surface layers with different thicknesses, phase compositions, protective and functional properties [1, 2]. Typical coating morphologies are shown in Fig. 5b and 5c for Al and Ti alloy substrates [62, 63]. Localised microdischarges contribute to the formation of high temperature oxide phases, such as rutile and corundum, within the coating, providing hardness and chemical stability [64, 65]. Porosity could provide the coating with useful functionality, e.g. by increasing specific surface area; moreover it may contribute to internal stress state and improve coating adhesion by reducing its global stiffness, but could also affect such important properties as wear and corrosion resistance [66].
EPPo requires bubble boiling in the VGE [67], which helps to decrease the surface roughness down to Ra ≈ 0.05 m. Although the initial surface state defines the minimal roughness achievable by the treatment, a 4 to 5 fold improvement in the surface finish can be realised [68]. A typical surface morphology after EPPo is shown in Fig 5d; traces of original surface topology can still be discerned, smoothed significantly by the treatment [13].
EPSC removes rust, oxide scale or organic contaminants [8, 26, 27]. It operates at cathodic polarisation of the working electrode. Spark discharges in the VGE provide cavitation effects at the electrode surface as well as heating, melting and resolidification of a thin surface layer [8]. As a result, the contaminants are removed by pressure waves or are decomposed in the plasma discharge by thermolytic and/or radiolytic mechanisms. As shown in Fig. 5e, a typical surface morphology exhibits micro-craters and spheroidal nodules [8], resulting in a typical 3 to 4 fold increase in surface roughness. This however can be mitigated by application of pulsed current providing control over the impact of plasma discharge on the surface [27]. Formed amorphous or nanostructured surface layers could increase corrosion and erosion resistance [26] but reduce the fatigue strength of the material [27].
except for anodic dissolution which is intensified by the boiling conditions, hence surface composition, roughness and dimensional tolerance are important. Typically, an aluminide coating can be stripped at a rate of 2 to 3 m min–1 [69]. The stripping proceeds gradually (Fig 5f), with no pitting corrosion developing on the surface. After the stripping, a new coating can be applied on the component, thus prolonging its operating life.
2.2.4. Process arrangement
Electric energy consumed during EPP lies within the range 300 to 500 W/cm2 (4 to 5 kW·h·m–2 m–1) [25]. Therefore, a technological constraint of ≤0.5 m2 is usually imposed on the treated surface area. Smaller surfaces can be treated as a whole, using bath immersion configuration (Fig. 6a), whereas spraying processes carried out with a specially designed counter-electrode tool (Fig. 6b) are usually applied to sequentially treat larger surface areas. Most EPPs are implemented in the bath; in spraying processes, the electrolyte is pumped through holes focused by a dielectric nozzle contacting the workpiece. The VGE appears where the electrolyte touches the treated surface as shown in Fig. 5 for EPHT. A range of counter-electrode tool designs has also been developed for PEO of large scale marine components [70].
2.2.5. Power supply type
processes with VGE, the current decay can be attributed to the electrolyte heating if no cooling is provided; for oxidation treatments, the current decreases due to the layer growth causing an increase in its resistance, if no structural defects are formed within it. For the latter processes, current-controlled sources can be preferred provided that the relation of oxide growth to Faraday’s law within the operation window is confirmed. Such supplies contain power inductors in series with the electrolysers and feedback circuits for current stabilisation [73]. The process evolution is usually characterised by the voltage transient behaviour (Fig. 7b) which can be linked to the coating growth.
For pulse and bipolar EPPs, such categorisation also stands, since the pulse unit itself is fed by a voltage or current source. These processes can be described by the behaviour of average or RMS values of corresponding electrical parameters as shown in Fig. 7, although a more sophisticated analysis of dynamic voltage-current curves and/or voltage/current transients may also be performed [41, 74-76].
2.3. Model classification
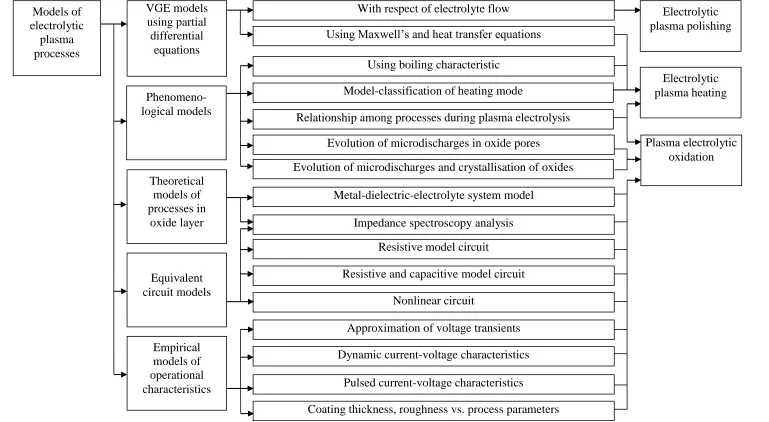
The EPP models can be arranged into groups as shown in Fig. 8.
VGE models using differential equations have been proposed for polishing and heating processes which do not feature formation of oxide layers during the treatment. These quite complex theoretical models involve variable thermal-physical parameters related to the electrolyte flow [67] and VGE shape [77].
various EPPs. Microdischarge evolution in the pores of oxide layers and oxide crystallisation phenomena during PEO processes have been discussed in [79-81].
One group of theoretical models focuses on metal-dielectric-electrolyte interfaces [33] and analyses of impedance spectra [82, 83]. This group is tightly connected with equivalent circuit models which can be obtained from the impedance spectra and current-voltage characteristics. The circuits formed by resistive elements [84] are mainly used for DC EPPs, whereas those made by resistive and capacitive elements [85, 86] can be used for pulsed PEO and the nonlinear circuits [80] which apply to AC PEO conditions.
There are also empirical models which include the approximation of voltage transients are used for galvanostatic DC PEO processes [87]. They also include approximations of dynamic and pulsed current-voltage characteristics, used for AC and pulsed PEO processes respectively [41, 81]. Empirical regression models help to estimate dependencies between the process parameters (voltage, current density, electrolyte temperature) and the surface properties, e.g. coating thickness and roughness. A range of such models can be found in the literature for different EPPs [68, 74].
3. Phenomenological modelling of electrolytic plasma processes
3.1. Generalised structure
Based on the above analysis, a generalised phenomenological model structure has been proposed (Figs. 9 and 10). The structure is a further development of the phenomenological model presented earlier [78]. The model considers integral EPP characteristics at a macro level for volumes substantially exceeding the Debye radius. The generalised phenomenological model is based on the systematic analysis of EPP mechanisms, and their further decomposition into subsystems.
The following EPP features were considered in the model: oxidation, heating, polishing, and coating stripping, all in aqueous electrolytes. The model describes the system ‘power supply – electrolyser – treated surface’ as a system with lumped parameters which characterise integral properties of the surface layer and integral parameters of the process.
3.1.1. Major subsystems
3.1.2. Processes in the subsystems
On the first level of the model, electrodes 1 and 5 feature anodic and cathodic processes typical of any electrochemical treatment. If the working electrode is positively polarised, it features anode processes 1.1.1, whereas the counter electrode features cathodic processes 5.1.1, and vice versa (1.1.2 and 5.1.2 respectively). Additionally, the processes of thermionic emission 1.1.3 specific to cathode EPPs may occur on the negatively polarised working electrode. Moreover, during cathode EPHT the working electrode also features metallurgical processes 1.1.4.
The processes in the electrolyte 4 include processes 4.1.1 that are similar for any kind of electrochemical treatment at any polarisation, and processes 4.1.2-4.1.4 characteristic of EPPs only. The latter reflect phenomena occurring at the partial electrolytic cathode and anode formed by the VGE-electrolyte interface during anodic and cathodic polarisation of the working electrode, respectively. Some processes in this category are common (4.1.2), other depend upon electrode polarity. For example, formation of hydrated electrons and their emission into the VGE with further avalanche evolution of an electric discharge in it occur only at the electrolytic cathode 4.1.3. Otherwise, the electron emission proceeds from the surface of the metal electrode and the current in the VGE flows in the opposite direction. This leads to much more intensive radiolysis at the electrolytic anode 4.1.4.
The processes in the surface layer 2 are the most complex in the system, and they are individual for any EPP type. These include surface layer formation 2.1.1 by different mechanisms similar to electrochemical treatments, as well as plasma-assisted and metallurgical processes 2.1.2 and 2.1.3 are specific to EPPs. The latter transformational processes define the final properties of the surface layer after the treatment.
Note that control of processes 2.1 in the surface layer can be achieved only indirectly via the processes 3.1, 4.1, 1.1 and 5.1 (in descending order of influence) by controlling the electric power supply 6 and the heat power supply 7, provided that the properties of the subsystems 1–5 are identified.
3.1.3. Electrical characteristics of the subsystems
The second layer in the structure of the phenomenological model comprises the electrical characteristics of the subsystems (Fig. 10). This arrangement reflects the fact that the electric power is the major driving force for surface modifications during EPPs. For all subsystems, the electric phenomena, equivalent circuit and electromagnetic field properties should be considered. Note that within the phenomenological approach to the analysis of integral characteristics, the electromagnetic field properties are considered as averaged over the corresponding subsystem.
help in assessing the net electrolyte resistance for a certain configuration of the electrolyser.
Electrical characteristics of the VGE 3 are dominated respectively by ionic and electronic conductivity in the absence and presence of a plasma discharge. These conductivity mechanisms define the value of a corresponding resistive element in the equivalent circuit. One of the main features of the VGE is negative differential resistance (NDR) which appears in certain regions of current-voltage characteristics [1] owing to the following two reasons: (i) the VGE thickness increases with increasing voltage due to higher Joule heat, and the current decreases; (ii) current-voltage characteristics of plasmas developed in electric discharges that occur in the VGE may exhibit NDR. If a continuous VGE is present, almost all supplied voltage drops across it and this induces a strong electric field in the VGE, initiating a distributed electric discharge visible by an unaided eye.
Electrical characteristics of the surface layer 2 depend on its conductivity which can be of electron (for metals and some oxides, nitrides and carbides), electron-hole (for oxides having semiconductor properties) or ion (for microdischarges in pores) type. Relevant resistances in equivalent circuits can correspond to electronic and ionic conduction, whereas NDR could reflect the characteristics of electric discharges in the pores, and capacitances can be attributed to surface layers with low specific conductivity. If a continuous oxide layer is present on the surface, almost all supplied voltage will drop across it, initiating a strong electric field which would trigger localised microdischarges in the layer pores and other defects.
dielectric surface layer at different stages of the treatment. The models of these processes are the most complex. Moreover, in such complex systems, it is not straightforward to distinguish the VGE from the surface layer and unambiguously identify the type of discharge and the subsystem where it primarily evolves.
3.1.4. Measurable and controllable characteristics of the subsystems
Each subsystem can be characterised by parameters measurable during the treatment (observable) and after it (unobservable). Both of them are controllable since they can be influenced by variations in voltage, current and electrolyte temperature imposed by an operator.
The electrodes 1 and 5 have different requirements. If the counter electrode has to maintain its chemical and phase composition 5.3.1, the requirements to the working electrode – i.e. the component being treated – are more formalised in terms of physical, chemical and mechanical properties 1.3.1 that are measurable only after the treatment. During the process, however, it is possible to measure only a limited number of characteristics, such as electrode temperature 1.3.2. For the electrolyte 4, the majority of its electrochemical, optical and other properties 4.3.2 can be measured during the treatment, while the chemical composition 4.3.1 could be accurately assessed only after the treatment. Since VGE 3 does not exist apart from during the EPP, only in-situ measurements 3.3.2 are possible. Significant information could be gained from visualisation techniques which supply spatial characteristics [37, 89], type of boiling [90], optical emission intensity [4, 91, 92] and spectral content [38, 93, 94] associated with the VGE. Acoustic techniques could be also informative [95, 96].
stripping of a coating). Therefore, to retrieve observable and controllable variables contributing to the EPP diagnostics and control, it is necessary to apply indirect techniques wherein information regarding properties 2.3.1 is extracted using evolution of estimates 3.3.2, 5.3.2, 1.3.2, 4.3.2 obtained e.g. from measured electrical characteristics 1.2.2, 2.2.2, 3.2.2, 4.2.2, 5.2.2 via justified equivalent circuits [75, 97].
3.2. Formalisation possibilities
The complexity of the electrolytic plasma system does not currently allow formalisation in the form of differential equation sets describing the treatment of real components in industrial electrolytes. These sets cannot be formalised comprehensively and therefore still remain unresolved. As a result, a phenomenological approach to EPP description and black box regression models using experimentally obtained data appear to be justified. These models can be realised using different means of regression analysis – from linear regression equations to neural networks [98, 99]. All these means perform a non-linear transformation of the space of inputs into the space of outputs.
A typical model structure is shown in Fig. 11a. Column vector of inputs X corresponds to the parameters of electrical and heating power supplies 6 and 7 in Figs. 9 and 10; these parameters must be controllable in order to have reproducible outputs. The inputs could include electrical regimes (e.g. DC voltage value, or pulse amplitude, frequency, duty cycle and other parameters describing the voltage waveform) and electrolyte temperature (either initial value or that stabilised by a thermostat). Procedures of data scaling to the range [–1; +1] and descaling help to improve the model quality and contribute to the significance analysis of the input variables (Fig. 11b).
differences, and the time variable is included indirectly as a discrete time step as in [100].
The column vector of outputs S comprises the surface properties after the treatment and corresponds to blocks 2.3.1 and 1.3.1 in Fig. 10. These output variables evolve in long time scale so that corresponding time constants range into several minutes. The column vector of outputs C = [C1; C2] includes variables measurable during the electrolytic plasma process, and it could contain characteristics from blocks 1.3.2, 3.3.2, 4.3.2 and 5.3.2 in Fig. 10. Instantaneous values of these characteristics form vector C1; they evolve in short time scale so that corresponding time constants range into milliseconds. However, their integral (averaged over time) values which form vector C2 evolve more slowly. These functions are the most informative for the process diagnostics, although the optimal averaging parameters must be considered individually for a particular EP process, and this task is very complex and at the state of the art [101].
For characteristics 5.3.2.1 and 5.3.2.2 (Fig. 10) – current and voltage are connected by Ohm’s law, and they cannot both together be inputs or outputs. If the voltage is an input, the current is an output, and vice versa. Here we consider the voltage as an input and the current as an output, which is typical for EPPs with the VGE. For PEO type processes, the opposite consideration can sometimes be beneficial but this does not alter the concept of the phenomenological model.
A particular composition of vectors X, S and C is defined by measurement tools available to a researcher; however, the most crucial ones for investigation and modelling of the electrolytic plasma processes should be considered as follows:
- vector X: average, effective (RMS) and instantaneous (waveform) values of voltage 5.3.2.2; average (over volume) electrolyte temperature 4.3.2.1;
- vector S: phase composition 2.3.1.1 and 1.3.1.4; coating thickness 2.3.1.7; roughness 2.3.1.4; specific weight change 1.3.1.5; corrosion properties 2.3.1.3; fatigue strength 1.3.1.2;
Expansion of vector S provides a deeper understanding of surface layer transformation as a result of EPP. Expansion of vector C contributes to the EPP diagnostics and control possibilities. Any expansion of these vectors improves the understanding of the process mechanism.
3.3. Dynamic properties of EPPs as multiscale systems
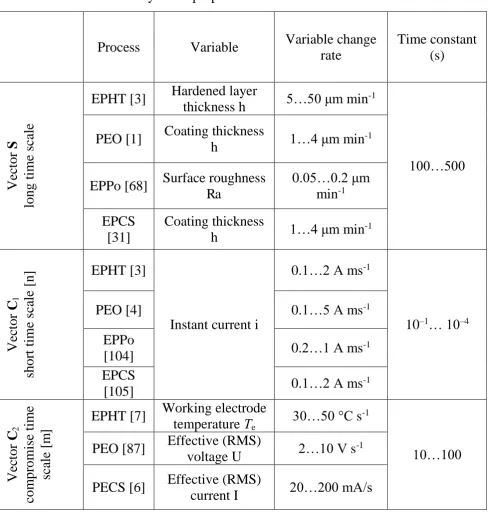
Now consider changing rates of EPP characteristics and evaluate corresponding time constants as the first order measures of the system inertia. Evaluation of dynamic properties for various EPPs is shown in Table 1.
The most common data concerning EPP dynamics describe the surface properties comprising vector S. Typical examples are collated in Fig. 12 as time dependencies for EPPo [68], PEO [39] and EPCS [69] processes at optimal values of voltage (U) and electrolyte temperature (T). As seen from Fig. 12, PEO and EPCS processes, which are intended to produce a change of the modified layer thickness, run at approximately constant rate from 1 to 3 m/min. The EPPo process which primary objective is to reduce surface roughness Ra has much higher rate in the beginning of the treatment, and this can be described by an exponential fall [68]. A typical EPP duration reaches tens of minutes, with the longest PEO treatments lasting up to several hours [25, 73, 102]. Therefore, for vector S, the time constant value ranges into hundreds of seconds (Table 1); this corresponds to the process evolution in the long time scale and can be adequately described with a sampling period in the range of minutes.
microseconds to hundreds of milliseconds (Table 1). Data acquisition with appropriate sampling rates of tens and hundreds of kHz generates a significant volume of often noisy data which needs statistical signal processing.
The third type of data comprises RMS voltage and current chronograms, i.e. averaged values of the instantaneous waveforms or instrument readings included into vector C2. Fig. 15 (a, b) shows typical voltage and current chronograms for PEO processes with stabilised RMS current and voltage respectively [107, 108], whereas Fig 15(c) presents a typical current chronogram for an EPP with a VGE [6]. The curve shapes which are generally similar to those in Fig. 7 help in the evaluation of time constants for the characteristics in vector 2 (Table 1). Corresponding values range into tens of seconds, which provides a compromise time scale to enable formal EPP description and modelling.
For better understanding, diagnostics and control of EPPs, new controllable and observable parameters with time constants close to those for the variables in vector S should be found by appropriate integration techniques in electric, acoustic or optical characteristics and put into vector C2. This is a new, important and challenging problem, solutions for which just started to appear [95, 97, 109, 110].
Thus, electrolytic plasma processes are multiscale systems described by three time constants which are separated by 2-3 orders of magnitude and correspond to different groups of characteristics in the phenomenological model. To obtain a finite difference dynamic model for a particular EPP, the discrete time step size t should correspond to the time constants for vector C2, ranging from seconds to tens of seconds. To put together the multiscale data from vectors S, C1 and C2, the data from vector C1 must be averaged, and the data from vector S must be interpolated. Correctness of the data representation for vector S is ensured by the slow rate of surface layer evolution during the treatment. Correctness of the data representation for vector C1 is ensured by the ergodicity interval for the instantaneous values being similar to the step size of the discrete compromise time scale [86].
The black box concept used for the phenomenological modelling (Fig. 11) is tightly connected with experimental design methodology [111]. Various researchers use different designs, from full factorial to complex composite, including Taguchi analysis [112, 113]. Design of EPP experiments could be performed to address the following aims:
1) process mechanism investigation;
2) establishment of optimal treatment conditions; 3) development of nonlinear models of the process; 4) development of process diagnostics methods.
To develop verified EPP models including diagnostic information, detailed research into a wide range of factors is required. Due to process non-linearity, the application of full factorial designs with more than two factor levels is inevitable. Such designs, including at least voltage, electrolyte temperature and treatment duration as the factors, are quite laborious. Investigation of modern EPPs that employ pulsed bipolar current also requires the factors of the pulse shape and frequency, to be taken into account and this increases the design matrix dimension yet further. Comparison of studies based on different experimental designs, e.g. central composite [78], fractional factorial [86] and full factorial [39, 69], shows the following. The surface properties evolution analysis is seriously impeded if the experimental points are absent or shifted from the factor levels of the full factorial design. Mathematical models, even those based on neural networks, do not allow the restoration of sufficient information regarding the surface state. Overcoming these obstacles require additional experiments, so that their total number could eventually reach that in the full factorial design. Therefore, in the state space cross-section corresponding to the technological factors, a full-factorial design is highly recommended.
individual experiments are required. However, for near stationary EPPs, the surface layer is persistent after the treatment termination, and the results of experiments with and without termination would be statistically similar. For processes, such as PEO, EPPo and EPCS, it is possible to obtain several experimental points by using one sample which is sequentially treated and measured after each run step. This approach significantly reduces the required number of samples but relies on a robust measurement technique.
According to the experimental design, measurements of the surface properties are required after each planned treatment duration. This requires process termination and manipulation with the samples, which can take significant time. Employing indirect methods of in-situ surface state evaluation helps in reducing the design dimension over the process duration factor.
The problem of an increased number of experiments in order to investigate the effects of frequency and other pulse parameters could be partly resolved using the frequency response (FR) approach which utilises the ergodicity time for a slow non-stationary process for performing measurements over frequency [101]. In other words, the frequency scans run in the ‘fast’ time for the system which properties gradually evolve in the ‘slow’ time as shown in Section 3.3. Therefore, the experimental design dimension can be collapsed over frequency so that the scans occur in every experiment, thus, contributing to saving samples and runs.
Finally, in EPP studies, it is advisable to apply full factorial designs, wherein, for every combination of factor levels corresponding to technological parameters, individual experiments are performed using different samples for strongly non-stationary EPPs; for near-to-non-stationary processes, this can be done using a single sample. Dependencies on the pulse parameters, e.g. frequency, can be investigated within every experimental run due to the time scale difference between these parameters and surface properties.
One of the main problems that slow down industrial EPP applications is a lack of diagnostic tools that provide possibilities for process monitoring and control, i.e. tools that could join vectors S and C together. The reason for the diagnostic tools not being commonly accepted and widely used is that the surface properties of the treated components are unavailable for measurements during the treatment, and, therefore, they are considered unobservable (but controllable) state variables of the system. As seen from the phenomenological model structure (Fig.10, block 3.3.2), several approaches to the process diagnostics are available, e.g. based on the analysis of electrical [104, 114, 115], optical [38, 91, 93, 94, 116] and acoustic [95] characteristics, video imaging [36, 37], and their various combinations [4, 96, 117]. Only a few however are developed enough to be employed in a real-time process control system, e.g. voltage-current characteristics [73, 110], power spectral density of the current [100], and characteristic line intensities of discharge optical emission spectra [109].
All of the above diagnostic approaches belong to the class of passive system identification. Recently, an active identification approach was developed on the basis of the frequency response measurements, both for large and small signal modes [39, 86]. It was shown that this method allows direct identification of the surface layer properties, e.g. barrier layer specific capacitance [83], and also indirect identification of non-electric properties, such as coating thickness and roughness [86]. The methodology of data acquisition and signal processing within this approach is presented in [101]; whereas the methodology of phenomenological modelling based on diagnostics information is discussed below.
[119] formalise the bounds within which the FR approach can be applied to verify evidence of processing conditions and surface properties in electrical characteristics [120]. The frequency response analysis and simulation 4 includes application of spectral methods, including electrochemical impedance spectroscopy (EIS) approaches to the equivalent circuit structural and parametric identification resulting in forming vector C in the model. Besides conventional resistive and capacitive components from EIS, negative differential resistance and distributed elements may appear in the equivalent circuits to fit complex shaped spectra. This step is tightly connected with the surface analysis and characterisation 5. Information obtained through the coating thickness, morphology, functional properties evaluation, as well as phase and chemical composition assessment forms vector S in the model. Uncovering regularities connecting blocks 4 and 5 using correlation and other types of statistical analyses formalises the ways to connect the process characteristics and the surface state. Therefore, block 6 – process diagnostics and control using in-situ and ex-situ methods can be realised, leading the development of the electrolytic plasma processes to a new horizon.
Finally, this framework offers a path for further research into EPP fundamentals and provides a powerful tool for process diagnostics and control, thus contributing towards smart electrolytic plasma technologies.
3.6. Electromagnetic field modelling
the electrolyte and the VGE respectively [73, 122]. This is a growing area for research [123].
Electromagnetic field modelling is well-established for the analysis of electrochemical processes. It is widely used for simulation and structural optimisation of electrolysers with liquid metals, especially for Al reduction [124], cathodic protection systems [125], fuel cells and batteries [126], anodic coatings [127] and other applications. The nonlinearity of EPPs discussed earlier could be a reason why it has not so far been explored for this group of processes. Solution of field problems for EPPs would contribute to the phenomenological modelling, e.g. by determining the net electrolyte resistance as a boundary condition for the frequency response analysis or specifying the boundaries within the phenomenological approach that treats the process as a system with lumped characteristics.
3.7. Perspective on phenomenological modelling and research of electrolytic plasma processes
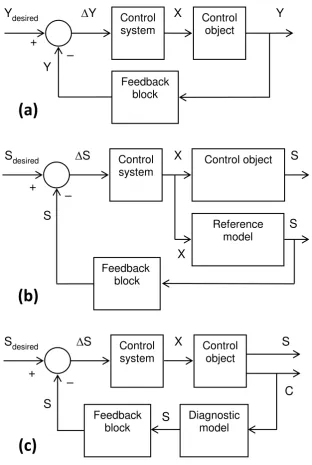
The advancement of electrolytic plasma technologies relies strongly on availability of adaptive process control systems (Fig 1 (b,c)) tailored to particular processes. Development of essential elements of such systems constitutes further research needs in this field. These include development of:
- dynamic reference models for individual processes;
- new diagnostic tools linking observable process parameters and features with key surface characteristics and properties;
The other important research direction is development of electrical, optical and acoustical methods for process diagnostics and incorporation of corresponding characteristics of into EPP models. This includes frequency response interpretations [128, 129], statistical spectral analysis of electrochemical noise in the voltage and current [130], microdischarge image analysis [131], spectral analyses of optical [93, 116] and acoustic emission [96]. These analyses should lead to identification of informative characteristics and establishment of their correlations with surface properties.
Electromagnetic field problems are starting to attract attention. This includes primary current density distribution in the electrolyser and secondary distribution in the vapour gaseous envelope and the modified layer. These problems are challenging due to the multiscale character of the object and non-linearity of the boundary conditions in the vicinity of the treated surface. This should facilitate electrolyser design, including optimisation of electrode layouts and electrolyte management systems for treatment of components with complex geometries.
Yet another important set of modelling problems whose solution could contribute to the EPP development includes electric processes in power supplies. Dynamic models of electrical process characteristics, i.e. voltage-current diagram and frequency response, should enable design of specialised power supplies which could be stable under such non-linear loads as VGEs and plasma discharges featuring NDR. This could contribute to the design and manufacturing specialised EPP equipment and scaling up various processes.
Ultimately, using this approach to bridge between plasma physics, materials science, electrochemistry, electrical engineering, computational mathematics and computer science would contribute to the development of smart electrolytic plasma technologies capable of addressing key challenges of modern manufacturing.
4. Examples of EPP phenomenological modelling
4.1. Regression neural network modelling
Let us consider an example of phenomenological modelling of EPCS of diffusion aluminide coating from nickel superalloy. Experimental details and resulting surface properties are described elsewhere [31, 69].
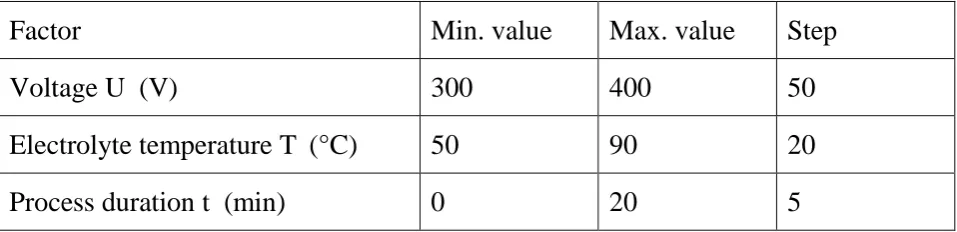
A full-factorial experimental design (Table 2) with a total of 36 physical experiments was implemented. Nine runs were made at all combinations of the voltage and electrolyte temperature with the levels selected (Fig. 17a). According to the model structures shown in Fig. 11, a static regression model was developed in Matlab using a general regression neural network (GRNN) [99]. The network structure and its Matlab representation are shown in Fig. 18a,c. It has 54 neurons in the hidden layer and 2 neurons in the output layer. This network was trained to transform the input vector of variables X=[U; T] and t into the output vector S=[h; Ra], with coefficient of determination R2=0.99, using 54 learning examples derived from the physical experiments. The modelling results shown in Fig. 19 indicate that the solid lines of the model curves stay within the confidence intervals designated by the dashed lines; therefore, the model is adequate. The model is clearly non-linear and the application of conventional regression equations could not succeed in creating an adequate model; however, this is not the case for the neural networks.
network has vector X in the input, and vector S in the output. Time t is included indirectly as the time step ∆t = 1 min. The Matlab representation of the model is depicted in Fig. 18d, which shows that current values of input vector X are passed with zero delays into the hidden layer. The output values of vector S are also fed to the input of the hidden layer with one-step delay. This means that the network calculates its output from current values of voltage and electrolyte temperature, and from the surface properties estimated in the previous time instant. This makes the model dynamic. After optimisation, the network has 20 neurons in the hidden layer and 2 neurons in the output layer.
To train the dynamic neural network model, a numerical experiment with the design shown in Fig. 17b was performed. The model resolution was increased using the numerical experiment containing 289 runs with ∆t = 1 min, which is an 8-fold finer resolution than the physical experiment. This produced a training set with 6069 learning examples. This NARX network was trained using the Levenberg-Marquardt algorithm with performance validation in order to avoid overtraining [99]. The resulting dynamic neural network model has the coefficient of determination R2=0.99, providing the same modelling results as the static model for constant input values as shown in Fig. 19 and in Fig. 20b,c, line 1.
4.2. Frequency response modelling
The frequency response process diagnostics and modelling provide useful tools for the revealing hidden regularities underlying EP phenomena and in-situ estimation of surface properties. Examples of the FR analysis for different substrate materials (Al and Ti), and for different surface macro morphology (dense and porous Al samples) are provided in Figs. 21(a-c).
The coatings were obtained on disk samples with nominal area A=15 cm2 in a conventional alkaline electrolyte with specific conductivity 8 mS·cm–1 in pulsed bipolar mode with the frequency sweep from 20 Hz to 20 kHz at the following voltages: UDC = 225 V; UAC = 305 V. The resultant coating thickness on dense samples was h=20 m. Other experimental details can be found elsewhere [86, 133]. A typical surface morphology is shown in the insets in Fig. 21.
Nyquist and Bode plots in Fig. 21 demonstrate that the impedance of the PEO process in all the cases exhibits resistive-capacitive behaviour (the phase angle is negative). The Nyquist plots show elliptical arcs which differ from conventional semicircle plots for RC circuits [134]. Also, the plots have negative slope at lower frequencies, which can be explained by microdischarge plasma impedance featuring NDR.
the system. Moreover this could be useful to achieve a better understanding of frequency effects that are commonly observed and studied in AC and pulsed current EPPs [56, 76, 135-141], yielding partial and often controversial inferences.
A comparison of the impedance spectra obtained for dense and foam aluminium substrates shows that both Rp and C are higher for the foam. Taking into account that the actual surface for the foam samples is much higher than the nominal area, this ratio can be assessed as a ratio of the capacitances: Adense/Afoam = Cdense/Cfoam 1/5. However, the ratio of Rp for the dense and foam substrates is only ½, indicating
that certain diffusion limitations may occur for the foam inner regions, contributing to the process non-linear scaling behaviour.
Thus the application of FR methodology for EPP diagnostics can reveal the characteristics of surface state in-situ, provided that the correlations between impedance spectra and surface properties are sufficiently well understood. This can be facilitated by coupling electrical FR with other observable characteristics, such as optical and acoustic emission.
4.3. Electric field modelling
Knowledge of electric field distribution in the EPP electrolyser is important for assessment of the treatment uniformity. Despite the fact that almost all voltage drops across either the VGE or the oxide layer, the voltage drop over the electrolyte should not be neglected for EPP of complex shape components. Uneven current density in the electrolyser induced by tank size and shape as well as size, shape and position of the electrodes leads to non-uniform current density distribution at across the component surface, resulting in the differential thickness of the modified layer.
The vector of current density j in the electrolyte is described by a Kirchhoff’s law [142]:
0
divj (6)
Taking into account Ohm’s law
E
j , (7)
where Eis electric field and =4.2 mS cm-1 is the electrolyte conductivity, and the relation with electric potential
grad
E , (8)
the boundary problem can be solved numerically using Laplace equation 0
grad
div , (9)
employing field modelling software utilising the finite elements method, e.g. COMSOL.
For the setup shown in Fig. 22b, the boundary conditions are as follows
=0 for the counter-electrode, (10)
=500 V for the sample, (11)
En=0 for the conductive media boundaries, (12) where index n denotes normal projection of the electric field vector.
Analysis of the electric field and current density distribution in the electrolyte shown in Fig. 22a, by colour filling and contour lines respectively, reveals particularly high current densities at the edges. This edge effect blocks penetration of electric field in the holes which results in a sharp drop of local current densities at about 3 mm from the mouth of the hole.
workpiece and provide estimates of boundary conditions for FR analysis; it should therefore be taken into account during phenomenological modelling.
5. Conclusions
From the review of electrolytic plasma processes and approaches to their modelling the following conclusions can be drawn:
1. Two major EPP types featuring VGE and oxide film formation can be distinguished, with more detailed classification made concerning electrical and technological features of the processes.
2. Models using partial differential equations, existing theories of processes in the surface oxide layer as well as empirical, phenomenological and equivalent circuit approaches have been developed for EPPs. The phenomenological models appear to be the most appropriate for the development of prospective smart electrolytic plasma technologies.
3. A generalised phenomenological model structure has been proposed. The model describes the system ‘power supply – electrolyser – treated surface’ as a system with lumped parameters. This model forms a basis for a deeper EP process understanding and provides a methodology for their modelling, diagnostics and control.
4. As the generic complexity of EPPs does not currently allow the set of differential equations describing the treatments to be solved, the phenomenological model of a particular EPP could be formalised as a black box regression. Within this approach, input and output variables have been analysed and categorised as controllable supply inputs, unobservable surface properties and observable electric, optical and acoustic characteristics. A general algorithm assisting the design of static and dynamic process models for a given EPP has been proposed to formalise the phenomenological model.
magnitude (minutes, seconds and milliseconds) for the unobservable surface properties, integral observable characteristics and instantaneous observable characteristics. It was justified that the discrete model rates should be converted to the range of tens of seconds, for the slower variables by interpolation, and for the faster variables by integration.
6. Since the phenomenological models rely heavily on experimental data, regression modelling and experimental design recommendations have been formulated to optimise the number of experiments required for a particular model.
7. The frequency response approach to diagnostics of unobservable surface properties has been proposed. The approach includes spectral analysis of electrical characteristics, resulting, for example, in impedance spectra of the EP process; the evolution of the spectra is highly correlated with the surface properties; therefore, a framework for the frequency response assessment within the phenomenological approach has been proposed.
8. Electromagnetic field modelling complements the phenomenological approach by providing boundary conditions for the FR estimates in the form of electrolyte resistance, representing the electrolyser impedance at infinite frequency. Moreover, it helps in assessing the treatment non-uniformity for complex shape components.
9. Further research needs concerning phenomenological modelling of EPPs have been discussed. Bridging between plasma physics, materials science, electrochemistry, electrical engineering, computational mathematics and computer science using the phenomenological approach could facilitate development of smart electrolytic plasma technologies.
6. Acknowledgements
Table 1. Evaluation of dynamic properties for various EPPs
Process Variable Variable change rate Time constant (s) V ec to r S lo n g t ime s cal e
EPHT [3] Hardened layer
thickness h 5…50 m min -1
100…500 PEO [1] Coating thickness
h 1…4 m min
-1
EPPo [68] Surface roughness Ra
0.05…0.2 m min-1 EPCS
[31]
Coating thickness
h 1…4 m min
-1 V ec to r C1 sh o rt t ime sca le [ n
] EPHT [3]
Instant current i
0.1…2 A ms-1
10–1… 10–4
PEO [4] 0.1…5 A ms-1
EPPo
[104] 0.2…1 A ms
-1
EPCS
[105] 0.1…2 A ms
-1 V ec to r C2 co m p ro mi se ti m e sca le [ m ]
EPHT [7] Working electrode
temperature e 30…50 °C s -1
10…100 PEO [87] Effective (RMS)
voltage U 2…10 ↑ s
-1
PECS [6] Effective (RMS)
Table 2. Full factorial experimental design
Factor Min. value Max. value Step
Voltage U (V) 300 400 50
Electrolyte temperature T (°C) 50 90 20
Process duration t (min) 0 20 5
Table 3. FR modelling results for different substrates
Substrate Re ( ) Rp ( cm2) C (F·cm–2) r
Al dense
10
75.2 2.7·10–7
8…11
Al foam 132.6 1.3·10–6
[image:38.595.48.549.256.408.2]Fig. 1. Feedback concepts using models: (a) Classical control system with observable output Y; (b) Control system with reference model. The output S is unobservable and the reference model must be dynamic; (c) Control system with diagnostic loop. Output S is unobservable and output C is observable
Feedback block Control system
Control object
–
Ydesired Y
Y
∆Y X
+
(a)
Feedback block
Control system
Control object
–
Sdesired S
S
∆S X
+
Reference model
X
S
(b)
Feedback block
Control system
Control object
–
Sdesired S
S
∆S X
+
Diagnostic model
C
S
a b
[image:40.595.111.485.47.382.2]
c d
Fig. 2. Stages of vapour gaseous envelope evolution: a – oxygen evolution; b – bubble boiling in the VGE; c –microdischarges in the VGE; d – microdischarge treatment of the surface micro profile; 1- working electrode; 2 – electrolyte; 3 –
oxygen (a) and vapour (b) bubbles; 4 – microdischarges [34, 35]
1 2
3
1 2
3
1 2
4
1
a b c d Fig. 3. Side view pictures of aluminium alloy samples at different time of the PEO
Fig. 4. Classification of electrolytic plasma processes
Electrolytic plasma processes
Polarity of the working electrode
Cathode treatments
Anode treatments
Bipolar treatments
Type of metal substrate (anode and bipolar
treatments)
Valve metals (Al, Ti, Mg etc.), having n-type oxide films
Non-valve metals (Fe, Cr, Ni etc.), having p-type oxide films
Type of power supply
Immersion
Spraying
Main process Diffusion and case hardening (anode and cathode treatments)
Oxidation (anode and bipolar treatments)
Polishing (anode treatments)
Surface cleaning and coating stripping
Voltage source
Current source Process arrangement
Main voltage drop Vapour gaseous envelope (cathode and anode treatments)
(a) (d)
(b) (e)
(c) (f)
50 m 10 m
40 m
(a)
[image:45.595.130.457.83.575.2](b)
Fig. 6. Typical arrangements of the equipment used for EP processes in electrolyser (a) [1] and with electrode tool (b) [7]: 1 – window; 2 – mixer; 3 –
connecting wires; 4 – exhaust/ventilation system; 5 – grounded case; 6 – power supply unit; 7 – workpiece; 8 – cooling system; 9 – electrolyser-counter electrode; 10
(a) (b)
Fig. 7. Typical current curve for running EP processes from a voltage source (a) and typical voltage curve for running PEO processes from a current source (b):
1-2 – anodisation; 2-3 – sparking; 3-4 – plasma electrolytic oxidation Time
Curr
e
n
t
Time
V
o
lta
g
e
1 2
46
Fig. 8. Classification of models of EP processes Models of
electrolytic plasma processes
VGE models using partial differential
equations
With respect of electrolyte flow
Using Maxwell’s and heat transfer equations
Using boiling characteristic
Phenomeno-logical models
Model-classification of heating mode
Relationship among processes during plasma electrolysis
Empirical models of operational characteristics
Approximation of voltage transients
Dynamic current-voltage characteristics Theoretical
models of processes in
oxide layer Impedance spectroscopy analysis
Resistive model circuit
Resistive and capacitive model circuit
Nonlinear circuit
Pulsed current-voltage characteristics
Coating thickness, roughness vs. process parameters Evolution of microdischarges in oxide pores
Evolution of microdischarges and crystallisation of oxides
Electrolytic plasma polishing
Electrolytic plasma heating
Plasma electrolytic oxidation
Metal-dielectric-electrolyte system model
47 Fig. 9. Generalised phenomenological model structure
Heat exchange
6. Electric power supply
S u b sy st ems
Current flow contour
1. Working electrode
(metal substrate) 2. Surface layer
3. Vapour gaseous
envelope (VGE) 4. Electrolyte 5. Counter electrode
7. Heat power supply
1. P ro ce ss e s i n t h e sub sy stem s
3.1.3. Processes within VGE 3.1.2. Boiling in the VGE
3.1.2.3. Bubble type 3.1.2.2. Transient type
3.1.2.1. Film type
3.1.4. Plasma processes
1.1.1. Anode electrochemical processes
1.1.2. Cathode electrochemical processes
1.1.1.2. Metal oxidation 2H2O –4 O2 + 4H+
xMe + yO2 MexO2y
1.1.1.1. Anode dissolution Me0–n Men+
2.1.1. Layer formation
2.1.1.1. Formation of oxides
3.1.3.1. Hydrodynamic processes
2.1.2. Plasma processes
2.1.2.1. Microdischarge action
1.1.2.2. Hydrogen release 2H2O + 2 H2 + 2OH–
2H++ 2 H2
1.1.1.3. Anion discharge Ann––n An0
1.1.2.1. Cation discharge Catn+ + n Cat0
2.1.1.3. Hydrogenation
2.1.3. Metallurgical processes
2.1.3.2. Structural and phase transformations
2.1.4. Layer transformation
2.1.4.2. Formation of n-type oxides
2.1.4.4. Stripping of oxides 2.1.4.3. Surface polishing 2.1.4.1. Formation of p-type
oxides 2.1.3.1. Alloying 2.1.1.2. Deposition of
electrolyte particles
3.1.3.2. Crystallisation of chemical compounds
3.1.4.1. Glow discharge with electrolytic cathode
3.1.4.2. Spark discharge with metal cathode
3.1.1. Boundary processes
3.1.1.1. Electrolysis 3.1.1.2. Joule heating 3.1.1.3. Gas excretion 3.1.1.4. Evaporation 2.1.2.2. Electroerosion 1.1.4. Metallurgical processes
1.1.4.1. Structural and phase transformations
1.1.3. Cathode electron processes
1.1.3.1. Emission of electrons
3.1.4.3. Arc discharge with metal cathode
4.1.1. Processes within the electrolyte
4.1.1.1. Ion conductivity (Ann–, Catn+)
5.1.1. Cathode processes
5.1.1.2. Hydrogen release
2H2O + 2 H2 + 2OH–
2H+ + 2 H 2
5.1.1.1. Cation discharge Catn+ + n Cat0
5.1.2. Anode processes
5.1.2.2. Oxygen release 2H2O –4 O2 + 4H+
5.1.2.1. Anode dissolution Me0–n Men+
5.1.2.3. Anion discharge Ann––n An0
4.1.3. Electrolytic cathode processes
4.1.1.2. Heating / cooling
4.1.1.3. Electrolyte mixing
4.1.3.1. Emission of hydrated electrons into plasma
4.1.4. Electrolytic anode processes
4.1.4.1. Electron injection from plasma into electrolyte
4.1.2. Processes on partial electrolytic electrodes
4.1.2.1. Ion emission from boiling electrolyte
4.1.2.3. Current flow over electrolyte bridges 4.1.2.2. Electrolyte pulse
touching the surface
4.1.2.4 Radiolysis of electrolytic electrodes
![Fig. 2. Stages of vapour gaseous envelope evolution: a –bubble boiling in the VGE; c treatment of the surface micro profile; 1- working electrode; 2 oxygen evolution; b – –microdischarges in the VGE; d – microdischarge – electrolyte; 3 – oxygen (a) and vapour (b) bubbles; 4 – microdischarges [34, 35]](https://thumb-us.123doks.com/thumbv2/123dok_us/7902000.188155/40.595.111.485.47.382/evolution-treatment-electrode-evolution-microdischarges-microdischarge-electrolyte-microdischarges.webp)
![Fig. 6. Typical arrangements of the equipment used for EP processes supply unit; 7 in electrolyser (a) [1] and with electrode tool (b) [7]: 1 –connecting wires; 4 window; 2 – mixer; 3 – – exhaust/ventilation system; 5 – grounded case; 6 – power – workpiece; 8 – cooling system; 9 – electrolyser-counter electrode; 10 – insulating plate](https://thumb-us.123doks.com/thumbv2/123dok_us/7902000.188155/45.595.130.457.83.575/arrangements-equipment-processes-electrolyser-connecting-ventilation-electrolyser-insulating.webp)