Ontogenic Resistance in Grapevine
Leaves to Powdery Mildew
by
Angela Maree Merry
Bachelor of Agricultural Science (Hons)
Submitted in fulfilment of the
requirements for the Degree of Doctor of Philosophy
University of Tasmania
Hobart, Tasmania, Australia
2 This thesis contains no material which has been accepted for a degree or diploma in any university or other institution. This thesis, to the best of my knowledge, contains no material previously published or written by another person, except where due acknowledgment is made in the text. This thesis may be available for loan and limited copying in accordance with the Copyright Act of 1968.
3
ABSTRACT
Erysiphe necator causes powdery mildew in species of Vitaceae, including the widely cultivated grapevine Vitis vinifera. This obligate biotroph colonises green, juvenile tissues, which if not protected by fungicides can lead to loss of grape yield and wine quality in many viticultural regions worldwide. The extent of pathogen colonisation varies according to leaf maturity and the term ontogenic resistance has been used to describe leaves that become less susceptible to infection by E. necator as they age.
The effect of environment during shoot growth on the expression of ontogenic resistance was examined by exposing developing shoots of Cabernet sauvignon in the glasshouse to temperatures set at 18°C or 25°C prior to inoculation with E. necator conidia. Powdery mildew severity on leaves, after incubation for 14 days at 25 ± 5°C, initially increased and then decreased as leaves matured beyond a lamina length of 30 mm (leaf position 1) for shoots with an average rate of leaf emergence of 0.54 leaves per day (25oC glasshouse) or 0.23 leaves per day (18oC glasshouse) prior to inoculation. The higher rate of leaf
emergence resulted in a greater proportion of diseased leaves per shoot and a higher disease severity for the modal leaf position expressing maximum severity, which was position 4.4 for plants previously exposed to 25oC and position 3.7 for shoots developing at 18oC. Position 4.4 was similar to the mean modal leaf position of 4.2 for the maximum percentage of conidia that formed secondary hyphae for shoots developing at 25oC. There was a decline in penetration efficiency of E. necator as leaves aged beyond this leaf position. These results confirmed the expression of leaf ontogenic resistance.
4 magnitude of pathogen colonisation were significantly different for plants grown in the two different environments. In contrast, there was no significant difference between
environments for the parameters of the leaf resistance model, suggesting that the pre-inoculation environment affected the nutritional or some other quality of the plant tissue colonised by E. necator rather than having a differential effect on mechanisms of host resistance.
Additional Cabernet sauvignon plants were grown in each pre-conditioning environment and two mature ‘source’ leaves for photosynthates treated with 14C02 for identifying, by autoradiography, the sink or source status of leaves younger than those treated. There was a clear association between the leaf position for maximum severity of powdery mildew and the position of the leaf completing the sink to source transition for shoots exposed to either pre-inoculation environment.
5 nodal position on the cane, indicating the predictive potential of the linear model. Rate of leaf emergence from shoots arising from different nodal positions on the cane were different, with shoots arising from medial nodes having significantly slower leaf emergence rates than both basal and distal shoots. This effect was consistent, occurring at all but one of the experimental sites.
6
ACKNOWLEDGMENTS
The project was funded by a University of Tasmania APA scholarship, Grape and Wine Research and Development Corporation, and the School of Agricultural Science.
I thank my supervisors, Drs Kathy Evans and Steve Wilson for many hours helping with project design, establishment and direction with thesis writing.
I acknowledge Drs Ross Corkrey and Greg Lee’s input and guidance in the statistical analysis, which brought out the best possible results from the collected data.
I’m grateful for staff and owners at Meadowbank, Clarence House, Frogmore Creek and Delamere Vineyards to allow me to conduct field trials.
I also thank the following people; Paul Schupp for technical assistance. Dr Phil Brown for advice on radiolabelling. Leighton Smith for writing a macro in Excel to calculate
7
Table of Contents
Declarations ... 2
Abstract ... 3
Acknowledgments ... 6
Introduction ... 9
Literature Review ... 13
Powdery mildew of grapevine and its economic importance ... 13
Crop Protection ... 14
Life cycle of E. necator ... 16
Conidial Infection ... 17
Epidemiology ... 18
Disease Resistance ... 20
Leaf age-related resistance ... 21
Plant defence against plant pathogens ... 22
Passive or constitutive defences ... 23
Pathogen recognition... 24
Rapid active responses ... 26
Delayed active defences ... 29
Co-ordination of defence responses ... 30
Approach and Study Objectives ... 31
Chapter 1 – Ontogenic resistance in grapevine leaves ... 33
Introduction ... 33
Materials and Methods... 37
Plant material and conditions prior to inoculation ... 37
Inoculation method for assessment of disease severity ... 38
Construction of Bayesian model ... 39
Inoculation method for quantifying early pathogen colonisation ... 42
Statistical estimation of leaf position expressing maximum pathogen infection and maximum severity of powdery mildew ... 43
Results ... 43
Leaf appearance before inoculation ... 43
Disease expression according to leaf position ... 44
Bayesian model for powdery mildew development according to leaf position on a grapevine shoot ... 48
8
Discussion ... 55
Chapter 2 – Maximum powdery mildew infection in leaves coincides with the sink to source transition ... 59
Introduction ... 59
Material and Methods ... 61
Plant material ... 61
Radio-labelling and autoradiography procedure ... 61
Relating lamina length to area ... 62
Data analyses ... 62
Results ... 64
Disscussion ... 68
Chapter 3 - Primary shoot development in Chardonnay and Pinot noir ... 72
Introduction ... 72
Materials and Methods... 75
Study sites and canopy management ... 75
Weather data ... 78
Leaf emergence and shoot growth ... 78
Leaf area estimation ... 79
Data analyses ... 79
Results ... 80
Seasonal conditions ... 80
Leaf emergence as a function of calendar day ... 83
Leaf emergence as a function of thermal time ... 87
Shoot growth as a function of thermal time ... 89
Leaf area development as a function of thermal time ... 90
Discussion ... 91
General Discussion ... 96
Recommendations for Future Research ... 105
INTRODUCTION
The Australian wine industry contributed over $2 000 million, in 2007-08, to the Australian economy with wine exports being the third largest valued agricultural export commodity behind wheat and beef (ABARE, 2008). Wine regions in Australia can be classified by using the mean January temperature (MJT), the warmest month in the southern hemisphere (Prescott 1965; Smart and Dry 1980). These classifications can be used to guide the location of vineyards, select suitable grape varieties and potential wine styles, and to predict harvest dates (Kirk 1986). Regions in Australia defined by MJT are “cold” (≤ 16.9°C), “cool” (17-18.9°C), “warm” (19-20.9°C) or “hot” (21-22.9°C) (Smart and Dry 1980).
Tasmania is considered to be a cold to cool climate for viticulture, which has limited variety selection and methods of pruning and training. With most major commercial development having taken place since the mid 1970’s, the total area planted continues to grow and in 2006 there was a total of 1342 ha, an increase from 459 ha planted in 1997 (Merry and Farquhar 2007). Pinot noir and Chardonnay accounted for 72% of production in 2006, with Sauvignon blanc and Riesling accounting for 17% and the remaining 11% comprising other varieties including Cabernet sauvignon, Merlot, Pinot Gris and Gewürztraminer (Merry and Farquhar 2007). Prior to 2005 almost all wines produced were varietal types suited to still wine production, with sparkling wines tending to be produced from poorly ripened fruit in cool years. Recent years have seen an increase in sparkling wine production from vineyards dedicated to this wine style.
yield as a secondary consideration. Indeed, perceived negative effects of higher yields on wine quality (Farquhar 2003) have led growers to manage to low yield targets, with pruning and training methods plus in-season canopy management concentrating on vine balance, and in the red varieties, fruit exposure for colour and flavour development. As a result of these concerns, most commercial vineyards are cane pruned in spite of the reportedly lower production costs for spur pruning and possibilities for mechanisation. Trellising and training systems cover a wide spectrum from simple vertically positioned shoots from two arms of ten bud canes through to various horizontally or vertically split canopy systems.
The Tasmanian wine region is split into several geographically distinct sub regions with the current study carried out in the south east of the island. Although climate is heavily
dependent on local factors, overall this area is a little cooler than the northern and eastern subregions and is also markedly drier with an average annual rainfall of 498 mm that ranges from 297 to 735 mm. Rainfall is also highly variable between seasons and all vineyards have irrigation available, usually using micro (dripper) systems. Throughout Tasmania and
particularly in this subregion, soils are highly variable (Grose et al. 1999) ranging from deep, well drained fertile river terraces to low fertility duplex soils over saline subsoils. This mix of growing conditions results in highly variable vine vigour both within and between vineyards and uncertainties about irrigation and fertilizer management (Wells et al. 2007). Because of concerns about fruit quality and excessive vine vigour, growers are reluctant to use nitrogen fertilizers, even those on very low fertility soils, and irrigation is often used only in response to severe stress conditions rather than routine maintenance of optimum water availability. Recent studies (Wells et al. 2007) suggest that chronic nitrogen deficiency is widespread in vineyards throughout all the Tasmanian subregions.
yield and affecting wine quality if left uncontrolled (Stummer et al. 2005). Tasmania has never had a mildew management strategy developed specifically for local conditions and disease development is promoted by frequent occurrence of high relative humidity and cloudy days, and ambient temperatures that rarely exceed 25oC (Evans 2005).Effective control of powdery mildew can be achieved with multiple applications of a wide array of fungicides (Hall and Wicks 2008), but in Tasmania, poor spray timing and coverage still lead to control failures (Evans 2005). However, there is a need to reduce fungicidal inputs in line with market demands for low or no fungicide residues in wine by using sustainable
production methods. Protocols for timing fungicides, according to pathogen activity and/or the susceptibility of various grapevine tissues to powdery mildew, are based on general rules rather than accurate models that reliably predict disease risk. For example, growers have tried to modify recommendations applied elsewhere, for example, the 2, 4, 6 rule applied in the Riverland, which is when fungicides are applied 2, 4, and 6 weeks after budburst, is sometimes extended to 3, 6, 9 (weeks after budburst) in Tasmania to account for slow rates of shoot development (Evans 2005). In addition, high rates of sulfur,
commonly 800 to 1,200 g/100 L, are applied to compensate for cool temperatures that can occur at any time (Evans 2005).
LITERATURE REVIEW
In this literature review, powdery mildew is considered in terms of its economic importance and management, pathogen lifecycle and disease epidemiology in order to identify
knowledge gaps about the interaction between vine and disease development. Host-pathogen interactions and the response of the plant to Host-pathogen invasion, with reference to the powdery mildew fungi, are reviewed for development of hypotheses and discussion about leaf ontogenic resistance to powdery mildew. Further review of the literature is presented in the introduction to each of the research chapters.
Whilst the study clearly includes issues around vine growth and development in response to both environmental conditions and management, it is beyond the scope of the present review to cover the wealth of published information on vine physiology and practical management of vegetative and reproductive growth. Such papers rarely make reference to vine biology in relation to disease incidence, control or management, but specific reference is made to some relevant papers in the experimental chapters of the thesis, particularly Chapter 3. Extensive and detailed discussion of environmental and management influences on growth and development are included in standard texts such as Mullins et al (1992) and more recent reviews such as that of Rives (2000) and Vasconcelos et al. (2009). Refereed literature used to develop methods are also discussed in the relevant chapters.
P
OWDERY MILDEW OF GRAPEVINE AND ITS ECONOMIC IMPORTANCELike all modern crops, Vitis vinifera is cultivated in a monoculture that increases its
However, the most economically important disease of grapevine worldwide is powdery mildew (Pearson and Goheen 1990), caused by the ascomycete fungus Erysiphe necator Schw.((Braun and Takamatsu 2000; synonym Uncinula necator). E. necator is a biotroph that infects all green tissues of the vine: leaf blades, petioles, stems, rachises, pedicels, flowers, and immature berries.
Eryisphe necator originated in North America and first appeared in England in 1845 from where it spread rapidly among V. vinifera vines cultivated in Europe (Large 1940). Unlike North American species of Vitis, V. vinifera does not carry any substantial resistance to E. necator (Large 1940) and all varieties of V. vinifera are comparatively susceptible to powdery mildew, which is now prevalent in all regions of the world where V. vinifera vines are cultivated.
Powdery mildew can result in serious losses in grape yield and quality in most years, and total crop loss can occur (Chellemi and Marios 1992; Gadoury et al. 2001; Calonnec et al. 2004; Savocchia et al. 2004; Gadoury et al. 2007). Wine made from Chardonnay grapes with as little as 1-5% of bunches affected by powdery mildew can have altered composition and sensory characteristics (Stummer et al. 2005). In general, there is a low tolerance of infected grapes in the winery meaning that a high level of disease control is required, usually necessitating multiple applications of protective fungicides.
C
ROPP
ROTECTIONThe grape and wine industry is highly dependent on the use of fungicides to manage powdery mildew. The most heavily used fungicides in Australia are sulfur and
fungicides is likely to have a range of beneficial effects. For instance, reduction of fungicide usage has been shown to increase the abundance of fungi on the surface of fruit and foliage (Palmer 2009), including some species that are antagonistic toward plant pathogens (Fravel 1988; Cook 1993; Sutton and Peng 1993). Reduced pesticide flows into depleted water catchments, including fungicides formulated with various other chemicals, might also help maintain water quality (Hounslow 1995). Another benefit of pesticide reduction is to reduce long-distance importation of costly synthetic fungicides that consume significant energy during production and are a major source of carbon dioxide emission (West and Marland 2002; Lal 2004). An additional benefit to the grower is that reduction of spray applications throughout the season will decrease costs associated with labour, fuel and fungicide materials.
Sulfur is generally effective for powdery mildew control and has been used for more than 100 years (Large 1940; Bent 1978). Nevertheless, some viticultural sectors, especially some organic growers, are keen to minimise the use of sulfur because of the potential of sulfur to impact negatively on beneficial arthropods (Calvert and Huffaker 1974) and/or the well-being of some vineyard workers (California Department of Pesticide Regulation 2009). Target-specific fungicides can also be prone to development of pathogen resistance, for example the DMIs (Erickson and Wilcox 1997), thus providing another incentive to minimise their use.
unprotected by fungicide residue. Conversely, application of the subsequent spray might occur when there has been no increase in susceptible leaf area and existing fungicide residues continue to provide an effective cover. In Germany, protective fungicides for downy mildew are timed according to the amount of unprotected leaf area emerged since the last spray (Bleyer et al. 2008), based on models that describe shoot development as a function of thermal time (degree days; Schultz 1992). There is potential to use this information to time fungicides for powdery mildew so that the amount of leaf area that is both highly susceptible to infection and at risk of being infected is minimised.
L
IFE CYCLE OFE.
NECATORErysiphe necator overwinters by production of sexual fruiting structures called cleistothecia that produce asci containing ascospores or as resting mycelia in infected buds (Bulit and Lafon 1978; Pearson and Gärtel 1985; Wicks and Magarey 1985). Infected buds give rise to shoots, termed “flag” shoots, which are often completely whitened due to surface
colonisation by E. necator (Boubals 1961 cited in Pearson and Gärtel 1985). The dominant overwintering fungal structure is related to climate. For example E. necator can overwinter as mycelium in buds in Australia, California and Italy but only as cleistothecia in bark crevices or leaf litter in the cold winter climate of New York and Washington states in the USA (Pearson and Goheen 1990; Cortesi et al. 2004; Grove 2004; Rumbolz and Gubler 2005; Emmett and Magarey 2008).
the next section. Flag shoots produce airborne conidia that disperse the pathogen in the pre-flowering period and they have been observed in Tasmania in October and November (spring in the southern hemisphere). It is notable, however, that the relative importance of primary inoculum from flag shoots or cleistothecia, in Australian vineyards, has never been established. However, flag shoots are thought to be common in most districts of Australia (Magarey 2010).
Conidial Infection
Before infection of the host tissue the spore must adhere to the plant surface. Unlike most other fungi, conidia of the powdery mildew fungi do not require free water for germination and adhesion (Nicholson 1996). Nicholson (1996) suggests that in the barley powdery mildew pathosystem, the conidium exudes a substance to prepare the site for formation of the appressorium prior to infection. It is assumed that appressorial adhesion by E. necator occurs in a manner similar to other powdery mildew–host interactions.
around 5–10 days after infection (Delp 1954). Conidia infect juvenile green tissue of susceptible species readily, with infection efficiency declining as the plant organ ages (Doster and Schnathorst 1985; Gadoury et al. 2003).
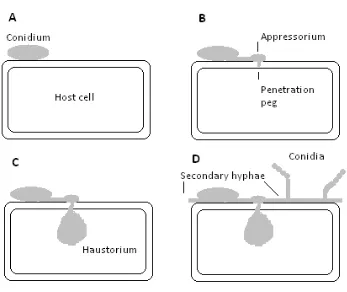
Figure 1. Schematic illustration of the infection process of E. necator (modified from
Hayes 2006). A conidium at the surface of a host cell (A). The conidium has germinated
and has formed an appressorium and penetration peg (B). After the penetration peg has
entered the cell, a haustorium, the feeding structure of the fungus, is formed (C).
Secondary hyphae, which colonise on the surface of host tissue are then formed along
with conidiophores bearing conidia (D). Infections are generally attempted at the
junction of anticlinal walls (D.M. Gadoury, Cornell University, pers. comm.).
E
PIDEMIOLOGYsusceptibility of the host, for example by inducing stress in a plant, and the activity of the pathogen, for example the temperature for fungal growth. The environment can also be changed by the plant and production system. For example, a dense plant canopy on irrigated vines can provide higher humidity and lower leaf surface temperatures than a more open canopy. The influence of the various factors that affect development of powdery mildew can be modeled by quantifying disease progression in time and space in relation to known environmental influences.
There are two separate but closely related epidemics of powdery mildew occurring on grapevines: one occurs on leaves and the other on bunches. Figure 2 shows the progression of a powdery mildew epidemic in Chardonnay vines grown commercially in southern Tasmania (Evans et al. 2005). The frequency and spatial distribution of diseased leaves at flowering has been related to the severity and spatial distribution of powdery mildew on bunches at bunch closure (Calonnec et al. 2006). E. necator can colonise green floral pedicels and caps (calyptrae) and will infect the developing fruit from these inoculum sources at a high frequency during early fruit set (Gadoury et al. 2003). The leaf epidemic influences the amount of inoculum available for infection of highly susceptible flowers and immature fruit (Calonnec et al. 2008). The status of the leaf epidemic at flowering depends on when primary infection occurred (Calonnec et al. 2008) and the proportion of the leaves in the canopy that were highly susceptible during each infection event. A greater
Figure 2. Progression of powdery mildew in small plots of Chardonnay vines that were not
treated with fungicide until pea-sized berries. Each point is the mean for six plots.
Frogmore Creek vineyard, Coal River Valley, 2004/05 (reproduced from Evans et al. 2005).
Knowledge of the location of epidemics in time can aid decision about when to apply crop protection according to pathogen activity. Plant disease epidemics can be predicted from host and environmental conditions, although there is currently no working model for grapevine powdery mildew. A temperature-based decision rule called the Gubler-Thomas (G-T) index (Gubler et al. 1999) has been evaluated in Tasmania where it was found that severe epidemics of powdery mildew occurred in growing seasons when the threshold G-T index was never reached (Evans 2005). Accurate models that underpin decisions about timing fungicides strategically are required if strategic spray applications are to be developed.
D
ISEASER
ESISTANCEResistance is the extent to which a plant can withstand, oppose, lessen, or overcome the
0 10 20 30 40 50 60 70 80 90 100 3 0 -N o v 7 -D e c 1 4 -D e c 2 1 -D e c 2 8 -D e c 4 -J a n 1 1 -J a n 1 8 -J a n 2 5 -J a n 1 -F e b 8 -F e b
Incidence - leaves (abaxial) Incidence - clusters Severity - clusters
M e an (% )
0 -1 0% 8 0-100 % 4-7 m m > 7 mm
pre-veraiso n ca ps off:
applic ation of s ulfur
attack of a pathogen, whereas susceptibility is the extent to which the plant cannot overcome pathogen attack (Kud 1966). Heath (1996) described six types of disease resistance exhibited by higher plants: parasite-specific, cultivar-specific, nonhost, organ-specific, induced resistance, or age-related. Resistance can be expressed at many stages in the infection process, from inhibition of propagule germination and penetration, to the restriction of colony development after the pathogen has become established.
Leaf age-related resistance
The susceptibility of whole plants or plant organs to disease can change as they age (Agrios 2005). Age-related, or ontogenic, disease resistance has been reported for interactions of perennial hosts with obligate pathogens, such as Phragmidium violacuem on blackberries (Evans and Bruzzese 2003), Phragmidium rubi-idaei on raspberries (Anthony et al. 1985), Hemileia vastatrix on coffee (Coutinho et al. 1994), Melampsora larici-populina on Populus species (Sharma et al. 1980) and Podosphaera clandestina on cherries (Olmstead et al. 2000). Ontogenic resistance can lead to a major reduction in disease severity and may lead to total escape from infection (Ficke et al. 2002).
Ontogenic resistance in grapevine leaves is expressed toward two biotrophic pathogens: downy mildew (Reuveni 1998, Kennelly et al. 2005) and powdery mildew (Doster and Schnathorst 1985; Singh and Munshi 1993). Doster and Schnathorst (1985) found a gradient in powdery mildew development on grapevine shoots. The older leaves had smaller and fewer colonies compared with younger leaves and there was an inverse
formation were not affected by berry age, successful formation of the penetration peg and development of secondary hyphae were not observed on older berries (Ficke et al. 2003). Whether or not pathogen invasion is halted at the same time during penetration for ontogenically resistant leaves remains to be tested.
Observations of leaf ontogenic resistance in V. vinifera and a range of other woody plants suggest aging leaves have one or more mechanisms to inhibit disease development. These may include cell wall and cuticle thickness, nutrient availability in the leaves, and the
activity of certain enzymes, such as PR proteins and products of lignin biosynthesis (Reuveni, 1998; Singh and Munshi, 1993). Reuveni (1998) investigated one of these mechanisms further in grapevine and found that leaf ontogenic resistance was associated with the activity of peroxidase and β-1,3-glucanases. Similarly, Giannakis et al. (1998) detected an increase in β-1,3-glucanases as well as another PR protein, chitinase, as leaves aged. Accumulation of stilbenes in grape leaves (Schnee et al. 2008) and phenolics in grape berries (Ficke et al. 2002) have been associated with susceptible tissue, so may also be implicated in ontogenic resistance. However the mechanism/s leading to leaf ontogenic resistance in leaves of woody perennial plants remains unknown. Gee et al. (2008) recently screened a range of Vitis species for berry ontogenic resistance finding one genotype which failed to develop ontogenic resistance. This offers the possibility of undertaking genetic studies to investigate the inheritance and molecular basis of this powdery mildew
resistance character (Dry et al. 2010), which may also elucidate the mechanisms involved in berry ontogenic resistance (Gee et al. 2008).
P
LANT DEFENCE AGAINST PLANT PATHOGENSregulated through a complex and interconnectednetwork of signalling pathways that mainly involve three molecules:salicylic acid (SA), jasmonic acid (JA), and ethylene (ET). The compounds associated with these mechanisms are summarised in Table 1. For a biotroph such as E. necator to infect successfully, it must establish a basic compatibility with its host. Incompatibility between a host and a pathogen results in the recognition of the pathogen and activation of defence mechanisms, while compatibility results in infection (Flor 1971).
Table 1. Putative defence compounds/systems for disease resistance in plants (from Kud,
2001).
Passive and/or wound responses
Waxes, cutin, phenolic glycosides, phenols, quinones, steroid glycoalkaloids, suberin, terpenoids and proteins (thionins)
Induced after infection
Phytoalexins, reactive oxygen species/free radicals, calcium, silicon/silicates,
polyphenoloxidases, peroxidases, phenolics cross-linked cell wall polymers, hydroxyproline and glycine-rich gycoproteins, thionins, antimicrobial proteins and peptides, chitinases, β-1,3-glucanases, ribonucleases, proteases, callose, lignin, lipoxygenases and phospholipases
Passive or constitutive defences
The first line of plant defence to pathogen invasion is passive or constitutive defences such as physical and/or chemical barriers.
Physical barriers
The cuticle, stomata and cell wall are the first barriers to infection for an invading
organised barrier around the cell and prevents invasion by all microorganisms except those that can overcome this chemical and physical barrier (Vian et al. 1996). For pathogens that infect through direct penetration, such as E. necator, the thickness of the cuticle can affect the success with which a pathogen invades a host (Martin 1964), though Ficke et al. (2004) found cuticle thickness not to be a factor in ontogenic resistance in grape berries.
Chemical barriers
Many plants use secondary metabolites as pre-formed antimicrobial compounds. These “phytoanticipins,” the name suggested by Mansfield (1999), are low-molecular weight antimicrobial compounds that are produced constitutively in anticipation of a pathogen encounter and may allow a plant to slow pathogen invasion while other, slower defensive strategies are induced in response to invasion. Phytoanticipins are similar to phytoalexins, described below, and can be the same compounds but are produced constitutively in the plant, not in response to pathogen invasion.
Pathogen recognition
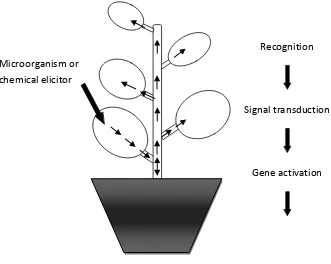
Figure 3. The process of systemic acquired resistance (SAR). The plant first recognises a
foreign agent, which causes signal transduction, gene activation and then a series of
defence responses. Once these defence responses are activated the plant is then in a
“primed state”.
A wide range of agents have been reported to induce resistance (Kud, 2001). Abiotic factors which induce a stressresponse in exposed tissues, such as heavy metals or UV light, can also induce resistance to infection (Chappell and Hahlbrok 1984). For example, Yildirim et al. (2002) found that KH2PO4 applied to leaves induced resistance in grapevine bunches against powdery mildew. Biotic elicitors include cell wall fragments released from fungi and bacteria, hydrolytic enzymes of plant or pathogen origin, some peptides, glycoproteins and polyunsaturated fatty acids. For instance chitosan, a chitin derivative formed from
components of arthropod exoskeletons by deacetylation has been shown to induce a defence response in grapevine against B. cinerea (Barka et al. 2004; Compant et al. 2005).
Often, elicitors are non-specific and simply alert the plant cell that it has been damaged in Recognition
Signal transduction
Gene activation
Defence responses
“Primed state” Microorganism or
some way. However, there are also specific elicitors that enable pathogen-specific defence, which is conditioned by avirulence and resistance genes in a gene-for-gene relationship (Flor 1971). The interaction of gene transcripts of the pathogen and host initiates a signal transduction cascade that activates an array of defence responses (Hammond-Kosack and Jones 1996). This type of resistance is expressed in a wild north American grapevine species, Muscadinia rotundifolia, which has been shown to be resistant to a number of economically important diseases of grapevine, including E. necator (Olmo 1986). The resistance to E. necator in M. rotundifolia has been found to be controlled by a single, dominant gene termed Run1 (Resistance to Uncinula necator 1; Bouquet 1986; Pauquet et al. 2001). Currently, a map-based cloning approach is being used to isolate Run1 (Barker et al. 2005) and to examine the potential for introducing it to V. vinifera cultivars to try and introduce significant and durable resistance (Dry et al. 2010).
Rapid active responses
There are an array of cellular defence responses and metabolic changes in a plant cell in response to recognition of the pathogen. These mechanisms may or may not act in a coordinated manner. The success of active resistance depends on both the rapidity and the intensity of the plant response to infection.
Cell wall modifications
Several types of reinforcement are produced by host cells. The first step in cell wall modification is the increased acetylation of cell wall polysaccharides, which is catalysed instantly (Matern and Grimmig 1994). Peroxidases are the main enzyme involved in cell wall modifications; they catalyze the suberization and lignification of cell walls (Dixon and Harrison 1990). Lignification and suberisation of tissues progresses gradually and this type of defence takes several days (Matern and Grimmig 1994). The deposits of lignin may be highly localised and block the movement of hyphae into the cell or the whole cell may become lignified and trap the pathogen (Hammerschmidt and Nicholson 1999).
Cell wall reinforcement tends to occur to a greater extent and form more rapidly in resistant hosts than in susceptible hosts. Moreover, inhibition of the production of callose or lignin synthesis by the pathogen enhances its penetration efficiency. Deposits between the plant plasma membrane and cell wall are referred to as papillae. Papillae are deposits directly below the point of attempted penetration and are made of callose, silicon, lignin and proteins (Aist 1976). In a subsequent paper, Aist and Israel (1977) suggested that the effectiveness of papillae, a physical and/or chemical barrier to fungal invasion, depends on the time of formation. Ficke et al. (2004) found papillae to be formed in grape berries after unsuccessful attempts at infection, and to a greater degree in susceptible tissue. Whether papillae are involved in ontogenic resistance in grape leaves remains to be investigated.
At the membrane
such as hydrogen peroxide (H2O2), the hydroxyl radical (-OH) and the superoxide anion (O2-) termed the “oxidative burst” (Hammerschmidt and Nicholson, 1999). This oxidative burst can coordinate an assorted set of defence responses in plants (Aziz et al., 2004): it triggers signals that affect gene expression (Lamb and Dixon 1997), strengthen plant cell walls through crosslinking reactions (Thordal-Christensen et al. 1997) and it also initiates later defence responses (Hammerschmidt and Nicholson, 1999). The reactive oxygen species at the site of infection are also produced in quantities capable of killing micro-organisms directly (Apostol et al. 1989; Legendre et al. 1993; Walters 2003; Custers et al. 2004).
The hypersensitive response
The hypersensitive response is a programmed, localised and rapid cell death of one or a few host plant cells in response to invasion by a pathogen (Hammerschmidt and Nicholson 1999). The response can be very effective against obligate parasites, as they require living host cells for nutrition (Hammerschmidt and Nicholson, 1999). This programmed cell death is triggered by cell membrane responses discussed above.
Phytoalexins
Phytoalexins are low molecular weight secondary metabolites synthesised in response to infection and physiological stress by most flowering plants (Hammerschmidt 1999). When produced in high enough concentrations, many have the capacity to inhibit or slow the advance of fungal hyphae (Creasy, 1999). However as Kud (1994) indicated, the extent to which phytoalexins determine resistance is obscured by many other contributing factors.
and pathogen give rise to the rapid de novo synthesis and accumulation of these
compounds. These authors reported a specific response of cells of resistant sorghum plants to incompatible fungi which involved production of small inclusion bodies near the site of synthesis of the phytoalexins. These inclusion bodies then migrated into the infecting hyphae where phytoalexin concentrations in these cells surpassed what was required to kill the pathogen in vitro. These events did not occur in susceptible host-pathogen interactions.
Stilbenes are phytoalexins considered fungitoxic and are synthesised both in the leaves and berries and can be induced by methyl jasmonate (Larronde et al. 2003) and other biotic and abiotic stimuli (Pezet et al. 1991). The capacity, intensity and rapidity of grapevines to produce stilbenes has been proposed to be indicators of the plant’s resistance to fungal infection (Pezet et al. 1991) and they have been shown to be fungitoxic against grape pathogens causing botrytis bunch rot (Botrytis cinerea) and downy mildew (Plasmopara viticola) (Langcake and Pryce 1976). In grapevines, the most studied stilbene-type compound is resveratrol. Viniferins, which are dimers of resveratrol (Pezet et al. 2004), have been shown to be a reliable marker for resistance to powdery mildew and for assessing the defence potential of grapevine cultivars (Schnee et al. 2008).
Delayed active defences
Delayed active defenses include further containment of the pathogen, wound repair, expression of pathogenesis-related proteins and systemic acquired resistance. These mechanisms restrict the spread of the pathogen after infection is established and contain the damage to cells infected.
Pathogenesis-Related (PR) proteins
Nicholson 1999). PR proteins were first described in the leaves of tobacco plants following infection with tobacco mosaic virus (Van Loon and Van Kammen 1970). PR proteins might also play a role in growth and development as they are sometimes present at low levels constitutively (Giannakis et al. 1998). For instance the thaumitin-like PR proteins and chitinases are present in increasing levels in healthy grape berries from veraison onwards (Pocock et al. 2000).
Accumulation of PR proteins has been reported in grapevine leaves and berries in response to infection by the causal agents of powdery and downy mildew (Bézier et al. 2002; Ficke et al. 2004), although no specific relationships with ontogenic resistance have been reported. Grapevine tissues having constitutively expressed PR genes might be more resistant to pathogen attack (Jacobs et al. 1999). Giannankis et al. (1998) found that grapevine
genotypes with high constitutive levels of these enzymes always had a low resistance rating to powdery mildew. Also, there was an increase in the level of these enzymes after
wounding or infection with powdery mildew. The PR proteins found in grapevine, β-1,3-glucanases and chitinases, have been reported to have direct antimicrobial activity in vitro by degrading cell wall components (Bézier et al. 2002; Baysal et al. 2003; Hofgaard et al. 2005).
Co-ordination of defence responses
A
PPROACH ANDS
TUDYO
BJECTIVESErysiphe necator is the casual organism of grapevine powdery mildew, a serious
disease which left uncontrolled can affect grape production and wine quality. The asexual (conidial) stage of E. necator does not require free water for infection, growth and
reproduction, which means that powdery mildew can occur in Tasmanian vineyards every year, even when precipitation is very low. The recommended method of controlling
grapevine powdery mildew is multiple, calendar-based applications of protective fungicides throughout the growing season; however, this does not take into account variation in the expression of ontogenic resistance that is inherent in a proportion of grape leaves. Interactions between woody plant species and biotrophic fungi were reviewed in order to describe how whole plants or plant organs of varieties of V. vinifera and other Vitis species resist these pathogens. From the review there appears to be scope to manipulate the timing of spray applications by taking into account the heterogeneity of foliage and fruit susceptibility to disease development. Consequently, the overall objective of this project was to quantify leaf ontogenic resistance in relation to shoot growth and leaf development and environmental factors that influence leaf development and hence ontogenic resistance. Such knowledge may aid assessment of the proportion of all leaves on a grapevine shoot that are susceptible to infection by E. necator and how that proportion varies during the growing season (Calonnec et al. 2008). Knowing what environmental or vine factors influence the relative severity of powdery mildew on a leaf and the capacity of that leaf to respond to novel control methods, such as elicitors of induced disease resistance, will allow for more targeted management of powdery mildew.
plant and pathogen (Evans et al. 1996).
CHAPTER 1 – ONTOGENIC RESISTANCE IN GRAPEVINE LEAVES
I
NTRODUCTIONErysiphe necator is a biotrophic fungus that causes powdery mildew when it colonises green tissues of members of Vitaceae (Bulit and Lafron 1978), including the widely cultivated grapevine, Vitis vinifera. The fungus penetrates the host epidermis directly and forms a haustorium that derives nutrients from a functioning plant cell to support growth of epiphytic hyphae and reproductive structures (Struck and Mendgen 1998). According to Hawksworth et al. (1995), resistance is “the power of an organism to overcome, completely or in some degree, the effect of the pathogen or other damaging factor”. Six types of disease resistance exhibited by higher plants were defined by Heath (1996): parasite-specific, cultivar-parasite-specific, nonhost, organ-parasite-specific, induced, or age-related resistance. This last type of resistance, also called ontogenic resistance, refers to the condition whereby whole plants or plant organs become more resistant to pathogen colonisation as they age, relative to the plant or organ age when colonisation is at its maximum level (Heath 1996).
although the cause of this phenomenon was not investigated. Differences in fungal development according to leaf position on a plant shoot have also been observed for the biotrophic rust fungi Uromyces phaseoli infecting French beans (Phaseolus vulgaris, Heath 1981) and Hemileia vastatrix infecting Coffea spp. (Coutinho et al. 1994).
Very little is known about the mechanism/s of leaf ontogenic resistance, which might be expressed pre- or post fungal penetration of host tissue. If ontogenic resistance is
expressed post penetration, then further colonisation of the plant tissue might be inhibited by induction of a defence response (Kud 1982) and/or the tissue becomes less susceptible to subsequent infection by the same pathogen (Ficke et al. 2002). In the downy mildew-grapevine pathosystem, leaf ontogenic resistance was correlated positively with increases in peroxidase and β-1, 3-glucanase activities (Reuveni 1998). These enzymes may be made in advance of, or in response to, pathogen invasion. Enhanced peroxidase activity is a marker for leaf senescence (Thomas and Stoddart 1980; Takahama et al. 1999) and enzymes associated with leaf senescence may also be involved in plant defence
mechanisms against pathogens (Lamb and Dixon 1997). Therefore, it would be difficult to separate biochemical effects that relate both to leaf senescence and pathogen defence. Another approach is to understand ontogenic resistance in grapevine leaves as the
proportion of all leaves on a grapevine that are highly susceptible to infection by E. necator varies during the growing season (Calonnec et al. 2008). Understanding and predicting which leaves develop the most powdery mildew could aid decisions about disease management.
between powdery mildew severity and leaf position precisely, under conditions that are optimum and sub-optimum for growth of V. vinifera prior to inoculation with E. necator and incubation conditions that promote optimum fungal development. The optimum
temperature for E. necator growth and reproduction is around 25°C (Delp 1954; Chellemi and Marois 1991), while the optimum temperature for grapevine growth is 25°C (Winkler 1970; Jackson 2008). Temperature not only affects the growth of the pathogen and the host but also how the plant reacts to the pathogen. When plants are exposed to high or low temperature before inoculation, their susceptibility to several pathogens may be increased or decreased (Yarwood 1959). For instance, treatment of plants with short heat pulses (Stermer and Hammerschmidt 1987; Abbattista Gentile et al. 1988; Vallelian-Bindschedler et al. 1998) or cold hardening (Gaudet and Chen 1987; Ergon and Tronsmo 2006; Moyer et al. 2009) can lead to induced resistance against a range of pathogenic fungi. The majority of temperature stress studies are performed under controlled conditions using constant temperature and these conditions do not reflect the variable conditions that occur in the field. Nevertheless, these studies show how environmental conditions can act directly on plant tissue to alter its susceptibility to infection by fungal pathogens.
problems with limited application by specialists in the field of biometrics. Since the 1990s, applications have expanded due to an increase in computational capacity that has made more practical the complex mathematical calculations required. In addition, the availability of Markov Chain Monte Carlo (MCMC) methods has greatly simplified the computation of ‘posteriors’ compared to the corresponding classical tools (Brooks 1998). Consequently, the use of Bayesian statistics in plant pathology has become more common in recent years (Mila and Michailides 2006). The Bayesian approach includes prior information within the model in addition to biological data derived empirically. This approach allows models to be more easily selected, since there is less need to have models which require the calculation of frequencies to determine probabilities (Rubin 1984). Additionally, the Bayesian approach allows the calculation of the probability of any number of hypotheses, based on the
posterior distribution, whereas the classical approach of multiple hypothesis testing is more complex (Berger 1993).
identify any changes in fungal development associated with infection that varied according to leaf position.
M
ATERIALS ANDM
ETHODSPlant material and conditions prior to inoculation
Own rooted grapevines (Vitis vinifera L.) cv Cabernet sauvignon, clone Q390-05, were grown in 15 cm-diameter pots in a glasshouse with a 16 h day length supplemented by 400 W mercury halide lights. Dormant vine cuttings were obtained from South Australian Vine Improvement Inc. (SAVII), rooted in moistened vermiculite above a heated bed and pruned to one bud at the time of planting and grown until there were approximately 20 nodes. Developing inflorescences were removed as soon as they became visible. Two separate experiments were carried out to obtain vines with different rates of leaf emergence. Ten plants were grown at 25°C (± 5°C) and then the experiment was repeated in the same glasshouse except that eight plants were grown at 18°C (± 8°C). These two preconditioning environments were intended to produce relatively fast (near optimum) or slow (sub-optimum) rates of leaf emergence at the time of inoculation. Throughout the pre-treatment period, shoots were maintained free from powdery mildew using vapours of penconazole (Topas®, Syngenta Crop Protection Pty Ltd) as described by Szkolnik (1983).
whether or not the means for leaf lamina length of fully expanded leaves, number of leaves emerged per day or emerged per unit of thermal time for each pre-treatment environment were significantly different.
Inoculation method for assessment of disease severity
Topas® was removed from the glasshouse 7 days prior to inoculation with E. necator. Immediately before inoculation the glasshouse was re-set to 25°C for the plants pre-treated at 18°C. Leaves were numbered at the time of inoculation according to position from the apex, starting from leaf position 1 for the first leaf with a lamina length ≥ 30 mm, and then 2, 3, etc, for older leaves. Leaves at leaf position 0-2, 3-5 or ≥ 6 were classed as immature, expanding or mature, respectively, indicating that leaves in each category had expanded to approximately <50%, 50 to 90% and >90%, of their mature size.
Erysiphe necator was collected, as a bulk isolate, from a vineyard in southern Tasmania (42°48’33”S, 147°25’37”E) and cultured on detached leaves of cv. Cabernet sauvignon as described by Evans et al. (1996). Conidia were shaken off leaves of 12-day old cultures into distilled water containing 0.05% Tween 20. The conidial suspension was adjusted to
approximately 105 conidia per ml water with the aid of a hemacytometer and applied to the adaxial side of all leaves using a hand held atomizer (Preval sprayer power unit, Precision Valve Corporation), according to the method of Gadoury et al. (2001). Leaves were dried of visible moisture with a domestic fan immediately after inoculation. After 14 days, disease severity per leaf, defined as percentage of leaf area colonised by E. necator, was
Construction of Bayesian model
Independent mathematical models of two biological processes were constructed to describe powdery mildew severity on individual grapevine leaves at different positions on the shoot. The processes modelled were pathogen growth and leaf resistance to powdery mildew. Pathogen growth was modelled as a hypothetical situation where the plant organ does not resist pathogen infection. A logistic growth response was assumed whereby the area of leaf colonised by E. necator increased exponentially with time, before reaching a maximum rate of colonisation after which the rate slowed in proportion to the declining leaf area and nutrients available for colonisation. The leaf resistance model described the reaction of a leaf to suppress pathogen colonisation, according to leaf position. Again, it was assumed that the rate of suppression of pathogen colonisation increased to a maximum level with increasing leaf position, after which this rate declined until
macroscopic signs of the pathogen were no longer visible. This model was based on the inverse-logistic model developed by Gomez (2005) for the blackberry rust pathogen, Phragmidium violaceum. These concepts were provided to R. Corkrey, University of Tasmania, who expressed them mathematically and conducted the Bayesian analysis in consultation with A. Merry. The equations and Bayesian analysis are described below.
Pathogen growth model
The proportion of leaf area covered by powdery mildew was estimated by the logistic model:
ajp = 1/(1+ exp (βj– γj p)) (1)
where ajp was the proportional area colonised by mildew on leaf position (p) on plant (j),
and γj and βj were constants to be estimated. The leaf position was the ordinal series p =
1,2,…pj in which p = 1 had a lamina length ≥ 30 mm and the length of the series could differ
position. The constant γj was an indicator of the rate of colonisation and βj indicated the
magnitude of colonisation.
Leaf resistance model
Leaf resistance to powdery mildew was estimated as:
sjp = 1 – (1 – exp(–pδj)) εj (2)
where sjp was the disease resistance for leaf position p on plant j, and δj and εj were
constants to be estimated. In this model, the magnitude of sjp declined as the leaf position,
p as defined for equation (1), increased, meaning that resistance increased as leaves aged. The conditions δj > 0 and εj> 0 were imposed to ensure that the sjp declined with leaf
position and that sjp was positive. The constant δj indicated the rapidity of the disease
resistance response with increasing leaf position and εj indicated the position at which
leaves expressed an equivalent level of disease resistance.
Overall model
Growth of E. necator, as measured by disease severity, was described stochastically using the Normal distribution in which the mean was given by the product of the two models:
mjp ~ N(ajp x sjp, τm) (3)
where τm was the reciprocal variance or precision.
In Bayesian analysis, parameters are treated as if they were random variables with
probability distributions (Gelman et al. 1996). There are three key components associated with parameter estimation: prior distribution, likelihood function, and posterior
distribution. The adjectives ‘prior’ and ‘posterior’ are relative terms relating to the observed data (Winkler 1972). ‘Priors’ were specific to the parameters βj, γj, εj, δj, and τm.
(Gelman et al. 1996). The parameters were grouped according to the component of the model in which they appeared. The ‘priors’ used and their associated parameters are summarised in Table 1.1.
Table 1.1 ‘Priors’ used in model construction and respective distributions. Hierarchical
‘priors’ were used to allow for variation between plants. N refers to the normal
distribution and Ga represents the Gamma distribution (Gelman et al. 1996).
Model Prior Distribution
Pathogen growth βj N (β*i, τβ)
γj N (exp(γ*i), τγ)
β*I and γ*i N(0, 0.01)
τβi and τγi Ga(0.01, 0.01)
Leaf resistance δj N(exp(δ*i), τδ)
εj N(exp(ε*i), τε)
δ*I and ε*i N(0, 0.01)
τδi and τεi Ga(0.01, 0.01)
Overall τm Ga(0.01, 0.01)
of Tasmania. The model was run for 100,000 iterations. The sample may not be
representative of the probability distribution, and, to address this problem, a number of the parameters resulting from the first iterations were discarded in a process called a ‘burn-in’ (Jensen 2001). A 50% burn-in was used to ensure the model distributions converged, to reach the desired target distribution of x. Sensitivity studies and standard diagnostic techniques were used (Brooks and Roberts, 1998) to assess model validity.
Inoculation method for quantifying early pathogen colonisation
The relationship between leaf position and the percentage of germinated conidia and the percentage of conidia with secondary hyphae was examined using light microscopy. Ten plants were grown at the 25°C environment from own-rooted vines as described for the experiment where the macroscopic colonisation by E. necator was assessed. Conidia of E. necator were multiplied as described above and transferred to the adaxial side of each leaf along the shoot using an artists’ paint brush. Plants were then maintained in the
glasshouse at 25°C as described previously. After 72 h, a 2 x 4 cm section of leaf was cut adjacent to the basal end of the midvein of each leaf. Sections were cleared in 3:1 ethanol: glacial acetic acid for 48 h, softened in lactoglycerol for 24 h and stained with lactoglycerol with 0.1% trypan blue for 48 h, according to a method modified from Carver and Ingerson-Morris (1989). Sections were examined at 400X magnification and the first 40 conidia observed per section were designated into three classes: ungerminated, germinated with a primary germ tube but no secondary hyphae, or germinated with secondary hyphae. The presence of one or more secondary hyphae per germinated conidium was used to indicate that infection had proceeded to penetration of the leaf cuticle and formation of haustoria (Ficke et al. 2003). For each plant and leaf position, the overall germination, the
Statistical estimation of leaf position expressing maximum pathogen infection and
maximum severity of powdery mildew
Nadaraya-Watson kernel regression (Nadaraya 1964; Watson 1964) was used to smooth the relationship between leaf position of each shoot and powdery mildew severity or percentage of conidia with secondary hyphae. A bootstrap approach (Efron and Tibshirani 1998) was used to identify the leaf positions at which disease severity or percentage of conidia with secondary hyphae was highest; that is, the leaf position mode. Each data set was bootstrapped 1000 times using the sample function in the R software package and then the mode calculated by the hrm function (Poncet 2009) also in the R software package (R Development Core Team 2009). A t test was used to identify any difference between the mean mode for the leaf position for maximum disease severity and leaf position for maximum pathogen infection, as estimated by conidia with secondary hyphae.
R
ESULTSLeaf appearance before inoculation
pre-treatment environments. Mean lamina lengths were 91 mm (sd =11) and 88 mm (sd = 8), for the 18oC and 25oC glasshouses respectively.
Table 1.2. The mean number of leaves emerged per day and mean number of leaves
emerged per unit of thermal time (degree (°C) day) for shoots of individual plants grown
in different environments prior to inoculation.
Mean number of leaves emerged Average
pre-inoculation temperature (oC)
Per day Per degree (°C) day
18 0.23 0.034
25 0.54 0.035
P value <0.001 ns
Disease expression according to leaf position
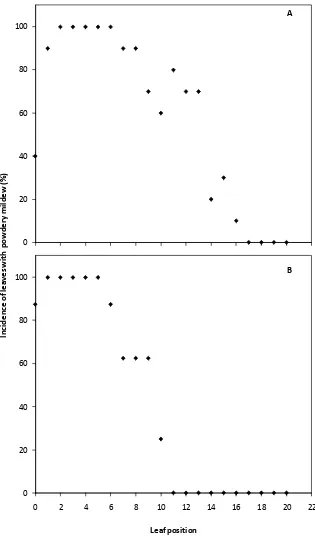
Figure 1.1. The effect of leaf position on shoots of glasshouse-grown Cabernet sauvignon
vines on incidence of powdery mildew 14 days after the determination of leaf position
and inoculation of the adaxial surface of each leaf with 105 E. necator conidia per ml. Leaf
position increases with increasing leaf maturity. Plants grown at an average of 25°C (A) or
18°C (B) prior to inoculation.
0 20 40 60 80 100
0 2 4 6 8 10 12 14 16 18 20 22
0 20 40 60 80 100
0 2 4 6 8 10 12 14 16 18 20 22
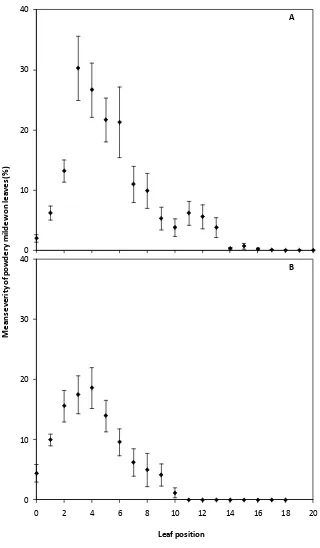
Figure 1.2. The effect of leaf position on shoots of glasshouse-grown Cabernet sauvignon
vines on mean severity of powdery mildew 14 days after the determination of leaf
position and inoculation of the adaxial surface of each leaf with 105 E. necator conidia per
ml. Leaf position increases with increasing leaf maturity. Plants grown at an average of
25°C (A) or 18°C (B) prior to inoculation. The error bars represent standard error of the
mean. 0 10 20 30 40
0 2 4 6 8 10 12 14 16 18 20
A 0 10 20 30 40
0 2 4 6 8 10 12 14 16 18 20
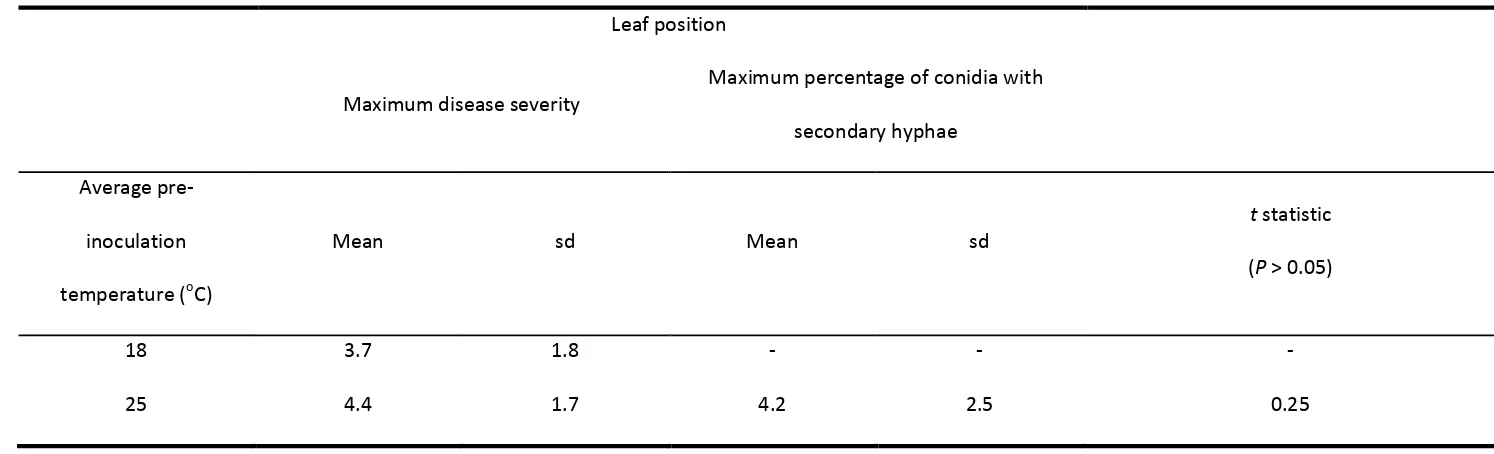
Table 1.3. The mean and standard deviation (sd) for leaf position of maximum powdery mildew severity for plants grown at an average of 18 or 25oC prior to
inoculation, and the mean and sd for leaf position of maximum percentage of germinated E. necator conidia with secondary hyphae for plants grown at an
average of 25°C prior to inoculation. Means within columns for maximum disease severity are not significantly different at P = 0.05.
Leaf position
Maximum disease severity
Maximum percentage of conidia with secondary hyphae
Average pre-inoculation temperature (oC)
Mean sd Mean sd
t statistic (P > 0.05)
18 3.7 1.8 - - -
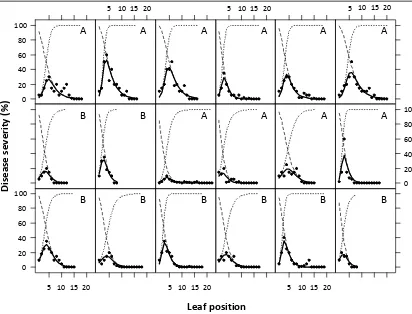
Bayesian model for powdery mildew development according to leaf position on a
grapevine shoot
The overall Bayesian model was a good fit for the data for all plants (Figure 1.3). The means of parameters for posterior distributions for both the pathogen growth and leaf resistance models were examined to see if they varied according to pre-inoculation environment (Table 1.4). The magnitude of initial colonisation and the rate of colonisation, indicated by βj and γj respectively in the pathogen growth model, were both greater on vines with a
faster rate of leaf emergence before inoculation (Table 1.5). The probability that the overall posterior mean of βj and γjfor vines with a lower rate of leaf emergence was less
than the overall posterior mean for the near optimum environment was 1.0 and 0.98, respectively.
For the leaf resistance parameters δj and εj, the probabilities that the overall posterior
mean at the slower rates of leaf emergence were less than the overall posterior mean at the faster rate were 0.117 and 0.287, respectively. There was considerable variation among plants for individual posterior means for δj , including overlap betweenthe two
Figure 1.3. The effect of leaf position on shoots of glasshouse-grown Cabernet sauvignon vines on severity of powdery mildew 14 days after the determination
of leaf position and inoculation of the adaxial surface of each leaf with 105 E. necator conidia per ml. Leaf position was correlated positively to leaf maturity.
Each inset represents a single shoot and the observed data are shown as circles (•). The fitted curves are shown for the overall model (–), leaf resistance model
(- - -) and pathogen growth model (···). Plants were grown at an average of 25°C (A) or 18°C (B) prior to inoculation.
5 10 15 20 5 10 15 20 5 10 15 20
Leaf position 100 80 60 40 20 0 100 80 60 40 20 0 100 80 60 40 20 0 Di se as e se ve ri ty ( %)
B B
B B
B B
B B A A A A
Table 1.4. Means and standard deviations (sd) for ‘posterior’ distributions of the
parameters βj, γj,εj, and δj (refer to Table 1.1) for each plant and pre-inoculation
temperature. Plants grown at an average of 18°C (plants 1-8) or 25°C (plants 9-18) prior
to inoculation.
βj γj εj δj
Plant Mean sd Mean sd Mean sd Mean sd
1 3.30 0.38 0.99 0.20 4.41 2.14 0.47 0.07
2 3.41 0.40 0.78 0.19 4.38 2.32 0.54 0.08
3 3.15 0.37 1.06 0.38 4.11 2.26 0.80 0.13
4 3.32 0.38 0.81 0.20 4.38 2.19 0.55 0.08
5 3.25 0.34 0.68 0.16 4.32 2.18 0.44 0.06
6 3.21 0.36 1.18 0.34 4.16 2.22 0.77 0.12
7 3.43 0.39 0.97 0.24 4.36 2.31 0.64 0.09
8 3.26 0.37 1.44 0.27 4.46 2.13 0.67 0.10
9 5.10 0.51 1.24 0.34 3.13 1.25 0.68 0.12
10 4.85 0.48 1.94 0.27 3.44 1.01 0.58 0.07
11 4.94 0.47 2.01 0.26 3.60 1.10 0.58 0.07
12 5.14 0.53 2.23 0.25 4.44 1.64 0.67 0.07
13 5.03 0.49 1.31 0.23 2.80 1.32 0.37 0.08
14 5.03 0.46 1.90 0.20 3.53 0.83 0.38 0.04
15 4.98 0.49 1.38 0.17 3.88 1.17 0.36 0.04
16 5.00 0.47 2.00 0.26 3.57 1.22 0.65 0.08
17 4.89 0.48 1.51 0.21 3.48 1.16 0.45 0.05
Table 1.5. Overall means and standard deviations (sd) for ‘posterior’ distributions of the
parameters βj, γj,εj, and δj for each pre-inoculation temperature.
Average pre-inoculation β* γ* ε* δ*
temperature (°C) Means sd Means sd Means sd Means sd 18 3.29 0.30 0.96 0.24 4.30 2.08 0.61 0.09 25 5.00 0.41 1.65 0.22 3.52 0.87 0.49 0.07
Early colonisation by E. necator in relation to leaf position
As leaves aged beyond leaf position 3, the percentage of conidia germinating to form a primary germ tube with or without secondary hyphae, generally decreased (Figure 1.4). A similar response was observed for the percentage of conidia germinating to form secondary hyphae (Figure 1.6). In contrast, the response for the percentage of conidia with primary germ tubes, but no secondary hyphae, was relatively flat, although there was a downward trend as leaves matured (Figure 1.5). The mean modal leaf position for the maximum percentage of conidia germinating to form secondary hyphae was 4.2, which was not significantly different (P = 0.6) to the mean modal leaf position with maximum powdery mildew severity which was 4.4 (Table 1.3). Powdery mildew was not observed
Figure 1.4. The effect of leaf position on shoots of Cabernet sauvignon vines, grown at
25oC in the glasshouse, on percentage germination of E. necator conidia (n=40), 72 h after
inoculation. The adaxial surface of each leaf was inoculated by transferring conidia with a
paint brush from 12 day-old cultures. Leaf position was correlated positively to leaf
Figure 1.5. The effect of leaf position on shoots of Cabernet sauvignon vines, grown at
25oC in the glasshouse, on the percentage of germinated E. necator conidia with primary
germ tubes but no secondary hyphae (n=40), 72 h after inoculation. The adaxial surface
of each leaf was inoculated by transferring conidia with a paint brush from 12 day-old
cultures. Leaf position was correlated positively to leaf maturity and all leaves were
Figure 1.6. The effect of leaf position on shoots of Cabernet sauvignon vines, grown at
25oC in the glasshouse, on the percentage of germinated E. necator conidia with
secondary hyphae (n=40), 72 h after inoculation. The adaxial surface of each leaf was
inoculated by transferring conidia with a paint brush from 12 day-old cultures. Leaf
position was correlated positively to leaf maturity and all leaves were tested at the same
D
ISCUSSIONThis study demonstrated that the colonisation of Cabernet sauvignon leaves by E. necator declined as leaves aged after expansion, as reported previously (Doster and Schnathorst 1985, Singh and Munshi 1993). The penetration of epidermal cells by germinating E. necator conidia declined as leaves matured, suggesting expression of leaf ontogenic resistance.Unlike previous studies, Bayesian analysis described how disease severity initially increased and then decreased due to leaf ontogenic resistance. Differences in the pre-inoculation environment affected the incidence and mean severity of powdery mildew on leaves, with a higher rate of leaf emergence leading to a greater proportion of diseased leaves per shoot and higher severity per leaf position.