https://doi.org/10.5194/essd-11-1553-2019 © Author(s) 2019. This work is distributed under the Creative Commons Attribution 4.0 License.
Global whole-rock geochemical database compilation
Matthew Gard1, Derrick Hasterok1,2, and Jacqueline A. Halpin3
1Department of Earth Sciences, University of Adelaide, North Terrace, SA, 5005, Australia
2Mawson Centre for Geoscience (MCG), University of Adelaide,
North Terrace, SA, 5005, Australia
3Institute for Marine and Antarctic Studies (IMAS), University of Tasmania, Hobart, TAS, 7001, Australia
Correspondence:Matthew Gard ([email protected])
Received: 19 March 2019 – Discussion started: 17 April 2019
Revised: 5 August 2019 – Accepted: 2 September 2019 – Published: 17 October 2019
Abstract. Collation and dissemination of geochemical data are critical to promote rapid, creative, and accurate research and place new results in an appropriate global context. To this end, we have compiled a global whole-rock geochemical database, sourced from various existing databases and supplemented with an extensive list of individual publications. Currently the database stands at 1 022 092 samples with varying amounts of associated sample data, including major and trace element concentrations, isotopic ratios, and location information. Spatial and temporal distribution is heterogeneous; however, temporal distributions are enhanced over some previous database compilations, particularly in ages older than ∼1000 Ma. Also included are a range of geochemical indices, various naming schema, and physical property estimates computed on a major element normalized version of the geochemical data for quick reference. This compilation will be useful for geochemical studies requiring extensive data sets, in particular those wishing to investigate secular temporal trends. The addition of physical properties, estimated from sample chemistry, represents a unique contribution to otherwise similar geochemical databases. The data are published in .csv format for the purposes of simple distribution, but exist in a structure format acceptable for database management systems (e.g. SQL). One can either manipulate these data using conventional analysis tools such as MATLAB®, Microsoft®Excel, or R, or upload them to a relational database management system for easy querying and management of the data as unique keys already exist. The data set will continue to grow and be improved, and we encourage readers to contact us or other database compilations within about any data that are yet to be included. The data files described in this paper are available at https://doi.org/10.5281/zenodo.2592822 (Gard et al., 2019a).
1 Introduction
Geochemical analyses in conjunction with other temporal, spatial, and physical property information have been vital sources of information for understanding the Earth and in-vestigating both local and global geodynamic histories (e.g. Keller and Schoene, 2018). Effective collection, collation, and dissemination of this type of data are critical to pro-mote rapid, creative and accurate research. Every year, the amount of data recorded globally increases, dispersed among many hundreds of individual publications. Since the 1960s and 1970s, broad element suites have been promptly accu-mulated due to the commercial availability of methods such
as X-ray fluorescence (XRF) and inductively coupled plasma mass spectrometry (ICP-MS), and thus modern publications are swiftly expanding our cumulative global data records. However, due to the rate of new publications in conjunction with significant partitioning between different journals, these data are not always easy to find and can be incredibly time-consuming to collate. It is pertinent that this information be readily available for future studies, as all benefit from taking advantage of the full suite of data available to produce more robust models and constrained analyses.
global tectonic histories (e.g. Keller and Schoene, 2018), to examining the connections between life and the solid Earth (e.g. Cox et al., 2018). This information has implications not only for the scientific community, but also for issues such as environmental management, land use, and mineral resource development.
In this paper we present a global whole-rock geochemical database compilation consisting of modified whole-rock sub-sets from existing database compilations, in conjunction with significant supplementation from individual publications not yet included in these other collections. Additionally, we have generated naming schema, various geochemical indices, and other physical property estimates, including density, seismic velocity, and heat production for a range of the data contained within.
2 Existing initiatives
Many existing initiatives have worked to construct and main-tain database compilations with great success, but often re-strict themselves to certain tectonic environments or regimes, regions, or rock types. EarthChem (https://www.earthchem. org, last access: 25 March 2017) is currently the most notable general use geochemical data repository. It consists of many federated databases such as NAVDAT, PetDB, GEOROC, SedDB, MetPetDB, and the USGS National Geochemical Database, as well as other individually submitted publica-tions. The constituent databases are mostly more specialized compilations, for example the following:
– The North American Volcanic and Intrusive Rock Database (NAVDAT) has existed since 2002 and is pri-marily aimed at geochemical and isotopic data from Mesozoic and younger igneous samples of western North America (Walker et al., 2006) (http://www. navdat.org/, last access: 9 October 2019).
– The Petrological Database of the Ocean Floor (PetDB) is the premier geochemical compilation suite for the igneous and metamorphic hosted data from mid-ocean ridges, back-arc basins, sea mounts, oceanic crust, and ophiolites (https://www.earthchem.org/petdb, last ac-cess: 9 October 2019).
– Geochemistry of Rocks of the Oceans and Continents (GEOROC) is a more holistic compilation effort of chemical, isotope, and other data for igneous sam-ples, including whole-rock, glass, minerals and inclu-sion analyses and metadata (http://georoc.mpch-mainz. gwdg.de, last access: 9 October 2019).
– SedDB focuses on sedimentary samples, primarily from marine sediment cores. It has been static since 2014 and includes information such as major and trace ele-ment concentrations, isotopic ratios, and organic and
in-last access: 25 March 2017).
– MetPetDB is a database for metamorphic petrology, in a similar vein to PetDB and SedDB. This database also hosts large swathes of images collected through various methods such as X-ray maps and photomicrographs, although this information is not utilized in this paper (http://metpetdb.com/, last access: 3 June 2019).
– The USGS National Geochemical Database archives geochemical information and its associated metadata from USGS studies and made available online
(https://www.usgs.gov/energy-and-minerals/ mineral-resources-program/science/
national-geochemical-database, last access: 9 Oc-tober 2019).
Many other government initiatives and national databases exist, with notable examples including PETROCH from the Ontario Geological Survey (Haus and Pauk, 2010), New Zealand’s national rock database (Petlab) (Strong et al., 2016), Australia’s national whole-rock geochemical database (OZCHEM) (Champion et al., 2016), the Finnish litho-geochemical rock geochemistry database (RGDB) (Rasi-lainen et al., 2007), the Newfoundland and Labrador Geo-science Atlas (Newfoundland and Labrador Geological Sur-vey, 2010), and the basement rock geochemical database of Japanese islands (DODAI) (Haraguchi et al., 2018).
While all of these are generally exceptional enterprises, we personally found that the variety of structures was cum-bersome to reconcile or otherwise deficient in some respect for our own research. Some examples included databases be-ing deficient in aged data (1000 Ma+) or lackbe-ing many re-cent publications. Some issues in certain existing databases were also evident; we found many samples missing informa-tion available in the original individual publicainforma-tions. It was quite common for age resolutions to be significantly larger than the values quoted within the paper itself, of the order of hundreds of millions of years in some cases or not included at all because they were not found in a table but within the text itself.
compi-lations. We intend to continue updating the database in both additional entries and further clean-up when necessary.
3 Database aggregation and structure
While other database structures are incredibly efficient, some of the intricacies of the systems make it difficult to utilize the information contained within. For example, we had issues when seeking estimated or measured ages of rock samples. In order to examine temporal variations of chemistry and phys-ical properties, an accurate and precise age is required. Un-der some of the present data management schemes it may be difficult to recover the desired data. Crystallization ages for older samples are often determined by U−Pb or Pb−Pb mea-surements from a suite of zircons. For a given sample, the in-dividual zircon dates may be contained within the database and stored under mineral analyses. However, a search for rock chemistry may only return an estimated age (often a ge-ologic timescale division). To get the crystallization age one would have to also download the individual mineral analyses, conduct an analysis on a concordia diagram (or similar), de-termine whether each individual analysis was valid, and then associate the result with the bulk chemistry. This process can be tedious and may be intractable. Had the estimated crys-tallization age been attributed to the sample directly, as of-ten reported in the original study, much of this process could be shortened. Instead, our database attributes these estimated crystallization ages directly to the whole rock sample entry, which allows us to include estimated ages for the same unit or formation more readily. As a result the database presented here allows for a higher density of temporal sampling than other compilations.
The database is provided in two formats, the first as a compressed single spreadsheet for people unfamiliar with database management systems and the second as a mixed flat file and relational database structure. Codd (1970) was the first to propose a relational model for database man-agement. A relational structure organizes data into multiple tables, with a unique key identifying each row of the sub-tables. These unique keys are used to link to other sub-sub-tables. The main advantages of a relational database over a flat file format are that data are uniquely stored just once, eliminat-ing data duplication as well as performance increases due to greater memory efficiency and easy filtering and rapid queries.
Rather than utilize an entirely relational database format, we have adopted some flat file formats for the sub-tables so as to reduce the number of total tables to an amount more man-ageable for someone unfamiliar with SQL database structure. This format raises storage memory due to data duplication in certain fields (e.g. repetition of certain string contents across multiple samples, such as rock name). However, we believe this is a reasonable trade-off for an easier-to-utilize structure for distribution and makes using these data for someone
un-familiar with SQL simpler. Ideally we would host a purely re-lational database structure online and be accessed via queries similar to the EarthChem Portal, but this is yet to be done.
PostgreSQL was utilized as the relational database man-agement system (RDBMS) to update and administer the database. PostgreSQL contains many built-in features and useful addons, including the PostGIS geospatial database ex-tender which we utilize, has a large open-source community, and runs on all major operating systems.
Python in conjunction with a PostgreSQL database adapter, Psycopg, is used to import new data efficiently. Data are copied into a .csv template directly from publications to reduce any chance of transcribing errors and dynamically uploaded to a temporary table in PostgreSQL. From here, the desired columns are automatically partitioned up and added to the database in their respective sub-tables. We it-erate through a folder of new publications in this way and are able to add data rapidly as a result.
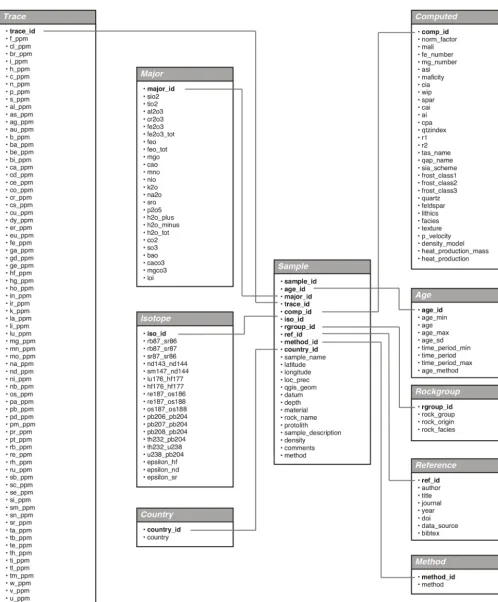
The database consists of 10 tables: trace elements, major elements, isotope ratios, sample information, rock group/origin/facies triplets, age information, reference in-formation, methods, country, and computed properties. The inter-connectivity of these tables is depicted in Fig. 1, with tables linked via their respective id keys. A description of each of these tables is included in Table 1, and column names that require further details as well as computed prop-erty methods are detailed in Table 3. Individual sub-tables have been output as .csv files for use. We suggest inserting these into a RDBMS for efficient queries and extraction of desired data. However, we have exported these in .csv format in case people not familiar with database systems wish to work with them in other programs such as Microsoft®Excel, MATLAB®, or R. While technically inefficient, the largest sub-table currently stands at only 280 MB uncompressed, which we believe to be an acceptable size for data manipula-tion. The compressed merged spreadsheet is only 130 MB.
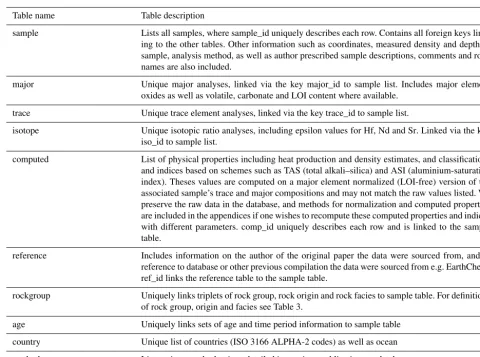
Table 1.Brief table content information.
Table name Table description
sample Lists all samples, where sample_id uniquely describes each row. Contains all foreign keys link-ing to the other tables. Other information such as coordinates, measured density and depth of sample, analysis method, as well as author prescribed sample descriptions, comments and rock names are also included.
major Unique major analyses, linked via the key major_id to sample list. Includes major element oxides as well as volatile, carbonate and LOI content where available.
trace Unique trace element analyses, linked via the key trace_id to sample list.
isotope Unique isotopic ratio analyses, including epsilon values for Hf, Nd and Sr. Linked via the key iso_id to sample list.
computed List of physical properties including heat production and density estimates, and classifications and indices based on schemes such as TAS (total alkali–silica) and ASI (aluminium-saturation index). Theses values are computed on a major element normalized (LOI-free) version of the associated sample’s trace and major compositions and may not match the raw values listed. We preserve the raw data in the database, and methods for normalization and computed properties are included in the appendices if one wishes to recompute these computed properties and indices with different parameters. comp_id uniquely describes each row and is linked to the sample table.
reference Includes information on the author of the original paper the data were sourced from, and/or reference to database or other previous compilation the data were sourced from e.g. EarthChem. ref_id links the reference table to the sample table.
rockgroup Uniquely links triplets of rock group, rock origin and rock facies to sample table. For definitions of rock group, origin and facies see Table 3.
age Uniquely links sets of age and time period information to sample table
country Unique list of countries (ISO 3166 ALPHA-2 codes) as well as ocean
method Lists unique method strings detailed in previous publications or databases
Table 2.Data sources.
Data source No. data
EarthChem family (excluding GEOROC) (https://www.earthchem.org/, last access: 25 March 2017) 380 532 GEOROC (http://georoc.mpch-mainz.gwdg.de, last access: 23 August 2018) 349 037
OZCHEM (Champion et al., 2016) 65 391
Petlab (Strong et al., 2016) 35 499
Petroch (Haus and Pauk, 2010) 27 388
Newfoundland and Labrador; Geoscience Atlas (Newfoundland and Labrador Geological Survey, 2010) 10 073 The British Columbia Rock Geochemical Database (Lett and Ronning, 2005) 8990 Canadian Database of Geochemical Surveys Open File Reports 8766
DODAI (Haraguchi et al., 2018) 6588
Finnish Geochemical Database (Rasilainen et al., 2007) 6543
Ujarassiorit Mineral Hunt (Geological Survey of Greenland, 2011) 6078 The Central Andes Geochemical GPS Database (Mamani et al., 2010) 1970 Geochemical database of the Virunga Volcanic Province (Barette et al., 2017) 908 Other sources (∼1900 sources, misc. files, see reference .csv and .bib file) 123 095
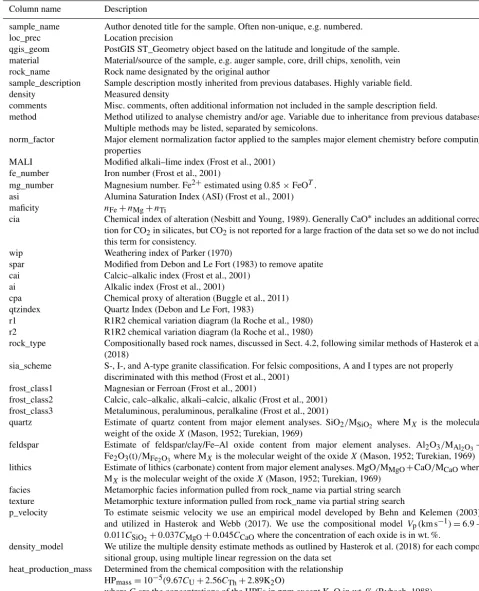
Table 3.Potentially ambiguous column information.
Column name Description
sample_name Author denoted title for the sample. Often non-unique, e.g. numbered. loc_prec Location precision
qgis_geom PostGIS ST_Geometry object based on the latitude and longitude of the sample. material Material/source of the sample, e.g. auger sample, core, drill chips, xenolith, vein rock_name Rock name designated by the original author
sample_description Sample description mostly inherited from previous databases. Highly variable field. density Measured density
comments Misc. comments, often additional information not included in the sample description field.
method Method utilized to analyse chemistry and/or age. Variable due to inheritance from previous databases. Multiple methods may be listed, separated by semicolons.
norm_factor Major element normalization factor applied to the samples major element chemistry before computing properties
MALI Modified alkali–lime index (Frost et al., 2001) fe_number Iron number (Frost et al., 2001)
mg_number Magnesium number. Fe2+estimated using 0.85×FeOT. asi Alumina Saturation Index (ASI) (Frost et al., 2001) maficity nFe+nMg+nTi
cia Chemical index of alteration (Nesbitt and Young, 1989). Generally CaO∗includes an additional correc-tion for CO2in silicates, but CO2is not reported for a large fraction of the data set so we do not include this term for consistency.
wip Weathering index of Parker (1970)
spar Modified from Debon and Le Fort (1983) to remove apatite cai Calcic–alkalic index (Frost et al., 2001)
ai Alkalic index (Frost et al., 2001)
cpa Chemical proxy of alteration (Buggle et al., 2011) qtzindex Quartz Index (Debon and Le Fort, 1983)
r1 R1R2 chemical variation diagram (la Roche et al., 1980) r2 R1R2 chemical variation diagram (la Roche et al., 1980)
rock_type Compositionally based rock names, discussed in Sect. 4.2, following similar methods of Hasterok et al. (2018)
sia_scheme S-, I-, and A-type granite classification. For felsic compositions, A and I types are not properly discriminated with this method (Frost et al., 2001)
frost_class1 Magnesian or Ferroan (Frost et al., 2001)
frost_class2 Calcic, calc–alkalic, alkali–calcic, alkalic (Frost et al., 2001) frost_class3 Metaluminous, peraluminous, peralkaline (Frost et al., 2001)
quartz Estimate of quartz content from major element analyses. SiO2/MSiO2 where MX is the molecular weight of the oxideX(Mason, 1952; Turekian, 1969)
feldspar Estimate of feldspar/clay/Fe–Al oxide content from major element analyses. Al2O3/MAl2O3+ Fe2O3(t)/MFe2O3where MXis the molecular weight of the oxideX(Mason, 1952; Turekian, 1969) lithics Estimate of lithics (carbonate) content from major element analyses. MgO/MMgO+CaO/MCaOwhere
MXis the molecular weight of the oxideX(Mason, 1952; Turekian, 1969) facies Metamorphic facies information pulled from rock_name via partial string search texture Metamorphic texture information pulled from rock_name via partial string search
p_velocity To estimate seismic velocity we use an empirical model developed by Behn and Kelemen (2003), and utilized in Hasterok and Webb (2017). We use the compositional model Vp(km s−1)=6.9− 0.011CSiO2+0.037CMgO+0.045CCaOwhere the concentration of each oxide is in wt. %.
density_model We utilize the multiple density estimate methods as outlined by Hasterok et al. (2018) for each compo-sitional group, using multiple linear regression on the data set
heat_production_mass Determined from the chemical composition with the relationship HPmass=10−5(9.67CU+2.56CTh+2.89K2O)
Table 3.Continued.
Column name Description
heat_production Heat production mass multiplied by the density estimate (in kg m−3) (Rybach, 1988) age_ or time_period_ min Minimum crystallization age estimate
age or time_period Mean crystallization age estimate age_ or time_period_ max Maximum crystallization age estimate
age_sd Age uncertainty
age_method Method of age estimation, variable due to inheritance from previous databases rock_group The highest-order rock-type classifications: igneous/metamorphic/sedimentary
rock_origin Second-order classifications of the rock groups – e.g. plutonic/volcanic, meta-plutonic/meta-igneous/metased, clastic/chemical
rock_facies Third-order classifications, mostly restricted to metamorphic rock facies, e.g. granulite data_source Field reserved for existing database compilation, e.g. if a sample is derived from EarthChem
bibtex Bibtex key corresponding to further reference information if it exists, contained in the attached bib file for easier citation
4 Data statistics
4.1 Raw data
The largest existing database contributions to this database are listed in Table 2. Individual publication supplementa-tion includes both new addisupplementa-tions we have found in the litera-ture as well as cleaned-up and modified entries from existing databases. The subsets of existing databases do not represent the entire collections for many of these programs as we have done pre-filtering to remove non-whole rock data or encoun-tered issues with accessing the entire data set using online web forms.
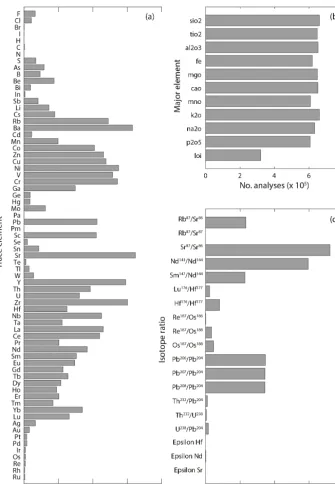
Figure 2 denotes histograms of the various major, trace, and isotope analyses within the database. The majority of iso-tope data were recently sourced from the GEOROC database. Unsurprisingly, major element analyses in general dwarf the number of trace element measurements recorded.
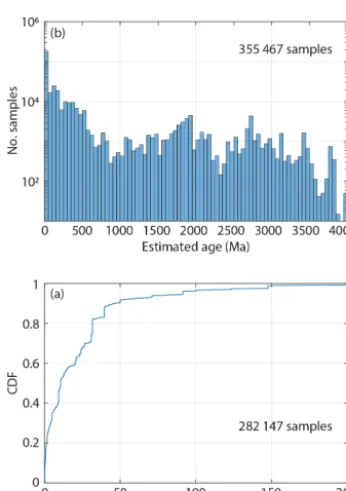
Despite the heterogeneous nature of geochemical sam-pling, there is still reasonable spatial coverage around the world. However, there is a noticeable dominance of sam-ples sourced from North America, and additionally Canada, Australia, and New Zealand (Fig. 3). The United States tops the list with 352 761 samples, including those from its non-contiguous states. The African continent suffers the most from lack of data with regards to the rest of the globe (Fig. 3). Age distributions unsurprisingly show a significant dom-inance towards very recent samples (<50 Ma), due largely to the oceanic subset (Fig. 4b). Age here is indicated as be-ing an assumed crystallization age. Excludbe-ing major time-period-associated ages (e.g. a Paleoproterozoic age range of 2500–1600 Ma as the maximum and minimum ages of a sam-ple), there are 355 467 samples with estimated crystallization age values. Of these, 282 147 have age uncertainty estimates, and observing the cumulative distribution function of these values indicates that∼99 % of the age uncertainties fall be-low∼150 Ma (Fig. 4a).
Rock group and rock origin are described in Table 3. There is a clear dominance towards igneous samples, mak-ing up 72.37 % of the data with known rock group infor-mation (Fig. 5). About 99 % of these igneous samples have a distinction noted as volcanic or plutonic in the rock ori-gin field, with just over two-thirds of these being volcanic. Sedimentary samples are the next most common rock group; however, the vast majority of these have no classification in rock origin, and we aim to improve this in future updates. Finally, metamorphic rocks have∼44 % of the samples with rock origin classifications. Metasedimentary origin is slightly more common than meta-igneous; however, meta-igneous in-cludes two further subdivisions of volcanic and meta-plutonic where known.
4.2 Naming schema – rock_type
Nomenclature varies significantly within geology, and unsur-prisingly rock names within the database differ wildly as a result. Different properties such as texture, mineralogical as-semblages, grain sizes, thermodynamic histories, and chem-istry make up the majority of the basis for the various nam-ing conventions utilized throughout, interspersed with author assumptions and/or inaccuracies. Thus, we sought a robust and consistent chemical classification scheme to assign rock names to the various samples of the database. This chemical basis classification scheme is stored in the computed table, within the rock_type field.
Figure 2.Histogram of analyses.(a)Trace elements.(b)Major oxides. Fe denotes any one or more entries for feo, feo total, fe2o3, or fe2o3 total.(c)Isotope ratios and epsilon values.
20 wt. %. These entries are assigned either the plutonic or volcanic equivalent rock names depending on whether the sample is known to be of plutonic or volcanic origin.
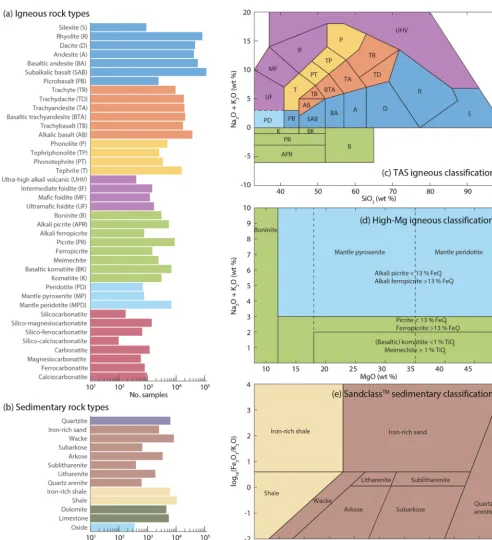
For sedimentary and metasedimentary rocks, we first sep-arate out carbonates and soils using ternary plot divisions of SiO2, Al2O3+Fe2O3, and CaO+MgO (Mason, 1952; Turekian, 1969). Additionally, we further partition clastic sediments using the SedClass™ classification method from Herron (1988). Quartzites are identified separately where
SiO2exceeds 0.9 in the ternary system. See Hasterok et al. (2018) for further discussion.
Figure 3.Spatial distribution of geochemical samples. Countries are shaded based on the number of data points within the polygons.
Figure 4.Temporal distribution of geochemical samples.(a) His-togram of mean ages in 50 Ma intervals.(b)Empirical cumulative distribution function (CDF) of age uncertainty (major time period associated ages removed).
4.3 Computed properties
In numerical models, rock types are often assigned physi-cal property estimates that have been derived from limited data sets. We compute a number of properties and naming schema for a significant subset of the database, a new ad-dition over many previous database compilations. This in-cludes heat production, density, and P-wave velocity esti-mates, as well as various geochemical indices and
descrip-Figure 5.Rock group partitioning.(a)Pie chart depicting distri-bution of samples containing a rock group.(b–d)denote the rock origin distributions of the rock group fields where rock origin is listed.
tors such as modified TAS, QAPF, and SIA classifications. A full list of referenced methods and computed columns is given in Table 3.
[image:9.612.328.523.287.561.2] [image:9.612.81.254.288.534.2]the database, i.e. major element totals are normalized to 100, while preserving the relative proportions of each individual element’s contribution to the total. This normalization occurs only on samples with major element totals between 85 wt. % and 120 wt. %. Totals lying outside this range are ignored, and properties requiring these values are not computed. The exact value of normalization for each sample is recorded in the computed table, within the norm_factor field. Figure 7a–c denote some property estimates calculated from the normal-ized analyses.
4.3.1 Density estimates
Density is an important input for a wide range of models, but only a small fraction of samples have measured density val-ues associated with them. Contained within the database are a number of publications hosting density observations (e.g. Haus and Pauk, 2010; Barette et al., 2016; Slagstad, 2008). Following the method of Hasterok et al. (2018), we produce a set of simple oxide-based linear regression density models.
ρLow-Mg=2506.22+204.82×Fe∗+791.72
×Maficity−4.56×MALI,
Misfit=97 kg m−3,
ρHigh-Mg=3159.18−10.40×MgO+1.36×CaO,
Misfit=149kg m−3,
ρCarb.=3268.04−6.23×SiO2−6.37
×CaO−2.88×MgO,
Misfit=147kg m−3,
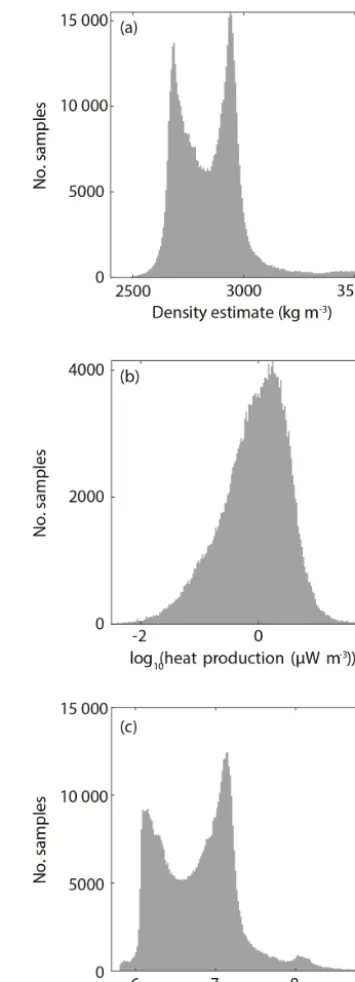
where Fe∗is iron number, MALI is modified alkali-lime in-dex, oxides are in weight percent, andρis density in kg m−3. Low-Mg, High-Mg, and Carb. (carbonated rocks) refer to the specific models for different rock groups. See Hasterok et al. (2018) for further discussion of the model fits. Density esti-mates peak at∼2680 and∼2946 kg m−3due to mafic and felsic sample medians respectively.
4.3.2 Seismic velocity
We utilize the empirical model of Behn and Kelemen (2003) for estimating anhydrous P-wave seismic velocity. Their model was calibrated on ∼18 000 igneous rocks and val-idated against 139 high-quality laboratory measurements. However, this model does have limitations, as it was cali-brated to anhydrous compositions only. Utilizing their three-oxide model, estimated uncertainty (1σ) is∼ ±0.13 km s−1. P-wave velocity estimates depict maximums at ∼6.2 and ∼7.1 m s−1(Fig. 7c). For further details or discussion, refer to Behn and Kelemen (2003) and Hasterok and Webb (2017).
Vp=6.9−0.011×SiO2+0.037×MgO+0.045×CaO,
[image:11.612.337.515.63.555.2]where oxides are in weight percent andVpis in m s−1.
Figure 7.Example computed physical property estimate distribu-tions.(a)Density.(b)Heat production.(c)P-wave velocity.
4.3.3 Heat production
Heat production is computed by employing the relationship from Rybach (1988). Heat production estimates are resolved by a smoother distribution in log space than the dichotomous nature of the density andVpestimates.
cent andρin kg m . Heat production has a median value of ∼1.0 µW m−3, with first and third quartiles (25th and 75th percentiles) of 0.39 and 2.2 µW m−3respectively.
5 Improvements and future developments
5.1 Bibliographic information
Due to a high variety of sources and database formats, merg-ing bibliographic information proved difficult. For individual publications and adjustments made manually, we have col-lated bibliographic information in higher detail. We hope to expand this .bib file as we continue to clean up the reference lists and make adjustments to other compilations. For other inherited bibliographic information from external databases, the exact format can vary. These details are contained within the reference .csv and are linked to each sample through the ref_id as seen in Fig. 1.
5.2 Ownership and accuracy
Although every effort is made to ensure accuracy, there are undoubtedly some errors, either inherited or introduced. We make no claims to the accuracy of database entries or refer-ence information. It is up to the user to validate subsets for their own analyses, and ideally contact the original authors, previous database compilation sources, or ourselves to cor-rect errors where they exist. We make no claim on ownership of these data; when utilizing this database, additionally cite the original authors and data sources.
6 Data availability
The .bib file and .csv tables of this data set are available on Zenodo: https://doi.org/10.5281/zenodo.2592822 (last ac-cess: 9 October 2019) (Gard et al., 2019a). An associ-ated set of software that can be used in MATLAB® to ex-plore the database, including many of the individual methods cited above for the computed properties, is also available on github at https://github.com/dhasterok/global_geochemistry (Hasterok and Gard, 2019).
7 Future work
We have published portions of the database in the course of prior studies and will continue to expand this data set for our own research purposes. Small individual corrections have oc-curred incrementally with every version, and unfortunately we did not keep records of these improvements. Going for-ward, we plan to include a record of these corrections and forward them to the other database compilations as needed. We hope to work with existing compilation authors in the future to assist with new additions as well. This version of
supplement their own records.
Utilizing this database, we have worked on methods for predicting protoliths of metamorphic rocks (Hasterok et al., 2019a). As over 57 % of the samples lack that informa-tion (Fig. 5), this methodology may be included in future database versions. We are also making progress on a geo-logic provinces map that captures tectonic terranes.
Author contributions. MG and DH worked on the processing codes, computed property estimates, and collated data sources. MG organized the database structure and framework codes and prepared the manuscript with contributions from all the co-authors. JAH col-lated the Antarctic geochemical set.
Competing interests. The authors declare that they have no con-flict of interest.
Acknowledgements. We thank Bärbel Sarbas for supplying the GEOROC database in its entirety. We would also like to thank the following individuals for providing data sets and/or per-sonal compilations: David Champion (GA), Dick Claeson (SGU), Trond Slagstad (NGU), Lorella Francalanci (UNIFI), Yuri Mar-tynov (FEGI-RAS), Takeshi Hanyu (JAMSTEC), John Clemens (SUN), Harald Furness (UIB), Alex Burton-Johnson (BAS), and Marlina Elburg (UJ). Peter Johnson provided a collection of pa-pers with data for the Arabian-Nubian Shield. Matthew Gard is sup-ported by an Australian Government Research Training Program Scholarship. The views expressed herein are those of the authors and are not necessarily those of the Australian Government or Aus-tralian Research Council.
Financial support. This research has been supported by the Aus-tralian Research Council’s Discovery Projects funding scheme (grant no. DP180104074) and the Australian Research Council’s Special Research Initiative for Antarctic Gateway Partnership (grant no. SR140300001).
Review statement. This paper was edited by Attila Demény and reviewed by Juan Carlos Afonso, Kent Condie, and one anonymous referee.
References
Barette, F., Poppe, S., Smets, B., Benbakkar, M., and Kervyn, M.: Spatial variation of volcanic rock geochemistry in the Virunga Volcanic Province: Statistical analysis of an integrated database, J. Afr. Earth Sci., 134, 888–903, https://doi.org/10.1016/j.jafrearsci.2016.09.018, 2016.
an integrated database, J. Afr. Earth Sci., 134, 888–903, https://doi.org/10.1016/j.jafrearsci.2016.09.018, 2017.
Behn, M. and Kelemen, P. B.: Relationship between seismic P-wave velocity and the composition of anhydrous igneous and meta-igneous rocks, Geochem. Geophys. Geosyst., 4, 1041, https://doi.org/10.1029/2002GC000393, 2003.
Buggle, B., Glaser, B., Hambach, U., Gerasimenko, N., and Markovi´c, S.: An evaluation of geochemical weathering in-dices in loess–paleosol studies, Quatern. Int., 240, 12–21, https://doi.org/10.1016/j.quaint.2010.07.019, 2011.
Carbotte, S. M., Marjanovi´c, M., Carton, H., Mutter, J. C., Canales, J. P., Nedimovi´c, M. R., Han, S., and Perfit, M. R.: Fine-scale segmentation of the crustal magma reser-voir beneath the East Pacific Rise, Nat. Geosci., 6, 866–870, https://doi.org/10.1038/ngeo1933, 2013.
Champion, D., Budd, A., Hazell, M., and Sedgmen, A.: OZCHEM National Whole Rock Geochemistry Dataset, Tech. rep., Geoscience Australia, available at: https://ecat.ga.gov.au/ geonetwork/srv/eng/catalog.search?node=srv#/metadata/65464, last access: June 2016.
Codd, E. F.: A Relational Model of Data for Large Shared Data Banks, Comm. ACM, 13, 377–387, https://doi.org/10.1145/362384.362685, 1970.
Cox, G. M., Lyons, T. W., Mitchell, R. N., Hasterok, D., and Gard, M.: Linking the rise of atmospheric oxygen to growth in the con-tinental phosphorus inventory, Earth Planet. Sci. Lett., 489, 28– 36, https://doi.org/10.1016/j.epsl.2018.02.016, 2018.
Debon, F. and Le Fort, P.: A chemical–mineralogical classification of common plutonic rocks and asso-ciations, T. Roy. Soc. Edin.-Earth, 73, 135–149, https://doi.org/10.1017/S0263593300010117, 1983.
Frost, B. R., Barnes, C. G., Collins, W. J., Arculus, R. J., Ellis, D. J., and Frost, C. D.: A Geochemical Clas-sification for Granitic Rocks, J. Petrol., 42, 2033–2048, https://doi.org/10.1093/petrology/42.11.2033, 2001.
Gard, M., Hasterok, D., and Halpin, J.: Global whole-rock geochemical database compilation (Version 1.0.0), https://doi.org/10.5281/zenodo.2592823, 2019a.
Gard, M., Hasterok, D., Hand, M., and Cox, G.: Variations in continental heat production from 4 Ga to the present – Evidence from geochemical data, Lithos, 342–343, 391–406, https://doi.org/10.1016/j.lithos.2019.05.034, 2019b.
Geological Survey of Greenland: Ujarassiorit 1989–2011, Tech. rep., 2011.
Haraguchi, S., Ueki, K., Yoshida, K., Kuwatani, T., Mo-hamed, M., Horiuchi, S., and Iwamori, H.: Geochemical database of Japanese islands for basement rocks: compila-tion of domestic article, J. Geol. Soc. Jpn., 124, 1049–1054, https://doi.org/10.5575/geosoc.2018.0027, 2018.
Hasterok, D. and Gard, M.: A global geochemistry dataset for rocks, GitHub repository, available at: https://github.com/dhasterok/ global_geochemistry, last acces: 8 October 2019.
Hasterok, D. and Webb, J.: On the radiogenic heat pro-duction of igneous rocks, Geosci. Front., 8, 919–940, https://doi.org/10.1016/j.gsf.2017.03.006, 2017.
Hasterok, D., Gard, M., and Webb, J.: On the radio-genic heat production of metamorphic, igneous, and sedimentary rocks, Geosci. Front., 9, 1777–1794, https://doi.org/10.1016/j.gsf.2017.10.012, 2018.
Hasterok, D., Gard, M., Bishop, C., and Kelsey, D.: Chem-ical identification of metamorphic protoliths using ma-chine learning methods, Comput. Geosci., 132, 56–68, https://doi.org/10.1016/j.cageo.2019.07.004, 2019a.
Hasterok, D., Gard, M., Cox, G., and Hand, M.: A 4 Ga record of granitic heat production - Implications for geodynamic evolution and crustal composition of the early Earth, Precambrian Res., 331, 105375, https://doi.org/10.1016/j.precamres.2019.105375, 2019b.
Haus, M. and Pauk, T.: Data from the PETROCH lithogeochemical database, Miscellaneous release – data 250, Ontario Geol. Surv., 2010.
Herron, M. M.: Geochemical Classification of Terrigenous Sands and Shales from Core or Log Data, SEPM Journal of Sedimen-tary Research, 58, 820–829, https://doi.org/10.1306/212f8e77-2b24-11d7-8648000102c1865d, 1988.
Iwamori, H. and Nakamura, H.: Isotopic heterogeneity of oceanic, arc and continental basalts and its implications for mantle dynamics, Gondwana Res., 27, 1131–1152, https://doi.org/10.1016/j.gr.2014.09.003, 2015.
Keller, B. and Schoene, B.: Plate tectonics and continental basaltic geochemistry throughout Earth history, Earth Planet. Sci. Lett., 481, 290–304, https://doi.org/10.1016/j.epsl.2017.10.031, 2018. la Roche, H. D., Leterrier, J., Grandclaude, P., and Marchal, M.: A classification of volcanic and plutonic rocks using R1R2-diagram and major-element analyses – Its relation-ships with current nomenclature, Chem. Geol., 29, 183–210, https://doi.org/10.1016/0009-2541(80)90020-0, 1980.
Le Bas, M. and Streckeisen, A.: The IUGS systematics of igneous rocks, J. Geol. Soc., 148, 825–833, 1991.
Lett, R. and Ronning, C.: BC rock geochemical database – British Columbia Geological Survey Geofile 2005–14, Tech. rep., British Columbia Ministry of Energy and Mines, 2005. Mamani, M., Worner, G., and Sempere, T.: Geochemical
varia-tions in igneous rocks of the Central Andean orocline (13 S to 18 S): Tracing crustal thickening and magma generation through time and space, Geol. Soc. Am. Bull., 122, 162–182, https://doi.org/10.1130/B26538.1, 2010.
Mason, B.: Principles of Geochemistry, John Wiley & Sons, 1952. Middlemost, E. A.: Naming materials in the magma/igneous
rock system, Earth Sci. Rev., 37, 215–224, https://doi.org/10.1016/0012-8252(94)90029-9, 1994.
Nesbitt, H. W. and Young, G. M.: Formation and Diagenesis of Weathering Profiles, J. Geol., 97, 129–147, 1989.
Newfoundland and Labrador Geological Survey: Newfoundland and Labrador GeoScience Atlas OnLine, Tech. rep., available at: http://geoatlas.gov.nl.ca (last access: June 2016), 2010. Parker, A.: An Index of Weathering for Silicate Rocks, Geol. Mag.,
107, 501–504, https://doi.org/10.1017/S0016756800058581, 1970.
Rasilainen, K., Lahtinen, R., and Bornhorst, T.: The Rock Geo-chemical Database of Finland Manual, Report of Investigation 164, Geol. Surv. Finland, 2007.
geological provinces in Norway, Norw. J. Geol., 88, 149–166, 2008.
Strong, D., Turnbull, R., Haubrock, S., and Mortimer, N.: Pet-lab: New Zealand’s national rock catalogue and geoanalyt-ical database, New Zeal. J. Geol. Geophys., 53, 475–481, https://doi.org/10.1080/00288306.2016.1157086, 2016.
of geochemistry, Springer-Verlag Berlin, Heidelberg, New York, 1, 297–323, 1969.
![Dichlorido[2,3,5,6 tetrafluoro 4 (trifluoromethyl)phenyl κC1]bis(trimethylphosphine κP)cobalt(III)](data:image/gif;base64,R0lGODlhAQABAIAAAP///wAAACH5BAEAAAAALAAAAAABAAEAAAICRAEAOw==)