RNAs Transcribed from the Epstein-Barr Virus BamHI A Rightward
Transcript Region
Aron R. Marquitz,aAnuja Mathur,aRachel Hood Edwards,aNancy Raab-Trauba,b
Lineberger Comprehensive Cancer Centera
and Department of Microbiology and Immunology,b
University of North Carolina at Chapel Hill, Chapel Hill, North Carolina, USA
ABSTRACT
In Epstein-Barr virus-infected epithelial cancers, the alternatively spliced BamHI A rightward transcripts (BARTs) are the most abundant viral polyadenylated RNA. The BART introns form the template for the production of 44 microRNAs (miRNAs), and the spliced and polyadenylated exons form nuclear non-protein-coding RNAs. Analysis of host cell transcription by RNA-seq during latency in AGS cells identified a large number of reproducibly changed genes. Genes that were downregulated were en-riched for BART miRNA targets. Bioinformatics analysis predicted activation of the myc pathway and downregulation of XBP1 as likely mediators of the host transcriptional changes. Effects on XBP1 activity were not detected in these cells; however, myc activation was confirmed through use of a myc-responsive luciferase reporter. To identify potential regulatory properties of the spliced, polyadenylated BART RNAs, a full-length cDNA clone of one of the BART isoforms was obtained and expressed in the Epstein-Barr virus (EBV)-negative AGS cells. The BART cDNA transcript remained primarily nuclear yet induced considerable and consistent changes in cellular transcription, as profiled by RNA-seq. These transcriptional changes significantly overlapped the transcriptional changes induced during latent EBV infection of these same cells, where the BARTs are exclusively nuclear and do not encode proteins. These data suggest that the nuclear BART RNAs are functional long noncoding RNAs (lncRNAs). The abundant expression of multiple forms of noncoding RNAs that contribute to growth regulation without expression of immuno-genic proteins would be an important mechanism for viral oncogenesis in the presence of a functional immune system.
IMPORTANCE
Infection with Epstein-Barr virus (EBV) is nearly ubiquitous in the human population; however, it does contribute to the forma-tion of multiple types of cancer. In immunocompromised patients, EBV causes multiple types of lymphomas by expressing viral oncogenes that promote growth and survival of infected B lymphocytes. EBV-positive gastric carcinoma does not require im-mune suppression, and the viral oncoproteins that are frequent targets for an immunological response are not expressed. This study demonstrates using transcriptional analysis that the expression of various classes of viral non-protein-coding RNAs likely contribute to the considerable changes in the host transcriptional profile in the AGS gastric cancer cell line. This is the first re-port to show that the highly expressed polyadenylated BamHI A rightward transcripts (BART) viral transcript in gastric carci-noma is in fact a functional viral long noncoding RNA. These studies provide new insight into how EBV can promote transfor-mation in the absence of viral protein expression.
L
atent infection with Epstein-Barr virus (EBV), a nearlyubiq-uitous human herpesvirus, is responsible for multiple malig-nancies in the two types of cells that it infects: B lymphocytes and
epithelial cells (1). The mechanism by which EBV leads to
trans-formation depends on both the properties of the host cell and the state of the host immune system. Infection of primary B cells with EBVin vitrois sufficient for immortalization, which results from the expression of a set of latent viral proteins that have oncogenic
properties (1). This type of latent protein expression, termed
la-tency III, is also observed in EBV-driven lymphomas that develop in immunocompromised individuals. In EBV-associated lympho-mas or carcinolympho-mas that develop in individuals with a healthy im-mune system, a much more restricted pattern of viral protein
ex-pression is observed (2). However, these tumors are clonally
infected with EBV, suggesting that EBV infection is an early event
in the formation of the tumors (3). Consistent with these
obser-vations, EBV infection of an epithelial cell linein vitrois capable of
promoting growth in soft agar independent of any latent protein
expression (4).
EBV epithelial malignancies, nasopharyngeal and gastric car-cinomas, exhibit a unique expression pattern that includes exten-sive transcription from the BamHI A region of the viral genome
(5). The transcription from this region consists of a set of highly
expressed and alternatively spliced transcripts that are called the
BamHI A rightward transcripts (BARTs) (6). These transcripts
Received8 June 2015Accepted21 August 2015
Accepted manuscript posted online26 August 2015
CitationMarquitz AR, Mathur A, Edwards RH, Raab-Traub N. 2015. Host gene
expression is regulated by two types of noncoding RNAs transcribed from the Epstein-Barr virus BamHI A rightward transcript region. J Virol 89:11256 –11268.
doi:10.1128/JVI.01492-15.
Editor:R. M. Longnecker
Address correspondence to Nancy Raab-Traub, [email protected].
Supplemental material for this article may be found athttp://dx.doi.org/10.1128 /JVI.01492-15.
Copyright © 2015, American Society for Microbiology. All Rights Reserved.
on November 7, 2019 by guest
http://jvi.asm.org/
contain multiple open reading frames (ORFs) dependent upon splicing pattern (BARF0, A73, and RPMS1); however, proteins have not been detected from the endogenous translation of these
ORFs (7,8). A first clue to the actual function of these transcripts
came from the discovery that the introns of these transcripts con-tained 22 microRNA (miRNA) precursors which can produce 44 mature miRNAs, many of which are expressed at high levels in
tumors, the same tumors that also express the BARTs (9–11).
Analysis of the residual RNA fragments that remain after excision of the miRNA hairpins suggests that these miRNAs are removed
from the primary transcript prior to splicing (12). Despite this, the
spliced and polyadenylated mature transcripts persist at high lev-els in epithelial cells and have been shown to remain in the nucleus
(8, 12). A recent RNA-seq analysis of a panel of EBV-infected
gastric tumors suggested that⬎99% of all virally derived
polyade-nylated transcripts were BARTs (13,14).
Infection of the EBV-negative gastric carcinoma cell line AGS is a useful model for studying EBV epithelial latency since these cells consistently adopt a highly restricted pattern of expression that is quite similar to latency I in EBV-positive gastric carcinoma. Importantly, EBV infection of AGS cells consistently induces
an-chorage-independent growth and increased motility (4,15,16).
Gene expression microarray analysis of a single AGS-EBV cell line compared to parental cells suggested that there are widespread changes in host transcription due to latent EBV infection and that the downregulated genes were highly enriched for BART miRNA
targets (4). In the present study, multiple clonal AGS-EBV cell
lines were profiled by RNA-seq, generating data that are more accurate than data obtained by microarray analysis, that account for the clonal evolution inherent in any one particular cell line, and that include an evaluation of not only host but also viral tran-scription. Pathway analysis identified multiple cellular regulatory pathways that are consistent with anchorage-independent growth and transformation. The transcriptional changes predicted activa-tion of the myc oncogene which would likely be a contributing factor to the altered growth properties. In addition, RNA-seq analysis of AGS cells expressing the first full-length cDNA clone of one of the splice isoforms of the BARTs revealed that the expres-sion pattern obtained after BART expresexpres-sion overlapped signifi-cantly with the expression pattern following EBV infection of the same cells in which the BARTs are expressed at high levels endog-enously. These data provide the first evidence that the BARTs function as long noncoding RNAs (lncRNAs) independently of miRNA formation. Human lncRNAs are quite abundant in the human genome, with recent evidence from RNA-seq and other sources suggesting that there are likely nearly as many lncRNA
genes as protein coding genes in the human genome (17). Many of
the functions of these lncRNAs have yet to be determined, al-though those for which a functional mechanism has been deter-mined often rely on transcriptional regulation through direct re-cruitment either of transcription factors or chromatin remodeling
enzymes (18). The transcriptional regulatory functions of the
BARTs, independent of miRNA production, and their abundance in EBV derived epithelial malignancies suggest that these noncod-ing RNAs likely contribute to EBV effects on epithelial growth and transformation.
MATERIALS AND METHODS
Cell lines and culture.The gastric carcinoma cell line AGS was grown in F-12 media (Life Technologies, Inc.) with 10% fetal bovine serum and
antibiotic/antimycotic (Life Technologies, Inc.). The generation of AGS
cells clonally infected with EBV Akata BX1 was previously described (15).
AGS-EBV cells were also maintained with 500g of G418 (Life
Technol-ogies, Inc.)/ml to select for retention of the EBV episome. Stable cell lines expressing pcDNA3-BART were generated by transfection with Lipo-fectamine 2000 (Life Technologies, Inc.) and selected in media containing
zeocin (Life Technologies, Inc.) at 200g/ml. Cell lines containing pCEP4
episomal vectors were maintained in 200g of hygromycin (Roche)/ml to
select for retention of the vector. Normal oral keratinocyte (NOK) and NOK-Akata cells (a gift from Shannon Kenney, University of Wisconsin)
have been previously described (19) and were maintained in
keratinocyte-SFM (Life Technologies, Inc.) supplemented with epidermal growth fac-tor, bovine pituitary extract, and antibiotic/antimycotic.
Plasmids and cloning.The myc reporter plasmid pBV-Luc wild-type (wt) MBS1-4 was a gift from Bert Vogelstein (Addgene, plasmid 16564) and contains four tandem myc binding sites from the human CDK4
pro-moter upstream of Firefly luciferase (20). pBV-Luc mut MBS1-4, a gift
from Bert Vogelstein (Addgene, plasmid 16565), which has all four myc
binding sites mutated (20), was used as a negative control. pRL-SV40
(Promega) is aRenillaluciferase-expressing plasmid that was used as a
transfection control. The full 3=untranslated regions (3=UTRs) of
poten-tial miRNA targets were amplified by PCR from genomic AGS DNA using Phusion Flash High Fidelity PCR mix (Thermo) and cloned into the XhoI/ NotI sites of psicheck2 (Promega). The oligonucleotides used to amplify
each 3=UTR are listed in Table S3 in the supplemental material. In order to
create a full-length BART cDNA clone, a cDNA PCR product from exon 1 to exon 7 (positions 138353 to 160086 on the wt EBV genome [NC_007605.1]) previously generated from cDNA from a
nasopharyn-geal carcinoma xenograft (12), was extended to the poly(A) site of the
BARTs using overlap PCR with a PCR fragment of exon 7b. The
oligonu-cleotides 5=BARTlong and 3-5exon7b were used to amply the first
frag-ment from the cDNA clone, and the oligonucleotides 3=BARTlong and
5-3exon7b were used to amply the exon7b fragment. After overlap PCR
using these two PCR products and oligonucleotides 5=BARTlong and
3=BARTlong, the resulting PCR product was cloned into the BamHI and
XhoI sites in the multiple cloning site of pcDNA3.1-zeo (Life Technolo-gies, Inc.). The resulting plasmid was sequenced and confirmed to contain a full-length BART cDNA that contains exons 1, 1A, 2, 3A, 3B, 4, 5A, 5B,
6, 7A, and 7B (seeFig. 5). In order to move the BART cDNA into the
pCEP4 vector (Life Technologies, Inc.), the entire cDNA was excised from pcDNA3 by cutting with KpnI/XhoI and inserted into the pCEP4 multiple cloning site cut with the same enzymes. All restriction enzymes were pur-chased from NEB and used according to the manufacturer’s instructions.
RNA sequencing.RNA was prepared from cell lines grown for 2 days to 80% confluence using TRIzol reagent (Life Technologies, Inc.). Poly(A)-selected, bar-coded, non-strand-specific cDNA libraries were prepared for sequencing using a TruSeq RNA Sample Prep kit v2 (Illu-mina) by the UNC Lineberger Genomics Core. Libraries were pooled and sequenced in pools of six libraries using a HiSeq2000 instrument (Illu-mina) by the UNC High-Throughput Sequencing Facility. AGS parental, AGS-EBV, and AGS with pcDNA3 vectors were sequenced using paired-end 100-bp sequencing, and the pCEP4 cell lines were sequenced using paired-end 50-bp sequencing. Raw data for all of the sequencing are pub-licly available at the NCBI short read archive under study SRP060253.
Bioinformatics.RNA sequencing reads were aligned to the human genome (hg19) and the EBV Akata genome (GenBank accession number
KC207813.1) using the splicing aware read aligner TopHat on the Galaxy suite. Aligned reads were mapped to specific human Refseq genes using the Partek Genomics Suite, which was also used to calculate differentially expressed genes, generate hierarchical clusters, and perform principle component analysis. In order to visualize the reads representing the BART cDNA clone, reads that did not map to the human genome using TopHat were mapped the Akata genome using Bowtie. Aligned reads were
visual-ized using the Integrative Genomics Viewer (21). Enriched molecular
functions and potential upstream regulators for the AGS-EBV data set
on November 7, 2019 by guest
http://jvi.asm.org/
were obtained by running a core analysis on the differentially expressed genes using Ingenuity Pathway Analysis (IPA) software (Qiagen).
Luciferase assays.Cell lines were grown to confluence in six-well dishes and transfected with the appropriate vectors using Lipofectamine 3000 (Life Technologies, Inc.). At 48 h posttransfection, the cells were lysed and assayed using the dual-luciferase report assay system (Promega)
on a Glomax 96 instrument (Promega). For the myc activity assays, 2.7g
of the pBV-MBS1-4 reporter and 300 ng of the control pRL-SV40 vector
(Promega) were transfected into each well. For the 3=UTR assays, 500 ng
of the indicated psicheck2 vector was transfected into each well.
UPR assay.AGS or AGS-EBV cells were plated into six-well plates at a
density of 106cells per well 24 h before assay and cultured at 37°C. The
cells were treated with 40M, 200M, 1 mM, or 5 mM dithiothreitol
(DTT) for 4 h at 37°C and then harvested for RNA preparation using TRIzol reagent (Life Technologies, Inc.). An XBP1 splice isoform was assayed from each RNA sample by using reverse transcription-PCR (RT-PCR) with a Qiagen Quantifast One-Step RT-PCR system and the primers
5=XBP1 and 3=XBP1 (see Table S1 in the supplemental material). This
PCR generates a 249-bp product from the unspliced RNA and a 223-bp product from the spliced RNA. PCR fragments were resolved on an aga-rose gel to distinguish between these two sizes.
Western blotting.Protein lysates were prepared from cells, and
West-ern blot analysis was performed as previously described (22). Primary
antibodies used were mouse ␣-c-myc (Santa Cruz, sc-40) and rabbit
␣-GAPDH (Santa Cruz, sc-25778).
Quantitative RT-PCR.RNA was prepared from cell lines using TRIzol reagent (Life Technologies, Inc.). Quantitative RT-PCR was performed using the Quantifast SYBR green RT-PCR kit (Qiagen) on a QuantStudio 6 Flex real-time PCR system (Applied Biosystems) with primers designed for each gene tested. In order to detect the BART lncRNA, two sets of primers were designed: one that spans the exon 4-exon 5 junction (prim-ers exon4R and exon5aL) and one that spans the exon 6-exon 7 junction (primers exon6R and exon7aL) (see Table S1 in the supplemental mate-rial). In both cases, the specific PCR product was only detected in EBV-positive cells or cells containing the BART cDNA. RNA from specific cellular fractions was isolated by using a differential lysis technique,
fol-lowed by TRIzol prep, as previously described (12). The percentage of
transcript in the nucleus was calculated from the relative abundance ob-tained from cycle thresholds using quantitative RT-PCR from an equal volume of cytoplasmic and nuclear RNA. The primers to amplify specific human transcripts are listed in Table S1 in the supplemental material and are identified by the names of the respective genes. These primer pairs were designed with the help of the NCBI primer blast, and each span an exon-exon junction of the mature transcript and are predicted to have no off targets in the human transcriptome. In all cases the reported differen-tial expression is based on the differences in cycle threshold of control versus experimental, normalized to the differences in cycle threshold of a GAPDH reaction used as a control.
RESULTS
EBV effects on cellular expression.In order to better understand
the effects of latent EBV infection in epithelial cells, RNA-seq was used to obtain a complete transcriptional profile of both unin-fected and inunin-fected AGS cells. mRNA libraries were generated us-ing the Illumina TruSeq RNA prep kit to obtain libraries from RNA isolated from three preparations of uninfected AGS cells, one EBV-infected cell line obtained that has been previously
pro-filed by microarray (4), and two additional EBV-infected AGS cell
lines that have been recently generated (15). Sequence reads
gen-erated by paired-end, 100-bp sequencing on the Illumina HiSeq 2000 instrument were aligned to both the human (hg19) and the
Akata EBV (KC207813) genomes by using the splicing aware read
aligner Tophat. Human alignments were matched to annotated RefSeq transcripts using the Partek genomics suite software. It was
possible to align the vast majority of reads in this sequencing to the human genome and most of those reads mapped as pairs to RefSeq
transcripts (Table 1). Consistent with the fact that the infection in
these cells is mostly latent, only a small percentage of the mappable reads correspond to EBV, ranging from 0.19 to 0.48%. A recent report examining lytic induction of an EBV-positive Burkitt’s lymphoma cell line by RNA-seq suggested that lytic cells can pro-duce ca. 7% of the total sequence reads derived from the virus
(23), which would correspond to a background lytic activation of
around⬃5% if similar transcription levels occurred in lytic AGS
cells.
It is clear from the analysis of the RNA-seq results that latent infection with EBV reproducibly alters the transcription pattern of AGS cells. Principle component analysis revealed that the orig-inal AGS-EBV cell line obtained from the Hutt-Fletcher lab has a pattern of transcription that is distinct from the two AGS-EBV cell
lines generated more recently in our lab (Fig. 1A). This likely
re-flects the continuing clonal evolution that occurs in these cell lines during extended passage. However, hierarchical clustering re-vealed a large number of consistent changes were common to all three lines, indicating that latent EBV infection modulates host cell transcription, and the induced changes can be distinguished
from those that reflect clonal variation between cell lines (Fig. 1B).
After filtering out the lowest expressed transcripts, there were
1,514 genes upregulated and 715 genes downregulated with aP
value of⬍0.05 (Fig. 1B; see also Table S2 in the supplemental
material). Of these changes, 53 upregulated and 101
downregu-lated genes were changed⬎2-fold after EBV infection. The
tran-scriptional changes associated with EBV infection were enriched in genes with functions related to cell growth and proliferation,
cell death and survival, and gene expression (Fig. 1C). The changes
[image:3.585.298.544.77.299.2]in expression observed predicted that the infected cells would have an increase in proliferation and cell viability and a decrease in apoptosis and cell death, which is consistent with the increased
TABLE 1Summary of RNA-seq reads
Cell line
No. of reads
Total
Mapped to human
Aligned human
pairsa
AGS#1 42,799,160 39,755,541 17,974,295
AGS#2 61,878,112 57,253,646 25,869,971
AGS#3 52,469,526 48,625,673 21,987,733
AGS-EBV#1 49,800,978 45,650,825 20,641,133
AGS-EBV#2 62,470,636 59,981,567 27,159,052
AGS-EBV#3 64,846,600 57,285,114 25,909,124
pcDNA3#1 87,435,366 82,832,788 37,784,366
pcDNA3#2 75,886,016 71,854,311 32,795,626
pcDNA3#3 70,694,780 66,720,313 30,458,784
pcDNA3-BART#1 64,859,972 61,276,130 28,004,326
pcDNA3-BART#2 66,423,548 62,190,749 28,266,128
pcDNA3-BART#3 72,997,746 68,396,572 31,001,562
pCEP4#1 66,755,870 60,509,879 25,812,976
pCEP4#2 70,824,278 67,749,126 29,677,147
pCEP4#3 67,247,644 64,586,394 28,196,855
pCEP4-BART#1 49,707,074 46,745,211 20,092,075
pCEP4-BART#2 77,541,962 72,745,999 31,912,940
pCEP4-BART#3 51,382,276 48,593,505 21,287,109
aThat is, the number of read pairs that correctly align together on a known RefSeq
transcript.
on November 7, 2019 by guest
http://jvi.asm.org/
anchorage-independent growth previously observed in these cell
lines (4,15).
In order to determine whether the transcription changes were caused by a discrete subset of activators and/or repressors, the Ingenuity Pathway Analysis (IPA) software package was used to query possible upstream regulators that could account for these transcription changes. This analysis suggested that myc, the glu-cocorticoid receptor (NR3C1), and the insulin receptor were in-creased in activation and the stress response transcription factor XBP1, Rb, the inflammatory kinase MAP4K4, and the
transcrip-tion factor p8 (NUPR1) were decreased in activatranscrip-tion (Fig. 2A).
These predictions had highly significantPvalues, reflecting the
degree of overlap with the genes in the data set and significant Z
scores indicative of activation or repression. To confirm activation of the myc pathway, a luciferase reporter construct containing a 200-bp region of the CDK4 promoter with four myc binding sites was used to assess myc activity in the parental AGS line, as well as five independent clonal EBV-infected lines. As a control, the ac-tivity of the reporter construct with mutations of all four myc binding sites was also assessed. In four of the five lines tested (including lines 1 and 2, which were analyzed in the RNA-seq experiment), the myc activity was higher than in the parental
lines (Fig. 2B). Mutation of the myc sites greatly reduced the
reporter activity. The activation of myc occurred despite a mi-nor decrease in the transcription of the MYC gene (see Table S2 in the supplemental material) and without a statistically
signif-FIG 1RNA-seq analysis of AGS cells following EBV infection. (A) Principle component analysis of variation between all expressed transcripts from AGS cells.
The red circles represent three replicate libraries from the AGS parental cells, and the blue circles represent three libraries for independent AGS-EBV cell lines. The blue circle in the top left of the graph represents the original AGS-EBV cell line obtained from the Hutt-Fletcher lab, and the two blue circles at the bottom of the graph represent two independently generated clonal EBV-infected cell lines. (B) Hierarchical clustering of genes significantly changed by EBV infection.
The 2,229 genes significantly changed (P⬍0.05) after EBV infection were clustered independently. Red indicates expression higher than the mean of the six
libraries, and blue indicates expression lower than the mean. (C) IPA software was used to classify genes regulated by EBV infection into categories based on the
known molecular function of the genes. Graphed are categories that were highly enriched in the data sets, with the size of each bar corresponding to the⫺log of
thePvalue of enrichment. Green bars indicate that the function is predicted to be activated, and red bars indicate that the function is predicted to be inhibited
based on the pattern of expression of these genes. Black bars indicate that the function can be predicted to be neither activated nor inhibited based on the data.
on November 7, 2019 by guest
http://jvi.asm.org/
[image:4.585.42.533.67.471.2]icant increase in c-myc protein levels, as assessed by Western
blotting (Fig. 2CandD).
The IPA method also predicted that XBP1 is significantly in-hibited despite being expressed at equivalent levels according to the RNA-seq data. XBP1 is a key regulator of the unfolded protein response (UPR) and is regulated by a cytoplasmic splicing event upon endoplasmic reticulum (ER) stress that results in a
frame-shift and the production of a more active transcription factor (24).
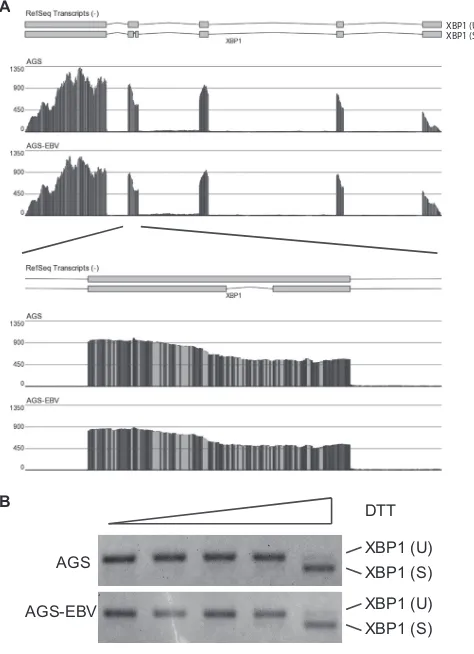
To determine whether EBV infection affected the production of the spliced isoform of XBP1, the RNA-seq reads were examined
across the locus (Fig. 3A). There was no decrease in reads across
the XBP1 alternative splice, suggesting that in both AGS and AGS-EBV cells XBP1 exists in the unspliced and less active isoform. However, the RNA-seq analysis indicated that a large number of the genes activated during the ER stress response are inhibited following EBV infection. To assess the effects of EBV infection on the ability of XBP1 to respond to ER stress, AGS or AGS-EBV cells were treated with increasing amounts of DTT to induce the UPR, and XBP1 splicing was monitored by RT-PCR. In this assay, EBV did not affect the ability of XBP1 to be activated in response to ER
stress (Fig. 3B). Taken together, these data suggest that although
many of transcriptional targets of the UPR are downregulated in
response to EBV infection, the mechanism of this downregulation is not the result of direct effects on XBP1 activation.
Potential effects of EBV miRNAs.AGS cells infected with EBV
express high levels of the BART miRNAs (15), and previous
pro-filing of one AGS line by microarray suggested that a substantial subset of the downregulated genes after latent infection were
di-rect targets of the BART miRNAs (4). To confirm that the BART
miRNAs contribute to the changes in gene expression profiled in the multiple infected cell lines in this report, the genes changed in expression were overlapped with the most extensive lists of BART miRNA targets published to date, where the BART miRNA targets were identified by PAR-CLIP in a peripheral effusion lymphoma cell line dually infected with EBV and KSHV, as well as the NPC
cell line C666 (25,26). A higher percentage of the downregulated
genes and a lower number of the upregulated genes overlapped with the PAR-CLIP data sets compared to the null hypothesis, which would be the percentage of all genes expressed in AGS cells (based on the RNA-seq data) that overlap the PAR-CLIP data set
(Fig. 4AandB). The decrease in expression is in accordance with
expected effects of miRNAs. To determine whether some of the downregulated genes were direct targets of miRNAs, the 3=UTRs of several genes were cloned into a luciferase reporter vector.
A
c-myc
GAPDH
C
AG
S
EBV
#1
EBV
#2
EBV
#3
EBV
#4
EBV
#5
Upstream Regulator
Activation Z-score
p-value of overlap
XBP1 -4.306 3.59E-10
INSR 3.267 3.12E-09
MAP4K4 -4.161 1.88E-07
MYC 4.032 8.46E-07
NR3C1 2.447 1.63E-05
NUPR1 -4.129 4.09E-05
IGF2 -2.401 2.93E-04
RB1 -2.798 7.68E-04
D
0.0 0.5 1.0 1.5 2.0
AGS EBV#1 EBV#2 EBV#3 EBV#4 EBV#5
c-myc levels relative to
A
G
S
c
el
ls
*
* 0
0.5 1 1.5 2 2.5 3
AGS EBV#1 EBV#2 EBV#3 EBV#4 EBV#5
F
ir
ef
ly
/Renilla Luciferase
WT
Mut
B
FIG 2Latent infection of AGS cells with EBV induces myc transcriptional activity. (A) IPA software was used to predict upstream regulators of the significantly
changed genes. ThePvalue of overlap is a measure of how likely the overlap between genes in the data set, and genes targeted by the upstream regulator occurred
at random. The activation Z score is an indication of whether the upstream regulator is activated or repressed based on the changes observed in the data set. The higher the absolute value of the Z score, the more likely the upstream regulator is affected, with positive Z scores indicating activation and negative Z scores
indicating inhibition. The list shown is the most significant upstream regulators based onPvalue that have a Z score of⬎2, which is a cutoff for statistical
significance. (B) AGS cells and five clonal AGS-EBV lines were transfected with a reporter with the four myc binding sites from the CDK4 promoter driving Firefly
luciferase (wt) or a control reporter in which all four sites have been mutated (mut). A plasmid expressingRenillaluciferase was used as a transfection control.
After 48 h, the cells were assessed for each luciferase activity, and the ratio of firefly/Renillaluciferase for the wt reporter in the parental AGS cells was set to 1. The
assay was performed six times for the wt reporter and three times for the mutant reporter, and the graph represents the mean value, with error bars indicating the standard errors of the mean (SEM). (C) Western blot showing the levels of c-myc protein in each of the cell lines in panel B with GAPDH levels assessed as a loading control. (D) The average result of four independent c-myc Westerns normalized to GAPDH is plotted as the expression relative to the AGS control cells.
Although there is a trend toward an increase in c-myc levels, none of these are statistically significant based on a one-samplettest. The asterisk represents attest
result ofP⫽0.10.
on November 7, 2019 by guest
http://jvi.asm.org/
[image:5.585.125.461.67.332.2]Given that the PAR-CLIP data set is derived from a very distinct cellular context and in order to potentially identify novel miRNA targets, a miRNA target prediction program (PITA) was also used to query the 3=UTRs from each downregulated gene against the top 15 BART miRNAs in terms of expression for predicted miRNA sites. From the resulting list of potential targets, the UTRs for nine genes (MXI1, GSTM, RASA1, CTNNA1, GPX2, DUSP6, PTPN6, JMY, and IER3) were cloned. CTNNA1, JMY, and IER3 were also identified as BART miRNA targets in the BC1 PAR-CLIP data set. These genes all have potential tumor suppressive func-tions, and thus downregulation might contribute to the increased
transformation phenotype of these cells (Table 2). Of these nine
selected genes, the 3=UTRs of eight of the genes, with the exception of RASA1, had significantly decreased activity in EBV-infected cells, although the results of IER3 fell just short of statistical
sig-nificance (Fig. 4C). These data indicate that the BART miRNAs
are likely responsible for some of the gene expression changes in
the EBV-infected AGS cells. Interestingly, MXI1 is a negative reg-ulator of myc, which may partially explain the activation of myc following EBV infection.
The spliced EBV BART RNA modulates cellular expression. Previous work has shown that the most abundant polyadenylated viral RNAs in EBV-positive gastric carcinoma samples are the
spliced BART transcripts (13), which are also expressed at high
levels in the AGS-EBV cells. Considerable evidence exists to
sug-gest that the BARTs do not encode proteins (27), and previous
studies have suggested that these transcripts are not exported to
the cytoplasm (8,12). However, these spliced transcripts from
which the primary miRNA sequences contained within the in-trons are removed are quite abundant and stably remain in the nucleus. These properties suggest that the BARTs possibly func-tion as noncoding RNAs in the nucleus, analogous to human lncRNAs. In order to determine whether the BART RNAs have a role independent of generation of miRNAs, a full-length cDNA clone was generated by overlap PCR from the longest BART cDNA successfully cloned from the C15 nasopharyngeal
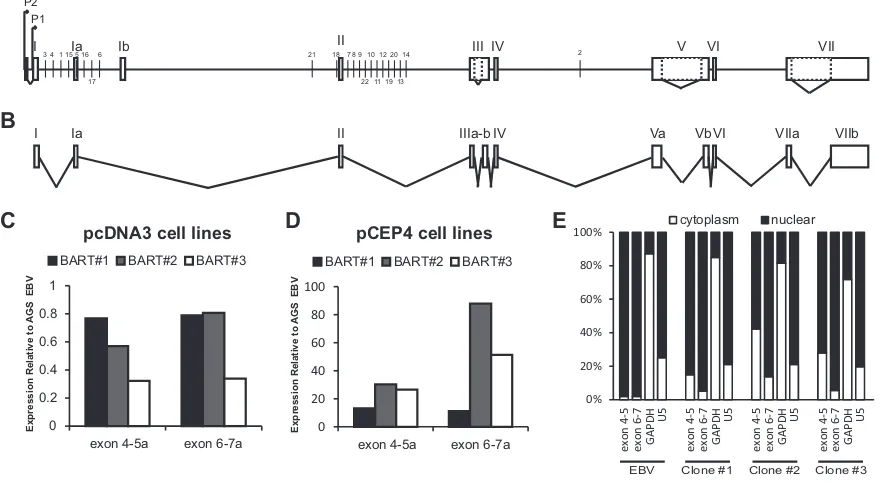
carci-noma xenograft (Fig. 5AandB) (12). This cDNA was repaired to
include the 3=sequences of exon 7 and the polyadenylation site
using Akata DNA. This full-length 2-kb cDNA corresponding to one possible isoform of the BARTs was cloned into the mamma-lian expression plasmid pcDNA3 and the EBNA1 based episomal
vector pCEP4 (Fig. 5AandB). Cell lines were generated by
select-ing for three independent stable integrations of the pcDNA3 vec-tors or three independent lines maintaining the episomal pCEP4-BART in AGS cells. Quantitative RT-PCR for the splices between exons 4-5 and exons 6-7a was used to determine the relative ex-pression of the BART cDNA. The pcDNA3 lines expressed the
BART cDNA to levels comparable to EBV-infected cells (Fig. 5C),
while the pCEP4 lines expressed higher levels than the
EBV-in-fected cells (Fig. 5D). Endogenous BART RNAs remain in the
nucleus; therefore, the localization of the expressed cDNA clones was determined by nuclear fractionation of cells, followed by RNA preparation and quantitative RT-PCR. Importantly, a majority of the expressed RNA remained in the nucleus at levels comparable
to the nuclear U5 RNA (Fig. 5E).
In order to determine the relative abundance of this particular BART isoform cloned from the cDNA in the AGS-EBV cells, the RNA-seq data aligned to the viral genome were analyzed for spliced reads. Because these data were generated from sequencing that cannot distinguish between strands, it is not possible to sep-arate reads that derived from the BART region from reads that represent the lytic transcripts on the opposite strand from the BARTs. However, by tallying the number of reads that span the various splice junctions possible among the BARTs, it is possible to determine the abundance of various splice isoforms of the tran-scripts. In AGS cells there is a large variety of splicing events that
occur at the 5=end of the transcripts, but starting with exon 3,
direct splicing of exon 3-4-5-6-7 appears to be by far the most
abundant splice isoform (Fig. 6A). The alternative splicing events
within exons 3, 5, and 7 that have been previously described (6)
were also detected, although at a much lower abundance (Fig. 6A).
These data are in good agreement with the previously published splicing analyses performed using EBV gastric carcinoma tumors and EBV-infected lymphocytes, suggesting that the splicing
pat-tern of the BARTs is relatively constant during EBV latency (13,
28). These data suggest that the cDNA clone that was generated
from the C15 tumor is also expressed in AGS-EBV cells, although XBP1 (U)
XBP1 (S) A
B
XBP1 (U)
XBP1 (S)
XBP1 (U)
XBP1 (S) AGS
AGS-EBV
DTT
FIG 3Regulation of XBP1 during EBV infection of AGS cells. (A) Graphical
representation of the numbers of reads aligned across the XBP1 locus from AGS and AGS-EBV cells. At the top is an illustration of the structure of the XBP1 transcripts, in which the first exon is on the right. The XBP1(S) isoform results from a cytoplasmic removal of 26 nucleotides from the fourth exon, as indicated. The number of reads spanning each nucleotide is represented by the height of the bar in the histogram, and the shading of the bar represents the nucleotide identity. The lower histogram is zoomed in on just exon 4 showing reads spanning the internal splice. (B) AGS or AGS-EBV cells were treated with
40M, 200M, 1 mM, or 5 mM DTT for 4 h. Cells were then harvested, and
the XBP1 splice isoform status was assessed by RT-PCR. The predicted sizes for XBP1(U) and XBP1(S) are indicated.
on November 7, 2019 by guest
http://jvi.asm.org/
[image:6.585.41.278.68.395.2]it is not the most abundant isoform. In order to predict what effect alternative splicing might have on the structure and thus the func-tion of the BART RNAs, the RNAfold webserver was used to gen-erate predicted structures for both the BART cDNA cloned for this study and the larger splice isoform that is most abundant based on RNA-seq and lacks the additional splicing within exons 3, 5, and 7
(Fig. 6B). The predicted structures suggest that the downstream
splicing events in exons 3, 5, and 7 do not have major effects on the
structure of the 5=region of the RNA, suggesting that common
functions for multiple splice isoforms may be possible. However, the additional sequences in the unspliced exons does dramatically
change the base pairing in the 3=region of the molecule,
suggest-ing that each splice isoform might have unique functions depen-dent on the distinct secondary structure.
As a first attempt to understand whether the BART RNAs have a function in addition to being the template for miRNA produc-tion, the six independently derived cell lines containing the BART
cDNA clone were subjected to RNA-seq, along with six empty vector control cell lines created in parallel. The use of six indepen-dently derived cell lines and six controls allows for considerable statistical power and enables the identification of changes due to the actual expression of the BART cDNA and not resulting from clonal variation. The sequencing was performed and analyzed identically to the EBV-infected cells, with the exception that the sequencing was 50-bp pair-end reads. The depth of coverage and percentage of reads aligning to the human reference genome were
very similar to the previous sequencing (Table 1). In order to
confirm expression of the full-length BART cDNA, the reads were also aligned to the Akata genome. The BART reads span the length of the clone as expected (see Fig. S1 in the supplemental material). Analysis of the differential expression of genes between these libraries indicated that the major factor influencing expression was the type of expression vector used, and the expression of the BART cDNA was identified as the second greatest variable.
How-A
C
0 0.5
1 1.5
2 2.5
3 3.5
4
Vector MXI1 GSTM RASA1 CTNNA1 GPX2 DUSP6 PTPN6 JMY IER3
R
e
nilla L
u
c
if
e
ra
s
e
/F
ir
e
fl
y
L
u
c
if
e
ra
se AGS
AGS-EBV
* **
**
*** ***
*** ***
*** 10%
15% 20% 25%
Down Up Not Changed
Overlap with
B
A
R
T
m
iR
N
A
t
a
rg
e
ts
Gene expression after EBV infection
BC1 PAR-CLIP OVERLAY
Observed
Expected
0% 5% 10% 15%
Down Up Not Changed
Overlap with
B
A
R
T
m
iR
N
A
target
s
Gene expression after EBV infection
C666 PAR-CLIP OVERLAY
Observed Expected
B
FIG 4BART miRNAs contribute to the downregulation of cellular gene expression. (A) Bar graph showing the percentages of genes that overlap between the
genes increased (Up), decreased (Down), or not changed after EBV infection and an experimentally determined set of BART miRNAs targets from BC1 cells. The overlapped observed is graphed in black, and the overlap expected if the BART miRNAs did not contribute to gene changes in graphed in white. This null
hypothesis expectation is the fraction of genes expressed in AGS cells (n⫽11,476) that also appear in the BART target data set (n⫽2,364), which is 20.6%. (B)
The same analysis performed from a BART miRNA target set from C666 cells. In this instance, there were 866 targets expressed in AGS cells, and thus the null
hypothesis is 7.6%. (C) A 3=UTR luciferase reporter assay was performed. The entire 3=UTR for each of the indicated genes was cloned onto the coding sequence
ofRenillaluciferase in the psicheck2 vector, which also contains the firefly luciferase gene expressed as a separate transcript. Each resulting vector was transfected
into AGS and AGS-EBV cells, and the activity ofRenilla/firefly luciferase was measured at 48 h posttransfection. Plotted is the mean of three independent
transfections, normalized to the ratio obtained from an empty vector in each cell line. The error bar represents the SEM. The asterisks refer to the results of a
Studentttest between the AGS and AGS-EBV samples (*,P⬍0.05; **,P⬍0.01; ***,P⬍0.001). The IER3 assay had aPvalue of 0.055.
on November 7, 2019 by guest
http://jvi.asm.org/
[image:7.585.139.457.70.414.2]ever, one pair of pCEP4 control and BART libraries was
signifi-cantly different from all of the others (Fig. 7A). For subsequent
analysis, these outliers were excluded, and the five remaining BART expressing cell lines were compared to the corresponding controls. Principle component analysis indicated that PC1
repre-senting 46.2% of the variation between these 10 libraries was ac-counted for by the difference between the integrating and epi-somal vectors; however, PC2 representing 23.3% of the variation
was directly due to BART cDNA expression (Fig. 7B). The large
[image:8.585.38.546.77.269.2]differences between the integrating versus episomal vectors is
TABLE 2Predicted BART miRNA targets downregulated in AGS-EBV cells
Gene
RNA-seq fold change
Predicted site(s)a
Fold 3=UTR reporter
activity in AGS-EBV
compared to AGS Role as a tumor suppressor
PITA-predicted miRNA target sites
PAR-CLIP-predicted miRNA
target sitesb
MXI1 –1.19 BART 22-3p (7), BART19-3p (10) 0.81 Negative regulator of myc
GSTM –1.21 BART10-3p (2) 0.73 Detoxification of carcinogens
RASA1 –1.07 BART10-3p (2) 1.94 Negative regulator of ras
CTNNA1 –1.22 BART12-3p (34) BART5-5p (4) 0.78 Inherited mutation leads to gastric cancer
GPX2 –3.12 BART17-5p (8) 0.74 Prevents inflammation dependent
tumors in gastric epithelium
DUSP6 –1.20 BART11-3p (9) 0.64 Negative regulator of ERK, activated by
p53
PTPN6 –1.11 BART6-3p (6) 0.76 Negative regulator of tyrosine kinase
signaling
JMY –1.31 BART9-5p (5), BART19-3p (7),
BART17-5p (8), BART11-3p (9), BART2-5p (17)
BART10-3p (2), BART5-5p (4), BART17-5p (8), BART18-3p (10), BART19-3p (13)
0.68 Coactivator of p53, helps integrate actin
dynamics and adherens junctions to p53 function
IER3 –1.45 BART17-3p (14) BART2-3p (42) 0.89 Stress-inducible gene that can
downregulated NFB, ERK, and Akt
aNumbers in parentheses represent the rank in terms of BART miRNA abundance in AGS-EBV cells according to previously published miRNA sequencing data (15).
b
PAR-CLIP predicted BART targets, as determined previously (23).
I Ia Ib II III IV V VI VII
P1 P2
2 14
13 20 19 12 11 10 9 8 7
22 18 21 3 4 1 15 5 16
17 6
I Ia II IIIa-b IV Va VbVI VIIa VIIb
A
B
C
0 0.2 0.4 0.6 0.8 1
exon 4-5a exon 6-7a
Expression R
el
at
iv
e
to
A
G
S
-EB
V
BART#1 BART#2 BART#3
0 20 40 60 80 100
exon 4-5a exon 6-7a
Expression R
el
at
iv
e
to
A
G
S
-EB
V
BART#1 BART#2 BART#3
D
pcDNA3 cell lines pCEP4 cell lines
EBV Clone #1 Clone #2 Clone #3
0% 20% 40% 60% 80% 100%
ex
on
4-5
ex
on
6-7
GAPD
H U5
ex
on
4-5
ex
on
6-7
GAPD
H U5
ex
on
4-5
ex
on
6-7
GAPD
H U5
ex
on
4-5
ex
on
6-7
GAPD
H U5
cytoplasm nuclear
E
FIG 5Expression of a Full Length BART cDNA. (A) Diagram of the BART locus. (B) Exon structure of the BART cDNA cloned into pcDNA3 and pCEP4 vector.
(C) Expression of the BART cDNA clone in three independently derived, pcDNA3-based, stable AGS cell lines. Expression is measured by quantitative RT-PCR using primers that span the exon 4-5 or exon 6-7 junctions and is expressed relative the same PCR performed from AGS-EBV cells. (D) Expression of the BART cDNA from three independently selected cultures of AGS cells containing the episomal pCEP4-BART vectors. PCR was performed as described for panel C. (E) Nuclear fractionation of pcDNA3 stable lines to determine the localization of the expressed BART. Cells were fractionated into nuclei and cytoplasm, and RNA was prepared from both samples and subjected to quantitative RT-PCR using the same primers as in panels C and D, as well as primers recognizing GAPDH mRNA and the nuclear RNA U5 as controls. The results are expressed as the percentage of the PCR product derived from each of the fraction. As a control, AGS-EBV cells were also fractionated and show the expected localization of the BARTs and U5 in the nucleus and GAPDH mRNA in the cytoplasm.
on November 7, 2019 by guest
http://jvi.asm.org/
[image:8.585.69.516.399.643.2]likely due to multiple changes in the transcriptional profile that occur during selection of stable lines, as well as the fact the pCEP4 vectors also express EBNA1, which likely also mediates some ef-fects on cellular transcription. However, the use of multiple cell
lines for each type of vector allows us to isolate the consistent changes are solely dependent upon BART expression.
Analysis of both the integrating and the episomal cell lines revealed that the BART cDNA was responsible for a considerable
I Ia Ib II III IV V VI VII
P1 P2
{
Cluster I Cluster II
{
BART2
26, 7, 23 66, 48, 76
89, 71, 104
77, 34, 79
138, 99, 146 204, 124, 157
10, 3, 1
1, 2, 2
5, 3, 0 5, 7, 5
5, 4, 0 6, 0, 6 10, 3, 3 5, 8, 9
14, 12, 7 5, 0, 5 1, 3, 2
G T T GC CA T TT TT C A A GCTG CTGAAACACC AGT G GC A GC A GG C C T A A G A A G C T C CT C A G C A A C A T GGAGAC C T C G AAGGG AA A C T G G CA G GA G CA G G GAG
TCACGT AGGC AC T AG CC TCTTCA CG T GA GTC AC GACC CC AC CG AA CC AG GCAT GA TG TAGAGTA
A A A T TT TATGC AT CG T CT T C TAA T CTG T G CC G C T TGG A G GGA A A C AT G A CC A C C TGAAGTC T G T T A ACC AGATGC C GT T G A A T GT G TCACTGAGCTGAA
TT TG G AC G C A G C T A C T T G A C C T T T G C CC C CG TG C CTC C AG CG CT GA T A AGT G C T GC GT C C A C TT TG T GT T AC AG GTC C GG CGTGTCCA
CGGA GACTCGGA
CGTAGCCCT
TAC CGCGGCGTAT
GG CG TT G A C C GG A C AC A CC T T C CC CGGGAA TGT GTGAATACGGG
CGTATGCTTTAGAAAA
TGGGGGGCTG
T GC T GC GC CA GC AGGCT GCGCGGATTCAGGACGCT T AG CA CGATGTCCTG GT C AGA G T GCAATA C G AAG A A G GG C T T G A G G A A TACCTCGTTGTCTTCCGCTC
C A A A G A ACAAGACAACGAC C G T A A A GTAGCGGCTGCCGTAGGTGGTC
GTGATTG A G G AG AAAGAAGTGCCGGG CAGGC
GGCGGA GGCTG
TTCCCGCGATGAA A G CG C C G G G A C G C T A G T G C T G C A T G G G C T C C T C C G G G G T A A G C T T C G G C C
ATGGCCGGAGCTCGTCGACGGGCAAGGTGCCCAGCGTCAGCAGTGACGCCTGATAGCGCCCGGCCTCCACCCCTGGCTTC CAGAGGATATCGGATGC A G AATCAGACGC AGG
CATGTT GCT GAGCGAGCTC GT C G A TC C T GG GGTA G GG C A T CT G CAC T GG C T GCT G CG A C A T C T GG C GC G T G C GC C T C G T G A GG G A A A T A A CC AGGATCACCACC
CCCGCCACCAGGACCAGA AT G A GCAGATAGGCCTGCTTCGAAGGGTT AAGGAGGAAT AACCACTGGAGACCGGA C TA AA CA A AC C CCCC ACC G TGC T GA CTAG GCCGG CGA
TGTTTTGCGCCTGG A A GTTGTACTCCC
GG AAG ATGCCCTC
CAGGTCAAAGACGTTGGAGGCACGC TG TTCGTCC CGC CC TC C GTGTG AT TC TC CC GC GT GCCAAACGAGG GACAGCT GATGTCC GA GGAG AA GC GGAA CA GG TCGCCATGGCTGGAGAGCT
C G C A G A C T C GG AAAGG AAAGCTGGTTT
GC TGACGC G T GG CG GATGGCCCG GTACTGG GGGT GCGCCGTGA AG GCGGGGCGCCTCCGCGTCA TCA GC GC CT C CA C CGCGTC
GCCCGAGGAGCTGTAGACCCCGCCG CA G AA G A GC C G C T C C G T G G C C C C GG G AG CC AC GGCG TCAAACAGGTG
AGTCAGTTCC G C C CC C G CCAGCGCCTCC
TCGCAGGCC CC CCGCACC
AGGGCCAGGCGACGCTCCCGGGCAAACAGG GCAG
A GAGGCGG GAATCGG C G C CACCC T CC C CC T G C C C C G T T G CA C C GA T A G CATGGCCGAGAGTTCCCCGACTCGACAATAGGAG
GA GC T CC G C C A C C T C C G G G G G C AC T GT C G A GA A GA C G T T GTAGGTGTCCAGCGCCGCCCCCTCTGCCTCCACGGGCCCCGGGTCCT CCTCTGGCTGCTGCGCGGCCGCCC
GGCCGCCCGGCC T CGCCTTCTCCTCAGCCTCCAACAGGTGCCCGA
GC C
CCGCCTGGCGGAC TT CATTCTCACCGAGGCTCCGGATGCTCAAGCCAA
T C A C C G G CAC C G C C A G G T G GTTAGGCA AGACGGGGT T CCCCCCGT C CGTGGAAGGGTTGCCGTGGTTGG
GC A GA A C C A T C A G C T C G CC C A CAC A G C G CCAGC A G G G C A C A G A G G T G A T G TA G A G G C G C GG GT C T G G GA TGGGACCCCGCATT C GAA AGC G G C C C A G CA G A TC CA G G G C C C G T T C C AG G C T C T C C A G C C CC A T G G T GTGAGACATGCAATA
AA A EXON 1 EXON 1A EXON 2 EXON 3A EXON 3B EXON 4 EXON 5A EXON 5B
EXON 6EXON 7A
EXON 7B
G UU GCCAU UUUUCA A G CU GC UA AAC C A C GAGAUGGCAGC G G CC UAA GA A G CU CC UC A GC A AC A UG GA G A C CU C G AA
G GG A A AC UG GC AG GAG CA GG GAGUC A CG U AG GC AC UA GCCUC UU CAC GUGA G UCACGA C C CCA C CGAAC C A GGC AUG AUGU AGAAGU A A A U U U UACUGUCAUCG
U U C UAAUCUGUGCC
GCUUGG AGGGA AACAUG ACCACCUG
AAGU CU G UU AAC CAG AU GC CGUU GA A U G U G U C A C U G A G C U G A A U U U G G A C G C A G C U A CUUGUCAC U U G C C C C C G U G C C U C C A G C G C U G A U A A G U G C U G C G U C C A C U U U G U G U U A C A G G U C C GGCGUGU
CCACGG AGACUCGG
ACGU AGC CCUUA C CGCGG CG U AUGG C G U U G A C C G G A C A C A C C U U C C C C GGGAAUGUG
UG A A UACGGG CG U A U G ACUUUAGAAAUG
GG GG CG UGUG CUGC GC CAGCAGGU
AAGG C AG GC AC U C GUCCUGG
CUGGUG ACGGGA G AG C CA C U G A G G A A GAUC U GGGGCU CGCUGG UGUUUA G CUUGUCCC CGCUCUGGG UGCA G G A G C GUGUCAAGUGCA U GUC G C U C U GC C C G G GC A G A A U C U G C A G G U A G A G G U A G G G G U U C U U G A C CAACU U G A U G G G C A C A AUGU ACCAGGUA AACUUCCCU UUCUCUAU G AACAGGCUG
CGCGGACUU A G G A C G C U U A G C ACGAUGUC CUGGUCAG
AGUGGGGAAGAACAUAAC GC U U G A G G A A UACCUCGUUGUCUU
CCGCAGUCCAAA A CAAGCCAAAACGC GU A A A GUAGCGGCUGCCGUAGGU
GGUCGUG UUGAAG
GAGAAAGAAG
UGGGCC GC AGGCG
GCGGA GGCUG U UC C UGAACGCA G A G CG C C G G GA C G C U AG U G C U G C A U G G G C U C C U C C G G G GU A A G C U U C G G C C A UGGCCGGAG
CUCGUCGACGGGCAAGGUGCCCAGCGUCAGCAGUGA GCGCCUAUAGCGCCCGGCCUCCUCCCCUGUCG
ACCAG
AGGACGCAGG AUAUCU GCAGG AU C A GGUCAGCCU
CGU UGG UGGCCGU G G G G A A G C CCUCCUCCCCCAUAUCGAAGGCCACACUAGGC
AGGGCCUGGU
AGGAGG GCCAG GAGC U G U C U U C A C G C C G G A CC G A G A G G U C G CCCACCUCACAUGCAGUC U C G A GCUCGGCGUACGAGUCCCGGUGCUGGAGGCGGGGGAUGG CGCGGC GGCAGC UGUAC CAGCCAAAGGU
GACAAAGCAU U U GU C C AG G A C AA AGC G GC G C G U G G CAUC C A C G UU G G C C UC AA A G A UC C GA C A CCCGUGCUUGUCGGAUGGUGUUCUUGCAUCUGCCACGAUGGGGAGGAUGGCCAGUGAGGGUUGCACACCGUGUAAC
C C G G C A U G GUU G C C G U A GCC C A U AAUGGACCAAGACGGGCCCCACUGCGUGACUUCC
C G G CAGGGGGUCCUGCGGU
CGAAGGUGCGCGUC U UG A GG G C G C UG A G G A C UGCAAACUCCACGUCCCCCAGA U G AG G C GCG C U G G C GU A G AAGUAGGCCUGCU
GCCCAACACUACACUG A C A CA C G C U G GC C C CAUCGGGCGCCCUUGCG C C C AG U AG C U UG A UGACGAUGUUAUCCUCCAGCUCAUGAUGGACCACGGCAUCCACAAUG
A CGGCGCAUUUCUCGUGCGUGUACAGAGGCUAUGUUCGGGAGCCCGUAGACAAUGCGUACUUCCGCAU
GUGGGUGU CUG CCUCCGGCCUUCUUGCCUGCCGGCGGUCACG
CUGGCGCCAGUCUCACCCACAUGCCAUUCUUCCC CCCCCCACGACCC UCA G GG AGU C UUG G UA G AAG C A C AGGGGG GGC UGAGGCCCCCGCACAU
CCACCACCCCUGCGGCGCCUG GUGUCUGG AA A C ACU UG G GAA UGA GA C GCAGGUACUCCUUGUC
AGGCUUU UUCAUGAACCGG U UAUUAGGUCUU
A GGAAAGGGUUAGAAU
AGAGUCCCCCA GACAUGGUUAAA ACUCAGU
CUCUGCCUCCCCAAGCAGUGC G GCGGCGGUC
UCUGGAUCGUGAUAGCGUCUUCUGCGU AGGC
CUGGAAAA CGGUCCCUGG
C UGCCUGCAAUGCU CUGCUGGCCA
CUGAGGGU CCGGCCCUCUCCGGAGCUGC
UCUCUUUUGCUCCU GGU UU UG CU CAUG CA GC GC UA ACAUGAUGGCUUGUAACUUACUUUCUGUAUGGGAUUAAUAGCCUGGA
CCCUCCCAAGGCAUAG GU UG CU GA GC GAGCUCGUCGAUC
CUGGGGUAGGG CAUCUGCACU
GGCUGC UGCGAC AUCUGG CGCG UGCGCC UCGUGA GGGAAA UA A CCA GG AUCACACCCCCCG
CCACCA GG A C CAGAAUGAGCAUG
CCGCCG A A G GG UUUUUGA A GA AGGAGAUAAGA
C CAGA GACCAGGCUG
CUAAACAAA CCCCCCACCG UGCUG
AC U AG
GCCGGCGA UGUUUU GCGCCUGGA
AGUUGUACU CCCGGAGAA UGCC C U CC AGG UC A AAG AC GUU GG A GGCACGCUGUUCGUCCC GC CCUCC GUGUGAUU
CUCCCGCGU GCCACGAAA G GG ACACU GG AUG UC CGA G GA GA A GC GG AA CA GG UCGC C AUG GCU GGAGAGCUCGCAGAC
UCGG AAAGGAAUCGA GG UU UG CU GAC GC G UG GC GG UAG GC UGC ACCG UG GU GGC GG GG GGUGCGGGCU GCUCUG GGGUCUG
CGCACCGGCAAG GC ACG C C A GG G CG G CUA GC AGCACGACCACGC
UUAGCACGACUCC CC G A G UC A U CU CU CA UUUGG AG GU GCAGGUACCACCCCCUGCGAGAAUAAUAAGGGUCAUAUACCUAG
CCCUUUGAAAUACAAGA U AG G G G GC G GU CA GA GU CG UACGUGAGGAGCCCAUCAAUCGGGGGCA
GGGCC UGGCCGGGGCUGACCG
CGUCCGCCCGGCGCAGGA UCAAGGGGACCACCGCCC U C U U GU U GUA G A G G G A CA C GG UUA G G AC G G C C U C GC G C A GC G C CCGGCACAAAG UUUGCUGGCUAGAAGUGACCGU G C C C C C G GG UACGCUGUAGAAGCUGUU GAAGGAGGUCUCUAUC CAGUCGCUCCUCGG G A U GCCUGGCCAUAUCAG
G G A AG U C A G GA A U G C C U U C UG GU G GG G C A G C GU A CC UG C G G C G UCACAGCAGCG
AGCCAGCCGG AC G U U G C U GGGUGGGGGAAAGAGCCCGCCGCCUCCUCUC A GG G G CC CCGUGAUGAAG GUGUACAGGGCGUGUC U C A GCG C G U GC A G GU G CU CCG A G C UC A G G G U CUGGGUAAACAGGUGUGUUUGAUGUAU
CUUGGAAUUAAACUC GG CGGCACCCCCGCU G G C G C G C C U G UC C UC C C AGGGA
CCCGAGACGAAGGCCCGUCUGUAGAGGAAGUGGUUGCGCAUGGACUGGCUCUGGCAGACGCGCCAGGGAACCCCCCUGCACCAGAUGAGCGGGCCACCCUCG G U C U CGCUCUGUUG C G C CA G G C AG G AC U G C AG C U U GG C CA G A C C CU C G G UG G C C AC C U G G C GC A G G UACUGCUCUC UGCGCUGCGAUG C GUCCGAGAGG GCGCCGGACGGGCCGGGCUCU C G UG C C C C A GC C G G C C G G G G CA C C U C C G G G C U CUC C C G GG A CG CC U C C U C CU C G CC UCGGCCCGAGUCAACUGCGCUGGCUCCAUGG C GC GUGUACAGCUCG
UU CCUCUUUGGAAGCUGGCCCU
GGUACUGGGGGUGCGCCGU GAAUCGGCCGCGGCGGGUCAGCC UC A G C G C C U C CA C C G C G U CG C C C G A GG A G C U G U A GA CC C C G CC G C AG A A G AG CC G C UCCGUCACGGCCCGAGGCCG G G C GU CAA AC A G GUG A G UC AG CCUU GCCCC CGC CAG CG CC UC CUCGAC GG CC CC C CG C ACC AG GG C CA GGCGA C GCUCCCGGGCAA
ACAGGGCAGA GAGGCGG
GAAGUG C C GC C A CC CU C CC CCU G CC C CG U U GC AC CG A UA GC A UG GC CG CCAG AGUUCCA AU A G AGG AG C UC C GA GAGC UC CGCCACCUC
C GGG G G CA C UGUCGA
G A AGA CG U UG UA GG UG UC CA G CG CU CU GG UC GCCCCC U C U GC CUC CGG CCG CC C C
GGGCCCGGGACCGC GCCCUCCU
CUGGGCCGCCCGGCCUCGCCUUCUCCUAGCCUCCCAACAGGU GCCCGA GC CCC
GC CUGGCGGACUUCAUUCUAACA
C A G U C CCGAG A CC GGC UCCGGUAU C AC C GG CACCGCCA GGU GG UUA C AGGAGA CGU G GG UC CC C C CU GCCGUGGAAGGGUUGCC
GUGGUUCGGG A GAA CCA UCAG CUC G CCC AC AC AG CGCCAGAGGC GCAC AGA GGU G A UG UAGA G G CGC GG GUC U GGG A UG GGACU U A C GCCCCGAAAGC
GGC CCA G CAGA UCCA G G GC CC G UU CC AG GCU CU CC AGCC C CAU GGU G UG AG AC AU GC AA UAA A A EXON 1 EXON 1A EXON 2 EXON 3 EXON 4 EXON 5 EXON 6 EXON 7
A
B
FIG 6Splicing pattern of the BARTs obtained from RNA-seq. (A) Diagram of the BARTs drawn to scale, with boxes indicating exons and a connecting line
indicating introns. The positions of the BART miRNAs are indicated by red vertical lines. Dotted lines within the exon boxes indicate alternative splicing events. Indicated below are the number of reads that span exon-exon junctions in each of the three libraries of AGS-EBV cells. These data suggest that the most common splicing pattern for the BARTs includes exons 1, 2, 3, 4, 5, 6, and 7 without the alternative splicing events that occur within exons 3, 5, and 7. It also suggests that there is much greater variation in the splicing pattern near the N terminus of the transcripts. Only splicing events that occurred at least five times across the three libraries are illustrated. (B) The RNAfold Webserver was used to generate minimum free energy predicted structures for the RNA encoded by the BART cDNA cloned in this study (left) and a BART RNA without alternative splicing in exons 3, 5, and 7 (right). Nucleotides are color coded by exon as indicated in order to better visualize from which part of the RNA the particular secondary structures are derived.