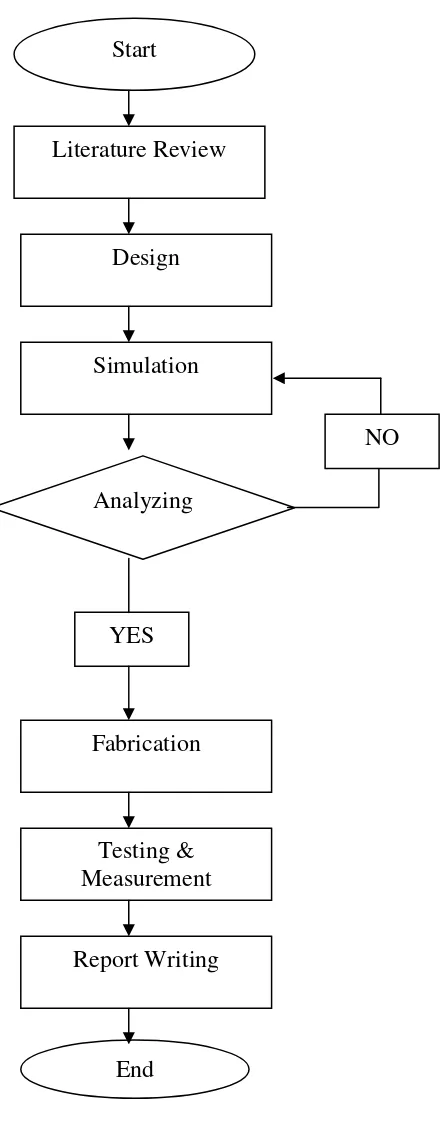
Log Periodic Antenna Design
Full text
Figure

Related documents
In Figure 3 is shown the graphical comparison between the measured values of the mean integral stress (the broken line), and the ones computed (straight lines) with the
Cotransduction and donor phenotype selection: I n a qualitative survey, a large number of auxotrophs were transduced with phage preparations of two mutants from each
The main objective of the study is to compare both in sample and out of sample forecasting performance between three univariate models (ARIMA, SARIMA, SCARIMA) used to
Prevalence and sequence analysis of equid herpesviruses from the respiratory tract of Polish horses RESEARCH Open Access Prevalence and sequence analysis of equid herpesviruses from
EURASIP Journal on Applied Signal Processing 2004 4, 522?529 c? 2004 Hindawi Publishing Corporation Optimization of Color Conversion for Face Recognition Creed F Jones III
LETTER Earth Planets Space, 60, 1075?1080, 2008 Coseismic deformation due to the 2007 Chuetsu oki earthquake (Mw = 6 8) Yosuke Aoki1, Masato Furuya2, and Teruyuki Kato1 1Earthquake
ST : Each boxplot represents the distribution of multilocus F ST estimates across all pairwise comparisons in an island model with n d ¼ 8 demes and across 50 independent replicates
(a) FE mesh of modified extended end plate connection (8EMH-W) with heat- treatment and web stiffener (b) Equivalent plastic strain contour plot showing formation of plastic hinge