during HIV-1 Infection Alter Overall Rev-RRE Activity and Rev
Multimerization
Emily A. Sloan,aMary F. Kearney,bLaurie R. Gray,aKathryn Anastos,cEric S. Daar,dJoseph Margolick,eFrank Maldarelli,b Marie-Louise Hammarskjold,aDavid Rekosha
Department of Microbiology, Immunology and Cancer Biology and The Myles H. Thaler Center for AIDS and Human Retrovirus Research, University of Virginia, Charlottesville, Virginia, USAa; HIV Drug Resistance Program, National Cancer Institute, Frederick, Maryland, USAb; Albert Einstein College of Medicine and Montefiore
Medical Center, Department of Medicine, Bronx, New York, USAc; Los Angeles Biomedical Research Institute at Harbor-UCLA Medical Center, Torrance, California, USAd;
Johns Hopkins Bloomberg School of Public, Baltimore, Maryland, USAe
HIV-1 Rev and the Rev response element (RRE) enable a critical step in the viral replication cycle by facilitating the nuclear ex-port of intron-containing mRNAs, yet their activities have rarely been analyzed in natural infections. This study characterized their genetic and functional variation in a small cohort of HIV-infected individuals. Multiple Rev and RRE sequences were ob-tained using single-genome sequencing (SGS) of plasma samples collected within 6 months after seroconversion and at a later time. This allowed the identification of cognate sequences that were linkedin vivoin the same viral genome and acted together as a functional unit. Phylogenetic analyses of these sequences indicated that 4/5 infections were founded by a single transmission event. Rev and RRE variants from each time point were subjected to functional analysis as both cognate pairs and as individual components. While a range of Rev-RRE activities were seen, the activity of cognate pairs from a single time point clustered to a discrete level, which was termed the set point. In 3/5 patients, this set point changed significantly over the time period studied. In all patients, RRE activity was more sensitive to sequence variation than Rev activity and acted as the primary driver of the cog-nate set point. Selected patient RREs were also shown to have differences in Rev multimerization using gel shift binding assays. Thus, rather than acting as a simple on-off switch or maintaining a constant level of activity throughout infection, the Rev-RRE system can fluctuate, presumably to control replication.
I
nfection with HIV most often results from the transmission of a single viral particle, as evident from analysis ofenv,gag, andpolgene sequences in acutely infected individuals (1–6). Population-level analysis has shown that single-variant HIV infections have low sequence diversity at early time points after seroconversion (7–10), but that multiple sequence variants arise over time to form a quasispecies. Various selective pressures, including antibody and cytotoxic-T-lymphocyte (CTL) immune-mediated responses (11–16) and other less well-defined viral and host characteristics, appear to drive the expansion and contraction of HIV subpopula-tions throughout infection. Single-genome sequencing (SGS) tech-niques have been used to determine the evolution ofenvandgag
genes (both of which encode structural components of the virus) during infection (3,4,6,16). However, few reports have examined how other HIV genes, such as the essential regulatory generev, evolve. Therevgene product (Rev) acts at the posttranscriptional level to mediate the expression of viral genomic RNA and singly spliced mRNAs that encode many of the viral proteins (for reviews, see references17and18). These mRNAs all retain introns and would be expected to be restricted in their nucleocytoplasmic export. However, the Rev protein functions as a bridge between the cellu-lar export machinery and the viral RNA by binding and multim-erizing onto the viral Rev response element (RRE). This process allows export and expression. The RRE is an⬃350-nucleotide (nt) sequence located within theenvcoding region that is present on the HIV intron-retaining mRNAs. It serves as a scaffold for the cooperative assembly of multiple Rev molecules (19). The result-ing complex recruits the cellular export factor Crm1 as well as Ran GTP, enabling nucleocytoplasmic export and expression (20).
Most experiments measuring Rev or RRE function have uti-lized sequences derived from laboratory-adapted HIV strains (21). Some have demonstrated that point mutations in the RRE, outside the primary Rev binding site, can alter the overall RRE structure and have functional effects (22–24). Similarly, muta-tions in the Rev coding sequence outside known functional do-mains can influence the activity (25,26). Thus, as HIV evolves in an infected individual, small changes in Rev, RRE, or both may act to change overall Rev-RRE activity.
An elegant example of the correlation between Rev variation and disease progression during lentivirus infection comes from experiments with equine infectious anemia virus (EIAV) (27–29). Results from these studies showed that at least two different sub-populations of EIAV Rev existed during infection of ponies, and over time they alternated in predominance. This “cycling” of Rev sequences was coincident with changes in clinical disease and viremia (28). Transient expression assays indicated that the Rev populations differed significantly in their nuclear export activity. While disease progression in EIAV in ponies is different from that
Received28 May 2013Accepted31 July 2013
Published ahead of print7 August 2013
Address correspondence to David Rekosh, [email protected].
Supplemental material for this article may be found athttp://dx.doi.org/10.1128 /JVI.01392-13.
Copyright © 2013, American Society for Microbiology. All Rights Reserved.
doi:10.1128/JVI.01392-13
on November 7, 2019 by guest
http://jvi.asm.org/
of HIV in humans, these studies provide additional evidence that changes in Rev function is a contributing factor to variation in disease state. However, these studies are incomplete, as they did not take into account any effects that changes in the RRE might have on the overall Rev-RRE activity.
Only one group has studied both Rev and RRE sequence vari-ation longitudinally in individual patients. RRE variants were ob-tained from 10 patients in Thailand infected with the recombinant subtype CRF01_AE, and these were observed to have differential activities when paired with a control Rev (30). The difference was maintained when the patient’s own Rev was used. RRE functional variation was also studied in a longitudinal cohort (31), where it was shown that the slower-progressing patients had a higher fre-quency of RREs with low to moderate activity. In contrast, the faster-progressing patients had more RREs with higher activities. These data suggest that RRE heterogeneity is an important factor in viral pathogenesis and disease progression.
The current work was carried out to better characterize the sequence and functional evolution of Rev and RRE populations obtained from individual HIV infections. The use of SGS enabled the identification of cognate Rev-RRE sequences from the same viral genome. Taken together, our results showed that each patient had an initial set point of Rev-RRE activity, and that this activity changed over the course of the infection, primarily due to muta-tions in the RRE. In at least one case, limited changes in the RRE affected Rev multimerization. From these studies, we conclude that variation in Rev and RRE sequences during natural infection can result in significant functional differences, and that these changes may influence viral replication and pathogenesis.
MATERIALS AND METHODS
Clinical samples and ethics statement.All studies were approved by the institutional review board of NIAID, NIH, Bethesda, MD, or by the insti-tutional review board at Montefiore Hospital, Bronx, NY, as part of the Women’s Interagency HIV Study, and all study subjects provided written informed consent.
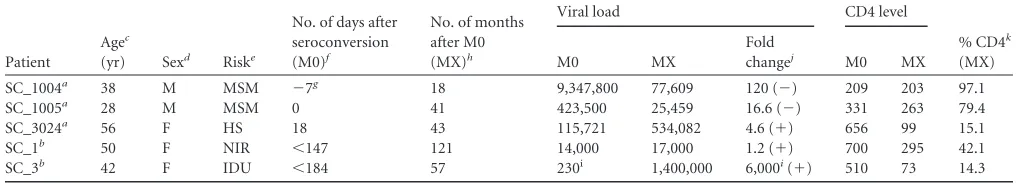
Plasma samples (n⫽10) were obtained from 5 patients (2 male/3 female). For each patient, the first available HIV-positive sample (month 0 [M0]) and a second sample, collected at a later date (month X [MX]; 18 to 121 months postseroconversion), were studied. Specimens from three patients (1004, 1005, and 3024) were obtained through the National Can-cer Institute/National Institutes of Health Drug Resistance Program from Mary Kearney, who originally received the samples from Johns Hopkins and UCLA as previously described (3). Specimens from 2 patients (SC1 and SC3) were obtained through the Women’s Interagency HIV Study (WIHS) Consortium, Bronx, NY (Kathryn Anastos, principal investiga-tor). For each patient, the last negative enzyme-linked immunosorbent assay (ELISA) was within 6 months or less from the M0 sample analyzed. All patients were naive to antiretroviral therapy (ART) with the exception of SC1, who underwent a variable course of treatment during the study period. This patient initiated ART at 1 year postseroconversion and re-mained on therapy for 3.5 years. She then discontinued drug therapy for 4 years. Highly active ART (HAART) therapy was then started but discon-tinued use after 6 months, and finally it was resumed 1.5 years later for the duration of the study period.
Viral RNA extraction and cDNA synthesis.HIV RNA was extracted from one ml of plasma using a guanidinium extraction method as previ-ously described (32). For samples that had viral loads of⬍30,000, a total volume of 1.5 ml plasma was used for extraction. Viral RNA pellets were resuspended in 40l of 5 mM Tris-HCl, pH 8.0, and used for cDNA synthesis, which was performed in a 96-well PCR plate in a cocktail that included 5l of oligo(dT) (50M) and 100 U of Superscript III enzyme per reaction (SuperScript first-strand synthesis system; Invitrogen,
Carls-bad, CA). Reverse transcription was carried out at 50°C for 1 h, 55°C for 1 h, and then 70°C for 15 min. Four units of RNase H (Invitrogen) was added directly to each sample, which was incubated for 20 min at 37°C.
Single-genome sequencing and sequence analysis.The cDNA was diluted until approximately 30% of the PCRs yielded a DNA product. Two amplification methods were employed to obtain Rev and RRE single-genome sequences. Using the first method, a single PCR product (⬃3 kb; HXB2 nucleotides 5853 to 8904) that spanned both Rev exons and the RRE was obtained by adding 1l of diluted cDNA template to a PCR mix in a 20-l total volume using 0.005 U Hi-Fidelity PlatinumTaq polymer-ase (Invitrogen) per reaction as previously described (3). Primers 2302⫹ and envB3out⫺were used. One microliter of each PCR product then was used as the template for the nested PCR with primers envB5⫹ and envB3in⫺.
For unknown technical reasons, in some cases we were not able to obtain the 3-kb PCR product. In these cases, the first Rev exon was am-plified separately to obtain an⬃1.5-kb PCR product (HXB2 nucleotides 4929 to 6461), and the RRE and second Rev exon sequences were ampli-fied by an⬃2-kb PCR product (HXB2 nucleotides 7002 to 9038). With this method, 2l of diluted cDNA template was used with primers 4680⫹ and E155⫺(Rev exon 1) or E90⫹and E01⫺(RRE and Rev exon 2), along with 0.004 U ofTaqpolymerase per reaction, in a 10-l total volume. PCR products were diluted 1:10 in 5 mM Tris-HCl (pH 8.0), and 2l was used as the template for nested PCRs with primers 4950⫹and E165⫺(Rev exon 1) or E110⫹and E03⫺(RRE and Rev exon 2), along with 0.002 U of polymerase per reaction. To identify positive PCRs, the nested PCR prod-ucts were visualized on a gel (96-well E-Gel system; Invitrogen), and pos-itive reactions were submitted for sequencing using standard dideoxy methods.
The sequences of the primers were as follows: 2302⫹(HR oligonucle-otide [oligo] 2302), AAGCCACCTTTGCCTAGTG; envB3out⫺ (HR oligo 2278), TTGCTACTTGTGATTGCTCCATGT; envB5⫹(HR oligo 2277), TAGAGCCCTGGAAGCATCCAGGAAG; envB3in⫺(HR oligo 2280), GTCTCGAGATACTGCTCCCACCC; 4860⫹(HR oligo 2259), GACATAATAGCAACAGACATACAAACTA; E155⫺(HR oligo 2260), CTGTTCTACCATGTTATTTTTCCACATGT; E90⫹(HR oligo 2263), CACAGTACAATGTACACATGGAAT; E01⫺ (HR oligo 2264), TC-CAGTCCCCCCTTTTCTTTTAAAAA; 4950⫹(HR oligo 2261), CTTTG GAAAGGACCAGCAAAGCT; E165⫺ (HR oligo 2262), GGGGTCT GTGGGTACACAGGCATGTGT; E110⫹(HR oligo 2265), CTGTTAA ATGGCAGTCTAGCAGAA; and E03⫺(HR oligo 2266), TAAGTCAT TGGTCTTAAAGGTACCTG.
Full-length single-genome Rev sequences were determined by joining the first and second exon sequences that occurred on the same cDNA molecule. However, in two samples that were amplified by the two-PCR-product method (1004 M18 and 1005 M0), limited sequence variation was found in both Rev exons. Therefore, for these populations, the full-length Rev sequences that were subsequently chosen for further study were most probably, but not definitely, derived from the same geno-mic RNA.
Phylogenetic analyses.Sequences were aligned using ClustalW (33) within MEGA5.0 (34). To determine the HIV subtype of the patient iso-lates, neighbor-joining trees with 500 bootstrap replicates were con-structed with all M0 Rev exon 2 or RRE sequences and the group M Rev or RRE subtype reference sequences available from the LANL HIV sequence database. To construct the trees, the Tamura-Nei⫹gamma nucleotide substitution model, selected by the Model Test feature in MEGA5.0, was used with default settings, and the resulting trees were rooted on a subtype C reference sequence. Patient isolates were assigned subtypes based on the most closely related reference isolate sequence. Trees were also con-structed with different nucleotide substitution models and compared to the optimal tree and were not found to affect the tree structure or subtype assignment.
To determine the population structure of the sequences from each time point, phylogenetic trees were conducted using a maximum
on November 7, 2019 by guest
http://jvi.asm.org/
hood-based method within MEGA5.0. Trees were rooted on the consen-sus sequence specific to the patient isolate. The evolutionary distances were computed using the Hasegawa-Kishino-Yano (HYK)⫹gamma dis-tribution substitution model (nucleotide sequences) or the JTT⫹F model (amino acid sequences), which were selected using the Model Test feature in MEGA5.0, and run with default settings. The genetic diversity and divergence of each Rev and RRE population was analyzed using the web-based DIVEIN phylogenetic program (35). Diversity was calculated by using average pairwise distance (%APD), and the divergence was calcu-lated as the tree-based mean distance between the M0 and MX popula-tions relative to the subtype consensus sequence that was used to root the trees. To calculate a probability value describing the likelihood that the populations from two time points were statistically different, a nonpara-metric test was used. This method, originally developed for population biology (36), has been adapted for use for HIV quasispecies evolution (37) and is available as a web-based program (http://wwwabi.snv.jussieu.fr
/public/mpweb/).
Rev-RRE activity assays.Twenty-four hours prior to transfection, 1.7⫻105293T cells/well were seeded into 12-well tissue culture plates in 2 ml of cell culture medium. The following day, each well was transfected with 0 to 32 ng of pCMV_Rev plasmid, 2g of pCMV-GagPol-RRE reporter plasmid, 100 ng of secreted placental alkaline phosphatase (SEAP) plasmid, and a compensatory amount (from 32 to 0 ng) of empty pCMV plasmid using Turbofect transfection reagent (Fermentas). Cell supernatants were collected 48 h posttransfection, and the p24 levels were determined by ELISA (38). The SEAP levels of the supernatants were obtained by a chemiluminescent method (Applied Biosystems) and used to normalize for differences in transfection efficiencies. The SEAP-nor-malized p24 values were plotted to generate dose-response curves of Rev-RRE activity. For each experiment, the NL4-3 cognate Rev-Rev-RRE pair was transfected in duplicate as a control. Analysis of Rev-RRE dose-response curves was performed using GraphPad Prism5.0 software (GraphPad Software, La Jolla, CA). The linear part of each Rev-RRE dose-response curve was fit with a best-fit line calculated by nonlinear regression analysis with a first-order polynomial equation and theyintercept constrained to 0. The relative activity of each variant was then calculated by dividing the slope of its best-fit line by the averaged slope of the best-fit lines from the control NL4-3 Rev-RRE cognate pair from that experiment. To determine whether the observed differences in activities had statistical significance, the relative activity values were log transformed [Y⫽log(Y)] and used in a one-way analysis of variance (ANOVA), followed by a Tukey multiple-comparison posttest or an unpairedttest.
Cloning of chimeric pNL4-3 provirus with exogenous Rev.Chimeric pNL4-3 proviruses encoding selected patient Rev variants in thenef read-ing frame were constructed. To do this, a pNL4-3 provirus was mutated to encode two stop codons within the endogenousrevreading frame. Each patient Rev variant was then subcloned into a pNL4-3-derived shuttle vector and then transferred into the Rev-deficient provirus using the BamHI and NcoI restriction sites.
Creation of viral stocks and viral growth assays.293T cells (1⫻106) were plated 24 h prior to transfection in 25-cm2flasks with 5 ml complete medium. Fiveg of HIV proviral DNA was transfected into cells using the calcium-phosphate transfection method (39). Transfection medium was removed after 6 h and replaced with normal medium. Supernatants con-taining infectious viral particles were harvested 72 h posttransfection and cleared of cellular debris by a short spin (5=, 2,500⫻g, room tempera-ture). Aliquots were analyzed for p24 by ELISA to quantitate the amount of virus present. These viral stocks were used to infect SupT1 cells.
In 6-well tissue culture plates, 5⫻106SupT1 cells in a volume of 1 ml of normal growth medium were infected with equivalent p24 amounts (typically 50 ng) of viral stocks. The plates were centrifuged at 2,500 rpm for 90 min, and the supernatant was discarded. Cell pellets were gently washed with phosphate-buffered saline (PBS) to remove unattached vi-rus, centrifuged (2,500 rpm, 5 min), and transferred to a 25-cm2flask with 5 ml fresh normal medium. Every 3 to 4 days, 3/5 of the medium and cell
samples were removed and replaced with 3 ml fresh medium to maintain the total culture volume at 5 ml. The amount of p24 in the supernatant at each time point was quantified by ELISA and used to plot viral growth.
NL4-3 Rev purification. Full-length NL4-3 Rev was cloned into pHGB1 (54) vector (a gift from A. Frankel) and expressed inEscherichia coliBL21/DE3 and then purified as described previously (22). Purified protein was quantitated by Bradford assay (Bio-Rad).
In vitroRNA transcription.Control NL4-3 or patient RRE was PCR amplified to generate a 234-nt portion of the RRE containing the T7 promoter and subsequently cloned into the pCR 2.1 TOPO TA vector (Invitrogen). The stem IIB A73G mutation was generated by site-directed mutagenesis (Agilent Technologies). Internally labeled RNAs were tran-scribed byin vitrorunoff transcription using T7 RNA polymerase (NEB) and [␣-32P]UTP (3,000 Ci/mmol; PerkinElmer) from gel-purified plas-mid templates. RNAs were purified on a denaturing 4% polyacrylaplas-mide (28.5:1.5 mono-acrylamide:bis-acrylamide, 1⫻TBE)–5 M urea gel. The 243-nt RNA band was excised from the gel, placed in 1⫻TE, and gently shaken overnight at 4°C. Probe purification was performed by phenol-chloroform extraction, followed by ethanol precipitation (2 volumes of 100% ethanol, 1/10 volume of 3 M sodium acetate, pH 5.3) for 30 min at
⫺80°C and then centrifuged for 30 min at 4°C. The pellet was washed with 70% ethanol, air dried for 30 min on ice, resuspended in nuclease-free distilled H2O, and then passed through a Chromaspin 30 column (Clon-tech) and stored for later use.
Gel shift assays.Electrophoretic mobility shift assays were performed by incubating Rev in binding buffer (10 mM HEPES-KOH, pH 7.8, 20 mM KCl, 2 mM MgCl2, 0.5 M EDTA, 1 mM dithiothreitol [DTT], 10% glycerol, 5g/ml yeast tRNA [Invitrogen], and 20 U RNase inhibitor [Promega]) on ice for 10 min. The internally labeled RNA was added to renaturation buffer (50 mM NaCl, 10 mM HEPES-KOH, pH 7.6, 2 mM MgCl2), heated to 80°C for 3 min, and cooled at room temperature for 15 min. The RNA probe was added (20,000 cpm or 1.3 nM) to the Rev reaction and incubated on ice for an additional 10 min and then loaded onto a 4% native polyacrylamide (28.5:1.5 mono:bis, 1⫻TBE) gel. Gels were run at 4°C, dried, and exposed to a phosphorimaging screen for⬎16 h and visualized with a Molecular Dynamics PhosphorImager and ImageQuant software.
Nucleotide sequence accession numbers.Nucleotide sequences were deposited in GenBank. The Rev and RRE sequences that were functionally analyzed were deposited under accession numbers KF559128 to
KF559163. For the Rev coding exon 2 and full-length Rev sequences used
to form the phylogenetic trees in Fig. S1 and S2, see accession numbers
KF586336toKF586420. The RRE sequences used in Fig. S3 may be found
under accession numbersKF586421toKF586469. The Rev coding exon 1 sequences used in Fig. S1 and S2 were too short to be placed in GenBank and are shown in Fig. S7.
RESULTS
Clinical characteristics of patients selected for study.To inves-tigate the extent of Rev and RRE sequence variation during HIV infection and how such variation might affect activity, we ob-tained plasma samples from five HIV⫹patients at two different times during their infections. The first set of samples was collected from 0 days to⬃6 months after seroconversion, and the second set was collected at times varying from 18 to 121 months later. Since most infections are established by single-variant transmis-sion, we reasoned that the early samples would contain near-monomorphic Rev and RRE sequences that would diverge as in-fection continued. As there was no basis to predict which clinical scenario would lead to Rev-RRE activity changes, we chose pa-tients with various clinical parameters. The key features of each patient and their infections are presented inTable 1.
From early (M0) to later (MX) time points, viral load de-creased in two patients, inde-creased in two patients, and showed
on November 7, 2019 by guest
http://jvi.asm.org/
little variation in the remaining one. At the second time point, plasma CD4 cell levels in three patients decreased to between 14.3 and 42.1% of the levels at the first time point and changed only slightly in two patients. Four patients remained antiretroviral therapy (ART) naive throughout the study, and one patient (SC1) had a variable course of treatment (see Materials and Methods).
Identification of Rev-RRE cognate pairs with single-genome
sequencing. Single-genome sequencing was performed on
genomic HIV RNA isolated from virus in plasma to analyze Rev and RRE sequences as linked pairs from the same molecule. In many cases, it was possible to amplify an⬃3-kb fragment contain-ing the first and second exon of Rev as well as the RRE. From this fragment, the full-length Rev and its cognate RRE sequence could be readily determined. In other cases, it was necessary to perform two individual PCRs. The first reaction amplified the first exon of Rev, while the second reaction amplified both the RRE and the second Rev exon. Using this method, in many instances it was still possible to deduce the full-length Rev sequences, as there often was not any sequence diversity in one or both Rev coding exons. However, it was not possible to do this for samples from 2 of the 10 time points analyzed (1004 at M18 and 1005 at M0). In all cases, the RRE and Rev exon 2 sequences were obtained from the same amplification product.
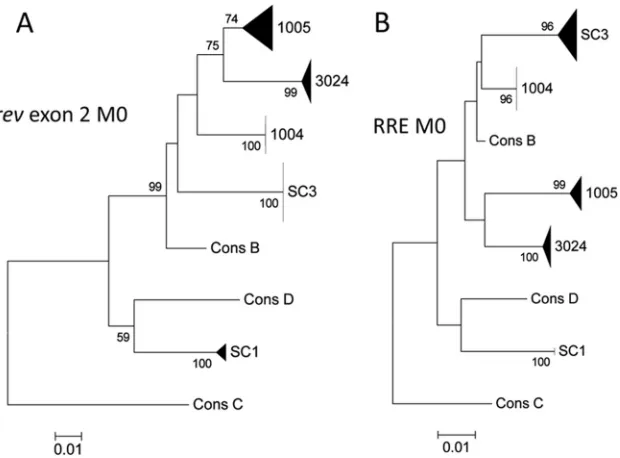
A total of 185 Rev exon 2 sequences and 200 RRE sequences were obtained from the 10 patient samples. To determine the HIV subtype of each infection, all Rev exon 2 and RRE sequences from the M0 time point were assembled on neighbor-joining trees that included consensus sequences from all HIV-1 group M subtypes and recombinants. A selected portion of each of these trees is shown inFig. 1. In all cases, the sequences from each patient oc-cupied a single branch on the tree, and there was no intermingling of sequences between different patient isolates. Based on these results, the infections in four patients were identified as subtype B and in one patient (SC1) as subtype D.
Population structure of Rev and RRE sequences.To examine the evolutionary relationships between the Rev populations from individual infections, maximum likelihood trees for each patient were constructed with all nucleotide sequences from both time points and were rooted on the subtype consensus sequence (see
Fig. S1 in the supplemental material). Full-length Rev sequences were used except in the cases where our data did not allow us to join exon 1 and exon 2 (1004 and 1005), as well as in one case where only a few full-length sequences were available from each time point (SC3). For these patients, separate trees for each exon were constructed. Trees that used protein sequences were also constructed to visualize diversity at both coding levels (see Fig. S2). In 4/5 patients, sequences obtained at MX were on longer branches than sequences from M0, demonstrating that new vari-ants emerged over the course of infection, as was expected to be the case. In these 4 patients, the observed nucleotide substitutions conformed to a Poisson distribution and followed a star phylog-eny that was consistent with a model of HIV transmission by a single founder variant (40). In the fifth patient (1005), the M0 Rev population at acute infection was more diverse (1.8% compared to 0.1 to 0.4% average pairwise distance for the other 4 patients) and had nucleotide substitutions that did not follow a star-like phylogeny. This was consistent with the multiple-variant trans-mission that was previously suggested for this patient, usingenv
andp6-rtsingle-genome sequences for analysis (3).
The RRE population structures for each patient were also an-alyzed, and maximum likelihood trees were constructed (see Fig. S3 in the supplemental material). Similar to Rev, for most patients the RRE MX sequences were on longer branches than M0 se-quences, demonstrating that evolution occurred between the two time points. Interestingly for patient SC3, the M0 RRE population was rather diverse, and this diversity decreased over time, suggest-ing that selection occurred (see below). For both therevand RRE trees, sequences that were chosen for functional analysis are no-tated by MX-y, representing the month postseroconversion (MX) and the specific clone selected (y).
A nonparametric test for genetic heterogeneity was also con-ducted to calculate a probability value, [P(K⫻s)], that described the statistical likelihood that the Rev and RRE populations from the two time points were different (37). Results showed that the early and late Rev and RRE populations from each individual were genetically distinct, with the exception of Rev from SC3. In this case, the observed divergence from M0 to M57 did not result in a statistically different Rev population, because the same Rev
vari-TABLE 1Clinical characteristics of patients in the study cohort
Patient
Agec
(yr) Sexd Riske
No. of days after seroconversion (M0)f
No. of months after M0 (MX)h
Viral load CD4 level
% CD4k (MX)
M0 MX
Fold
changej M0 MX
SC_1004a 38 M MSM ⫺7g 18 9,347,800 77,609 120 (⫺) 209 203 97.1
SC_1005a 28 M MSM 0 41 423,500 25,459 16.6 (⫺) 331 263 79.4
SC_3024a 56 F HS 18 43 115,721 534,082 4.6 (⫹) 656 99 15.1
SC_1b 50 F NIR ⬍147 121 14,000 17,000 1.2 (⫹) 700 295 42.1
SC_3b 42 F IDU ⬍184 57 230i 1,400,000 6,000i(⫹) 510 73 14.3
aPatient samples used in collaboration with the National Cancer Institute Drug Resistance Program (NCI/DRP), Frederick, MD (see reference3for original sources). b
Patient samples obtained from the Women’s Interagency HIV Study (WIHS) New York City/Bronx Consortium.
cAge at time of seroconversion. d
M, male; F, female.
eMSM, men who have sex with men; HS, heterosexual; NIR, no identified risk; IDU, intravenous drug user. f
M0, month 0; the first time point.
gFiebig stage III (p24 ELISA positive/Western blotting negative). h
MX, month postseroconversion, the second time point sampled relative to M0.
iThe reported viral load at seroconversion was not consistent relative to the cDNA dilution required to obtain single genomes. j⫺
, fold decrease;⫹, fold increase.
kRelative to M0.
on November 7, 2019 by guest
http://jvi.asm.org/
[image:4.585.38.552.79.171.2]ant (M0-B/M57-A) formed a predominant subpopulation at both time points (see Fig. S3H in the supplemental material).
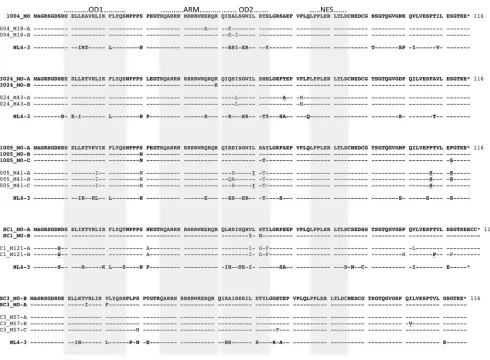
Selection of patient Rev sequences for functional analysis. Since our sequence analysis demonstrated that the M0 and MX populations in each patient were genetically distinct (with the ex-ception of SC3 Rev), we next addressed the possibility that these sequence differences resulted in functional differences between the early and late populations. Therefore, representative Rev and RRE sequence variants from each time point were selected for functional analysis. For Rev sequences, the most prevalent se-quence from a particular time point was selected as the A variant. When sequence variation was present, a B variant was selected as a representative of a second subpopulation from that time point. A C variant was also selected for two patients that had high sequence diversity and multiple subpopulations (1005 and SC3). The se-lected sequences are indicated on the maximum likelihood trees (see Fig. S1 to 3 in the supplemental material) and as an alignment with the known functional domains of Rev indicated (Fig. 2).
For the early M0 samples, only one Rev sequence was selected for patient 1004 due to the lack of sequence variation. When mul-tiple M0 variants were selected from the same patient, they dif-fered by only 1 to 3 amino acids. For the MX samples, there were also only 1 to 3 amino acid differences between variants from the same patient. There were more substitutions between time points (M0 to MX) than within a single time point. Interestingly, in 4/5 of the patients, many changes occurred in the second oligomeriza-tion domain (OD2; amino acids 51 to 63). Amino acid substitu-tions also occurred in other defined functional domains and near the carboxy terminus in some of the patients.
Selection of patient RRE sequences for functional analysis. For each patient, the selected RRE variants were members of a cognate pair with one of the selected Rev sequences. Due to the
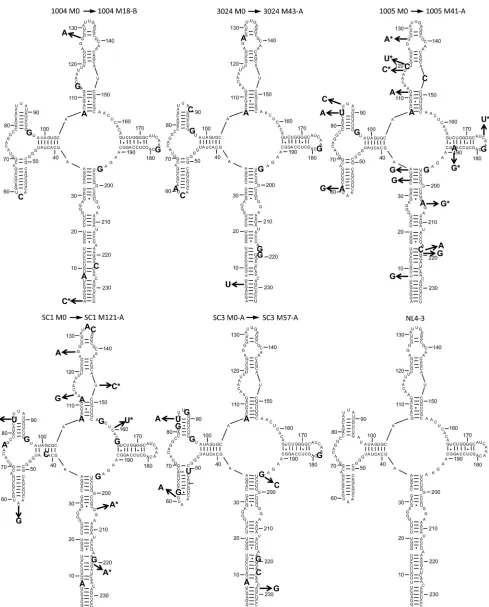
low sequence diversity at the first time point, only a single M0 RRE was chosen for further study in 4/5 patients. For patient SC3, two M0 RREs were chosen that differed by only two nucleotides. The sequence of the dominant M0 variant from each patient, and the changes that occurred in a corresponding MX variant, were mod-eled onto the secondary structure of the NL4-3 RRE (Fig. 3). Ad-ditionally, all of the selected RRE sequences are aligned to NL4-3 in Fig. S4 in the supplemental material.
The MX RRE sequences that were selected differed from the M0 sequences by only 1 to 8 nucleotides in four patients (1004, 3024, SC1, and SC3). In the fifth patient, 1005, the M41-A and -B RRE variants differed from the M0 RRE by 15 and 18 nucleotides, respectively. In this patient, an RRE subpopulation (5/20 se-quences), termed M41-B, contained a 3-nucleotide insertion in the 5=region of stem-loop I. While this insertion did not affect the overall predicted RRE structure or the predicted minimal free energy of the structure, it created an in-frame insertion in the overlappingenvreading frame within the Env fusion pep-tide (FLGFLG¡FLGLFLG) (data not shown).
To study their activity, the selected Rev and RRE sequences were synthesized either by PCR (SC1 and SC3) or chemical syn-thesis (1004, 3024, and 1005) and transferred into the appropriate expression plasmid for activity assays. A total of 21 Rev variants (M0, 9; MX, 11; shared, 1) and 15 RRE variants (M0, 6; MX, 9), resulting in 30 unique cognate pairs (M0, 12; MX, 18), were cloned and tested in Rev-RRE activity assays.
Activity of Rev-RRE cognate pairs derived from the same genomic RNA molecule.Since peripheral CD4⫹cells are usually infected with only a single virus, the Rev protein present in a cell during infection would normally function in conjunction with an RRE derived from the same genome (41). Thus, the use of cognate Rev-RRE pairs in these experiments provided a closer
approxima-FIG 1Population subtyping ofrevand RRE single-genome sequences from individual early infections. Population structure of therevexon 2 region (A) or the corresponding RRE region (B) from single-genome sequences obtained from the first available plasma sample postseroconversion (M0) from 5 individuals. Trees were constructed using a neighbor-joining method and are rooted on the HIV-1 subtype C consensus sequence. The sequences from each patient are represented collectively as a wedge, where the height of the wedge represents the relative number of sequences analyzed and the width represents sequence diversity within the population. The percentages of replicate trees in which the associated taxa clustered together in the bootstrap test (500 replicates) are shown next to the branches.
on November 7, 2019 by guest
http://jvi.asm.org/
[image:5.585.139.449.66.295.2]tion of in vivo activity. This obviously could not be achieved through measurements of Rev or RRE independently. To test the activity of each cognate pair, we employed a transient-transfection assay which utilized an HIV-1 Gag-Pol reporter plasmid where Gag-Pol expression was completely dependent on a functional Rev and RRE. Each patient’s RRE was cloned into the reporter plasmid, and the resulting constructs were transfected into 293T cells together with an increasing amount of a plasmid that ex-pressed the appropriate cognate Rev protein. A third plasmid that expressed secreted alkaline phosphatase (SEAP) was also trans-fected as an internal control (see Materials and Methods). For normalization, the activity of the NL4-3 cognate pair was also measured in each experiment.
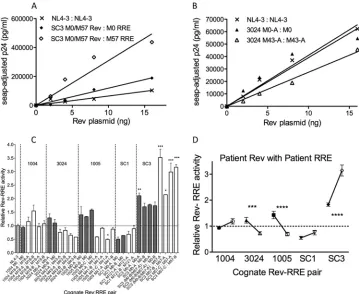
As an example, dose-response curves comparing the activities of cognate pairs from patient SC3 to the NL4-3 cognate pair are shown inFig. 4A. Patient SC3 had a Rev variant (M0-B/M57-A) that was present at both time points but that formed cognate pairs with different RREs. A best-fit line was generated for each dose-response curve by linear regression. The data show that in both cases, the patient cognate pairs generated larger amounts of p24 at each Rev concentration than the NL4-3 cognate pair.
Interest-ingly, a significant increase in Rev-RRE activity was seen in the M57 cognate pair compared to the M0 cognate pair. This was clearly due to changes in the RRE, since the Rev protein was the same in both cases. The cognate activity from a second patient (3024) was quantitated in a subsequent experiment (Fig. 4B). In this case, no significant differences in Rev-RRE activities were ob-served between the early patient 3024 and NL4-3 cognate pairs. However, the late patient 3024 cognate pair showed slightly lower activity.
In a similar fashion, the relative activities of all 30 M0 and MX cognate pairs from the five patients were determined using the slopes of the best-fit lines. In this way, it was possible to quantify the relative activity from each curve and normalize the results across multiple experiments. Cognate Rev-RRE activity from all patients ranged widely, from 0.5 to 3.5, relative to the NL4-3 con-trol (1.0) (Fig. 4C). Interestingly, statistically significant changes in activity between time points (P⬍0.001) occurred in 3/5 pa-tients, but the direction of change differed (Fig. 4D). Cognate Rev-RRE activity decreased in two patients (3024 and 1005) but increased in the third (SC3). The remaining two patients (1004 and SC1) had minor increases in cognate Rev-RRE activity across
FIG 2Amino acid alignment of patient Rev variants selected for functional analysis. Patient sequences selected from the first time point after seroconversion (M0) are shown in boldface. The NL4-3 Rev sequence, which was used as a control in the functional experiments, is included in each alignment. For each patient, amino acids that changed in Rev but did not affect the overlapping Tat or Env protein sequences are annotated with boldface and underlining. The shading indicates known functional domains of the protein. OD1, first oligomerization domain; ARM, arginine-rich motif; OD2, second oligomerization domain; NES, nuclear export signal.
on November 7, 2019 by guest
http://jvi.asm.org/
[image:6.585.47.537.62.422.2]FIG 3Sequences of selected M0 and MX patient RREs modeled on the NL4-3 structure. Selected M0 and MX RRE sequences from each patient were modeled onto the structure of the NL4-3 RRE as previously determined by SHAPE (23). The oversized bases represent sequence changes from NL4-3. The base shown at the end of each arrow represents a sequence change from the M0 sequence to MX sequence. Bases shown with an asterisk are synonymous changes from M0 to MX with respect to the amino acid sequence of the overlapping envelope protein open reading frame.
on November 7, 2019 by guest
http://jvi.asm.org/
[image:7.585.51.540.61.668.2]the time points sampled that did not achieve significance (P⫽
0.1). What is also striking from this analysis is that at a given time point, the cognate pairs from each patient clustered around a dis-tinct activity level or set point, which was defined as the mean activity of all cognate pairs from a patient at a single time point. Taken together, these results demonstrate that Rev-RRE cognate pairs at a particular time after infection have discrete levels of activity that can vary during infection as their sequences evolve.
Rev activity of variants selected from individual infections. We next devised a strategy to measure the activity of each Rev and each RRE separately by pairing them with either the RRE or Rev from NL4-3. In this way, we hoped to determine which compo-nent of the Rev-RRE pair drove the activity changes that were observed between time points and patients. We first measured the activity of the Rev variants.
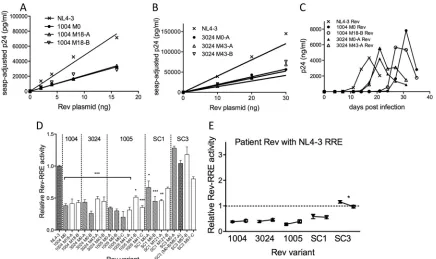
As an example, the activities of Rev variants from patient 1004 with the NL4-3 RRE are shown inFig. 5A. At all concentrations, the Rev variants from both time points had decreased activity compared to that of NL4-3 Rev, and the activity levels of the M0
and M18 Rev variants were indistinguishable. The activities of Rev variants cloned from a second patient, 3024, were also decreased compared to that of NL4-3 Rev (Fig. 5B). Similar to patient 1004, functional differences between the variants from both time points (M0 and M43) were not detected.
To ensure that the different Rev-expressing plasmids produced similar amounts of protein, Western blotting was performed (see Fig. S5 in the supplemental material). Plasmids expressing a subset of Rev variants were transfected into 293T cells, and the levels of Rev proteins present within the cell after 72 h were detected by SDS-PAGE and Western blotting. Beta-tubulin levels were used for normalization. The results indicate that the difference in ac-tivity levels seen with the different Rev proteins cannot be attrib-uted to different levels of expression.
In addition to determining the relative Rev activities in a trans-fection system, we measured the activity of selected patient Rev variants in the context of infectious virus. To do this, we cloned individual Rev variants into thenefregion of a pNL4-3 rev(-) proviral backbone and infected SupT1 cells with equal amounts of
FIG 4Activity of cognate Rev-RRE pairs from individual infections over time. 293T cells were cotransfected with 0 to 32 ng of a plasmid that expressed a patient Rev variant, a constant amount of a Rev-dependent Gag-Pol reporter plasmid containing the cognate RRE, a compensatory amount of empty plasmids, and a plasmid expressing SEAP. The p24 present in the medium was quantitated by ELISA at 48 h posttransfection. Raw p24 values were normalized to the corresponding SEAP values to correct for differences in transfection efficiency. Adjusted p24 was then plotted as a dose-response curve. (A) Activity of SC3 cognate Rev-RRE pairs from the first available time point (M0; closed diamonds) and 57 months later (M57; open diamonds) compared to NL4-3 Rev-RRE (X). A best-fit line was generated for each data set with linear regression and theyintercept constrained to zero. (B) Activity of patient 3024 cognate Rev-RRE pairs from the first available time point (M0-A; closed triangles) and a later time point (M43-A; open triangles) compared to the NL4-3 Rev-RRE pair (X). (C) Activity of individual Rev-RRE cognate pairs relative to the NL4-3 pair. A total of 30 cognate pairs from early (M0; shaded bars) and later (MX; open bars) time points from 5 individuals were tested. The height of each bar represents the mean activity level calculated from independent replicates, and error bars show the standard errors of the means. The dashed horizontal line represents the relative activity level (1.0) of the normalized NL4-3 pair. Asterisks indicatePvalues for cognate pairs with statistically significant activity differences relative to NL4-3 (*,P⬍0.05; **,P⬍0.01; ***,P⬍0.001). (D) Relative set points of cognate Rev-RRE pairs from the first available time point (M0; closed symbols) and a later time point (MX; open symbols) from five individual infections. Each data point represents the mean activity of all cognate pairs from that particular time. Error bars show the standard errors of the means. Statistically significant changes in activity from M0 to MX are denoted with asterisks (***,P⬍0.001; ****,P⬍0.0001).
on November 7, 2019 by guest
http://jvi.asm.org/
[image:8.585.112.471.66.360.2]viral stocks made from these constructs. The growth curves from these infections are shown inFig. 5C. In all cases, the viruses ex-pressing patient Rev sequences required more time to achieve peak p24 levels than those expressing NL4-3 Rev from thenef
region. This was consistent with the observation that patient Rev sequences had decreased activity relative to NL4-3 Rev in the transfection assays. However, viruses expressing Rev variants from patient 3024 achieved peak p24 levels earlier than viruses expressing patient 1004 Rev variants. Therefore, although these growth studies confirmed that patient Rev isolates have attenu-ated viral function with respect to NL4-3 Rev in conjunction with the pNL4-3 RRE, they also revealed potential functional differ-ences between patient sequdiffer-ences that were not observed in the reporter system.
The normalized activity levels in the transfection assay for the Rev variants from patients 1004 and 3024, as well as variants from the three other patients, are shown inFig. 5D. Most Rev variants (18/21) from four of the patients had lower activity than NL4-3 Rev, with statistical significance in 16 variants (P⬍0.05 toP⬍
0.001). Rev variants from the fifth patient (SC3) showed a differ-ent trend. In this patidiffer-ent, three of the four tested Revs were as active or more active than NL4-3 Rev (range, 1.0 to 1.3), and the activity of one variant was marginally lower. The SC3 Rev variant
that was present at both time points (M0-B/M57-A) had an activ-ity level similar to that of NL4-3 Rev (mean, 1.1).
In most cases, Rev activities differed only slightly within an individual patient. In only one case did a Rev isolate from the same time point show significantly different activity (3024 M0-B;P⬍
0.05) compared to others at the same time point. Interestingly, this sequence differed from 3024 M0-A by only a single amino acid (R50K) located at the 3=edge of the RNA binding domain. At 43 months after infection, K50 was no longer detected in the quasi-species. Interpatient Rev activity differences between four of the patients (1004, 3024, 1005, and SC1) were also slight.
The relative set point of Rev activity present at each time point is plotted inFig. 5E. In 4/5 patients there was no significant differ-ence between the levels of Rev activity at each time point. In pa-tient SC3, the difference was statistically significant, but overall Rev activity decreased slightly between time points compared to the differences seen in the cognate pair experiments, where the activity increased dramatically (Fig. 4D). Thus, it seemed unlikely that changes in Rev alone could account for the differences in activity of the SC3 cognate pairs.
RRE activity of variants selected from individual infections. Previous studies have shown that the structure and activity of the RRE are sensitive to minimal nucleotide changes (23,24).
There-FIG 5Activity levels of patient Rev variants with the NL4-3 RRE. Dose-response experiments with patient Rev sequences were performed as described in the legend toFig. 4, except a Gag-Pol reporter plasmid containing the NL4-3 RRE was used. (A) Activity of patient 1004 Rev variants present at the first available time point (M0; closed circles) and a later time point (M18-A and M18-B; open triangles) compared to the NL4-3 Rev-RRE pair (X). A best-fit line was generated for each data set with linear regression and theyintercept constrained to zero. (B) Activity of patient 3024 Rev variants from the first available time point (M0; closed circles) and a later time point (M43-A and -B; open triangles) compared to the NL4-3 Rev-RRE pair (X). (C) Growth curves of pNL4-3 chimeric viruses that expressed patient Rev sequences. Patient Rev and NL4-3 Rev sequences were cloned into thenefregion of a pNL4-3 proviral backbone that was modified to ablate endogenous Rev function. Viral replication was measured by determining the p24 levels in the cell supernatant every 3 to 4 days after infection of SupT1 cells. (D) Activity of patient Rev variants with the NL4-3 RRE relative to the NL4-3 cognate pair. The height of each bar was calculated by normalizing the slope of the best-fit line from each dose-response curve to the slope of the NL4-3 Rev-RRE pair from the same experiment. Error bars show the standard errors of the means. Asterisks indicatePvalues for variants with statistically significant activity differences relative to NL4-3 (*,P⬍0.05; **,P⬍0.01; ***,P⬍0.001). The dashed horizontal line represents the relative Rev-RRE activity level (1.0) of the normalized NL4-3 cognate pair. (E) Relative set points of patient Rev variants from the first available time point (M0; closed symbols) and a later time point (MX; open symbols). Each set point represents the mean activity of all Rev variants from that particular time. Error bars show the standard errors of the means. Statistically significant changes in activity from M0 to MX are denoted with asterisks (*,P⬍0.05).
on November 7, 2019 by guest
http://jvi.asm.org/
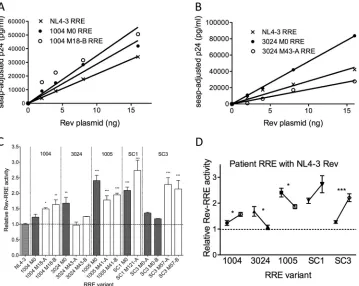
[image:9.585.75.511.65.324.2]fore, it was of interest to analyze the individual activities of the different patient RREs to determine what role, if any, RRE se-quence variability played in mediating Rev-RRE activity differ-ences between patients and time points. To do this, each RRE in the Gag-Pol reporter construct was tested for activity with the same NL4-3 Rev control. As an example, dose-response curves comparing the activities of RRE variants from patient 1004 to the NL4-3 cognate pair are shown inFig. 6A. For this patient, both RRE variants (M0 and M18-B) were more active than the NL4-3 RRE at all Rev concentrations, and there was no statistically sig-nificant difference between the M0 and M18-B patient RREs. Dose-response curves of the RRE activities from a second patient, 3024, are shown inFig. 6B. In this case, the patient RREs from the two time points had different activities when paired with NL4-3 Rev. The M0 RRE was more active than the M43-A RRE, while the activity of the NL4-3 cognate pair fell between the two patient RREs.
The activities of all of the selected RRE variants were deter-mined and normalized to the NL4-3 Rev-RRE cognate pair in this manner. The compiled results (Fig. 6C) show that 10 of the 15 tested RRE isolates were significantly more active than the NL4-3 RRE when paired with NL4-3 Rev. The remaining isolates had mean activity values that were equal to or greater than that of the
NL4-3 RRE but did not achieve significance (range,⬃1.0 to 1.3). In each case, only a few nucleotide substitutions were sufficient to induce the functional changes.
The set point of RRE activity with NL4-3 Rev at each time point is shown inFig. 6D. When analyzed in this fashion, it was clear that unlike the individual Rev activities for all patients, which hardly changed between the time points (Fig. 5E), changes in RRE activ-ity appeared to parallel the changes seen with the cognate pairs (Fig. 4D). Thus, the RRE, and not Rev, appears to be the driver of the overall changes in activity that we observed. This is particularly intriguing since most changes do not occur in the region of the RRE that is known to be the primary Rev binding site.
Analysis of Rev binding to SC3 M0 and M57 RRE.As previ-ously discussed, patient SC3 had a Rev variant (M0-B/M57-A) that was present at both time points. Thus, this protein formed a cognate pair at the early time point with SC3 M0-A RRE and at the late time point with SC3 M57 RRE. The two RREs differed by only 4 nucleotides (Fig. 3). Surprisingly, when the cognate pairs were tested, overall activity was approximately 2-fold higher with the late M57 RRE than with the early M0-A RRE (Fig. 4C) (3.5 versus 1.8;P⬍0.001). This activity difference was also observed with NL4-3 Rev (Fig. 6D).
To explore whether the variation observed in the activity
be-FIG 6Activity levels of patient RRE variants with the NL4-3 Rev. Dose-response experiments with patient RRE sequences were performed as described in the legend toFig. 4, except increasing amounts of NL4-3 Rev were used. (A) Activity of patient 1004 RRE variants from the first available time point (M0; closed circles) and 18 months later (M18-B; open circles) relative to the NL4-3 Rev-RRE cognate pair (X). A best-fit line was generated for each data set with linear regression and theyintercept constrained to zero. (B) Activity of patient 3024 RRE variants from the first available time point (M0; closed circles) and 43 months later (M43-A; open circles) relative to the cognate NL4-3 Rev-RRE pair (X). (C) Mean relative activity levels of 15 RRE variants tested from 5 individual patients. Error bars show standard errors of the means. Asterisks representPvalues for variants with statistically significant activity differences relative to the NL4-3 pair (*,P⬍0.05; **,P⬍0.01; ***,P⬍0.001). The dashed horizontal line shows the activity level (1.0) of the normalized NL4-3 Rev-RRE pair. (D) Relative set points of patient RRE variants from the first available time point (M0; closed symbols) and a later time point (MX; open symbols). Each set point represents the mean activity of all RRE variants from that particular time. Error bars show the standard errors of the means. Statistically significant changes in activity from M0 to MX are denoted with asterisks (*,P⬍0.05; ***,P⬍0.001).
on November 7, 2019 by guest
http://jvi.asm.org/
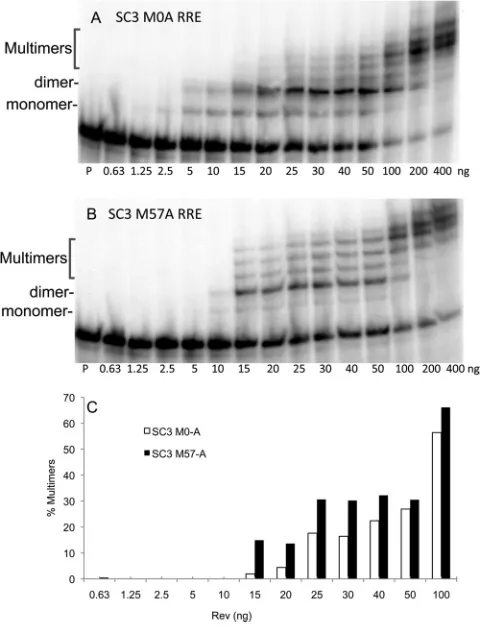
[image:10.585.115.474.66.352.2]tween the SC3 M0-A and M57 RREs was due to differences in Rev-RRE binding, we performedin vitro RNA binding experi-ments (gel shifts). To do this, increasing amounts of bacterially produced NL4-3 Rev protein were incubated in a binding reaction with a constant amount of radiolabeled RRE RNA. The resulting complexes were separated on a polyacrylamide gel and detected by phosphorimaging.
To first establish the specificity of our binding assay, Rev pro-tein was incubated with the wild-type NL4-3 RRE or with an RRE containing a mutation in stem-loop IIb, the primary Rev binding site (see Fig. S6A and B in the supplemental material). Efficient binding of Rev to the wild-type RRE, as measured by the forma-tion of slower migrating complexes, was observed with as little as 10 ng of Rev in the reaction mix, with multimers starting to form at 25 ng of Rev. In contrast, for the mutated RRE, weak Rev bind-ing was detected only at the highest Rev concentrations.
Having validated the binding assay, we compared NL4-3 Rev binding to SC3 M0-A RRE and M57-RRE over a wide range of Rev concentrations (Fig. 7A and B). Interestingly, the early RRE formed the initial monomer and dimer complexes at lower con-centrations of Rev (2.5 to 10 ng) than the M57 RRE, which only
started to form the complexes at 10 ng of Rev. However, the M57 RRE appeared to promote the formation of the higher-order com-plexes of Rev (multimers) and RRE at lower concentrations of Rev (Fig. 7C). This experiment has been repeated multiple times with similar results. An additional experiment is shown in Fig. S6C and D in the supplemental material, and essentially the same results were obtained when patient SC3 Rev (M0-B/M57-A) was used in place of NL4-3 Rev. (see Fig. S6E and F). Thus, the four changes that occurred in the late SC3 M57 RRE relative to the early M0 RRE not only increased the activity of the RRE but also changed the efficiency with which the RRE bound to Rev and how it pro-moted Rev multimerization.
DISCUSSION
This study was aimed at determining the extent to which natural sequence variation of Rev and the RRE could cause changes in their functional activities during a diverse set of clinical scenarios. It was not designed to link Rev and RRE variation to a particular clinical characteristic. A total of 5 patients were chosen for this analysis. The first time point analyzed was near the time of sero-conversion, as a sample from an early time point would likely contain a limited amount of sequence variation and would be expected to generate a relatively uniform level of Rev-RRE activ-ity. For three patients (1004, 3024, and 1005), this first sample was collected during acute infection (ranging from 7 days prior to seroconversion to an estimated 18 days postseroconversion), while for the two other patients (SC1 and SC3) it was obtained within 6 months of seroconversion. For each patient, a second sample from a later time point was also selected. We chose samples across a wide range of clinical parameters, including the duration of infection, viral loads, and CD4 levels, as we did not know which factors influence Rev and RRE variation.
Rev and RRE sequences were isolated from patient plasma samples using SGS, which allowed us to identify the individual sequences within the viral quasispecies at specific times after in-fection. The ability to obtain sequences that were linked to the same viral genome was essential, since Rev and the RRE operate as a combined functional unit. As most CD4⫹lymphocytes are ini-tially infected with only a single viral variant (42), the SGS-based approach ensured that the Rev-RRE pairs obtained in this manner reflected actualin vivo pairings. Selected sequences were then cloned and tested in HIV replication and reporter assays to mea-sure the activity of each Rev and RRE separately and as cognate pairs. Gel shift Rev-RRE binding experiments were also per-formed to explore the observed functional differences between selected patient RREs.
Although this study was not designed to address whether a change in Rev-RRE activity could correlate with a specific infec-tion outcome or clinical scenario, an important finding did emerge about Rev-RRE sequences and functional activity in pa-tients. Our results showed that at the different time points, there were genetically distinct populations of cognate Rev and RRE pairs whose activities clustered at a discrete activity level, which we termed the Rev-RRE activity set point. This set point changed in 3/5 patients, driven apparently by limited nucleotide changes in the RRE rather than by changes in Rev.
Several mechanisms could drive Rev-RRE evolution.rev -spe-cific CTL epitopes have been observed for a variety of HLA types (43–46), suggesting that adaptive immune pressure onrevis one mechanism that drives sequence diversification. Additionally,
FIG 7Binding and multimerization of selected RRE variants using gel shift assays.32P-labeled RRE RNA was synthesizedin vitro, and a constant amount
was incubated in a binding reaction with increasing amounts of bacterially derived NL4-3 Rev protein. (A) Binding pattern observed after incubation of the SC3 RRE from early infection (M0-A) with increasing amounts of NL4-3 Rev (0.63 to 400 ng) or with probe only (P). (B) Binding pattern observed after incubation of the SC3 RRE from late infection (M57-A) with increasing amounts of NL4-3 Rev (0.63 to 400 ng) or with probe only (P). (C) Bar graph of gel shift signal quantitation for multimers from SC3 MOA RRE and SC3 M57A RRE gel shift assays.
on November 7, 2019 by guest
http://jvi.asm.org/
[image:11.585.43.283.68.385.2]CTL pressure on other HIV genes, such astatandenv, could also affectrevdiversity, since the coding regions for these genes all overlap. Immune pressure onenvcould similarly lead to nucleo-tide changes in the overlapping RRE. Additionally,revand RRE might diversify due to nonimmune pressures. For example, direct functional selection onrevor RRE could occur during replication of the virus in different cell types, andrevor RRE variation could result from inhibitor drug pressure on any of the proteins regu-lated by Rev.
Throughout an infection, the Rev-RRE regulatory axis must balance the efficient export of Rev-dependent mRNA, resulting in increased viral protein expression and likely leading to increased visibility of the infected cell to the immune system. Thus, variation in Rev-RRE activity may reflect adaptive evolution of the virus in response to selective pressure to establish a particular level of cog-nate activity that is fine-tuned to function in the specific immune environment. In this model, functional variability would be more likely to occur between two time points rather than at a single time. In situations of normal immune control, for example, dur-ing the asymptomatic period of infection, selective pressures would generate a moderate level of Rev-RRE activity. However, when immune function is compromised, such as after AIDS onset, the Rev-RRE activity may be able to evolve to high levels and remain undetected by immune surveillance cells.
One previously published study did examine the function of different Rev alleles from HIV-infected patients and found less active Rev proteins in asymptomatic patients with an active im-mune response compared to the Rev proteins isolated from AIDS patients (47). Cells expressing the less active Rev alleles also had decreased susceptibility to anti-Gag and anti-Env CTL killing, which was attributed to lower Rev-dependent expression levels of the targeted epitopes. Thus, the authors concluded that Rev activ-ity indirectly modulates immune evasion. Other studies have at-tributed the long-term survival of some patients with HIV infec-tion to less active Rev alleles (48–50). However, all of these studies failed to account for concomitant differences in the RRE, which, in light of our work, would be expected to influence overall Rev-RRE function at least as much, if not more, than Rev.
The data we obtained with patient SC3 support the idea that higher Rev-RRE function can evolve in the absence of a competent immune system and that changes in the RRE drive this higher activity. The course of infection in this patient was uncontrolled, with a progressive decline in CD4 counts and a rapidly increasing high viral load from infection until death, approximately 4 years later. During this time frame, the RRE diversity actually decreased, suggesting that there was selection for more active RREs. While the results from this single patient do not allow for correlation between high Rev-RRE activity and uncontrolled viral replication, our results demonstrate that activity variation does occur and ap-parently can be selected for.
Gel shift assays performed on selected SC3 RRE variants showed that the more active M57 RRE promoted increased mul-timerization of Rev at lower concentrations relative to the M0 RRE. Interestingly, the nucleotide changes that occurred between these RRE molecules were located outside the primary Rev bind-ing domain, suggestbind-ing that other regions of the RRE contribute to the overall phenotype. These findings are consistent with previous experiments using laboratory-adapted viral clones, where it was demonstrated that one or two nucleotide changes in the RRE could dramatically alter both its structure and activity (23,24). It
has now been established that regions of the RRE distant from the primary binding site play a role in multimerization and in modu-lating the affinity of the primary binding event (22,51). However, the present study is the first to show that changes driven by the natural evolution of the virus can actually bring about functional changes through this mechanism. By evolving a complex structure like the RRE, which is functionally very sensitive to small sequence changes, HIV may have derived a simple way to create variants with different replicative capacities. Such a mechanism would not be expected to be possible in the simpler retroviruses, which use a less complex RNA structure in conjunction with a host cell protein to promote their RNA export and expression (52,53).
At present, models of how Rev and the RRE interact are not detailed enough to explain the observed activity differences when different Revs and RREs are paired. However, our data clearly point to significant cross talk between these two entities, and it will be of great interest to determine the molecular interactions that account for the differences observed. As more progress is made in determining the molecular structures not only of Rev but also of the RRE, we may begin to fully understand how these activity changes occur. In conclusion, this study provides new insight into Rev and RRE sequence variation during individual infections and begins to address the complex relationship that exists between Rev-RRE sequence variationin vivoand the resulting functional activity of the cooperative unit.
ACKNOWLEDGMENTS
We thank Yeou Cherng Bor for his technical advice, Joy Niesen and Susan Prasad for maintaining the cell lines, Wei Gao for assistance with data access, and the patients who contributed to these studies.
This work was supported by grants AI087505 and AI068501 as well as ARRA supplements or other supplements to WIHS grant UO1-AI-35004 from the National Institutes of Health. Salary support for M.-L.H. and D.R. was provided by the Charles H. Ross, Jr., and Myles H. Thaler En-dowments at the University of Virginia.
REFERENCES
1.Abrahams MR, Anderson JA, Giorgi EE, Seoighe C, Mlisana K, Ping LH, Athreya GS, Treurnicht FK, Keele BF, Wood N, Salazar-Gonzalez JF, Bhattacharya T, Chu H, Hoffman I, Galvin S, Mapanje C, Kazembe P, Thebus R, Fiscus S, Hide W, Cohen MS, Karim SA, Haynes BF, Shaw GM, Hahn BH, Korber BT, Swanstrom R, Williamson C.2009. Quan-titating the multiplicity of infection with human immunodeficiency virus type 1 subtype C reveals a non-Poisson distribution of transmitted vari-ants. J. Virol.83:3556 –3567.
2.Gottlieb GS, Heath L, Nickle DC, Wong KG, Leach SE, Jacobs B, Gezahegne S, van’t Wout AB, Jacobson LP, Margolick JB, Mullins JI.
2008. HIV-1 variation before seroconversion in men who have sex with men: analysis of acute/early HIV infection in the multicenter AIDS cohort study. J. Infect. Dis.197:1011–1015.
3.Kearney M, Maldarelli F, Shao W, Margolick JB, Daar ES, Mellors JW, Rao V, Coffin JM, Palmer S.2009. Human immunodeficiency virus type 1 population genetics and adaptation in newly infected individuals. J. Virol.83:2715–2727.
4.Keele BF, Giorgi EE, Salazar-Gonzalez JF, Decker JM, Pham KT, Salazar MG, Sun C, Grayson T, Wang S, Li H, Wei X, Jiang C, Kirchherr JL, Gao F, Anderson JA, Ping LH, Swanstrom R, Tomaras GD, Blattner WA, Goepfert PA, Kilby JM, Saag MS, Delwart EL, Busch MP, Cohen MS, Montefiori DC, Haynes BF, Gaschen B, Athreya GS, Lee HY, Wood N, Seoighe C, Perelson AS, Bhattacharya T, Korber BT, Hahn BH, Shaw GM.2008. Identification and characterization of trans-mitted and early founder virus envelopes in primary HIV-1 infection. Proc. Natl. Acad. Sci. U. S. A.105:7552–7557.
5.Poss M, Martin HL, Kreiss JK, Granville L, Chohan B, Nyange P, Mandaliya K, Overbaugh J.1995. Diversity in virus populations from