Rochester Institute of Technology
RIT Scholar Works
Theses Thesis/Dissertation Collections
11-16-2015
Data mining NHANES: Utilizing a Genetic
Algorithm to Detect Correlation Between Birth Sex
Ratio and Epidemiological Factors
Christopher F. Fucile
Follow this and additional works at:http://scholarworks.rit.edu/theses
This Thesis is brought to you for free and open access by the Thesis/Dissertation Collections at RIT Scholar Works. It has been accepted for inclusion in Theses by an authorized administrator of RIT Scholar Works. For more information, please [email protected].
Recommended Citation
Data mining NHANES: Utilizing a Genetic Algorithm to Detect Correlation Between Birth
Sex Ratio and Epidemiological Factors
Christopher F. Fucile
Thesis submission in partial fulfillment of the requirements for the Master of Science degree in Bioinformatics
Rochester Institute of Technology. College of Science
Thomas H. Gosnell School of Science Rochester, NY
Abstract
In the past several decades there has been increasing research into factors that may affect
the birth sex ratio of parents. These can range from nutrition to hormone levels to psychological
factors. The National Health and Nutritional Examination Survey (NHANES) is a broadly
encompassing governmental survey that captures some of these aspects making it a rich and
easily exploitable data set for these purposes. In this study we utilize custom Perl scripts written
to extract such information and attempt to find correlations using a genetic algorithm. Mothers
are first identified through inferred relationships within the database. Variables are then
analyzed to find any significant difference between groups of women whom have more male or
female offspring. Lastly, identified variables are passed on to a genetic algorithm which
attempts to find any correlation between the variables and the birth sex ratio.
While our analysis did not produce any conclusive results, there were some interesting
findings regarding which variables were automatically selected for in the primary analysis.
Ultimately the development of the tools used in this project can be helpful in answering other
questions about the NHANES data set and they can potentially be applied to other problems
Thesis Committee
1 Committee Advisor Dr. Michael Osier
Associate Professor of Biological Sciences Director of Bioinformatics
Thomas H. Gosnell School of Life Sciences Rochester Institute of Technology
2 Committee Member Dr. Gary Skuse
Professor of Biological Sciences Chair, Institute Biosafety Committee
Thomas H. Gosnell School of Life Sciences Rochester Institute of Technology
3. Committee Member Dr. Leslie Kate Wright
Assistant Professor of Biological Sciences Thomas H. Gosnell School of Life Sciences Rochester Institute of Technology
List of Tables
Table 1 – NHANES Summary...1
Table 2 – Family Size Counts in NHANES III Survey ...11
Table 3 – Offspring Ratio Count...14
List of Figures
Figure 1 – Maternal Stress/Partner Income Effects on Offspring...5
Figure 2 – Genetic Algorithm Overview...6
Figure 3 – Maximum Fitness...17
Figure 4 – Highest Scoring Variables...18
Figure 5 – Deviation of Variables...19
Table of Contents
Title ...i
Abstract ... ii
Thesis Committee ... iii
List of Tables ... iv
List of Figures ... v
Introduction ... 1
NHANES III ... 1
Factors Affecting Birth Sex Ratio ... 2
Nutritional Factors ... 3
Testosterone Levels ... 4
Psychological Factors ... 4
Genetic Algorithm ... 5
Goals ... 9
Materials and Methods ... 10
Data Set ... 10
Basic Analysis ... 10
Genetic Algorithm Analysis ... 11
Results ... 14
Birth Sex Ratio ... 14
T-test ... 14
Discussion ... 20
Possible Improvements ... 20
Computational Improvements ... 20
ACO-GA ... 21
Sample Weights and Data Imputation ... 22
Possible Applications and Future Development ... 22
Conclusion ... 23
Introduction
NHANES III
The National Health and Nutrition Examination Survey (NHANES) is an extensive
survey performed by the National Center for Health Statistics that is a part of the Center for
Disease Control and Prevention. The survey has taken place over four main time periods. The
first three versions of the survey are titled NHANES I, II and III. The fourth survey, which is
ongoing, is referred to as Continuous NHANES or just NHANES. The goal of NHANES is to
aid in determining the prevalence and risk factors of major diseases within the nation. Such data
are also analyzed and used to aid in the development of public health policy and the design of
public health programs and services in order to better meet the needs of the general population.
As a government survey of the general population, the majority of the data for each survey
period is publicly available online through the Center for Disease Control's website in SAS
format which makes it ideal to answer
basic population based health questions.
An overview of the years and number of
persons involved in each of the NHANES
surveys can be seen in Table 1. To
produce accurate results, people over the age of 60 as well as African Americans and Hispanics
are oversampled within the survey. This is an important consideration when trying to accurately
answer questions for such under-represented groups (CDC 2011).
The surveys are broken down into two main components, an interview portion and a
physical examination. The interview portion contains questions on demographics,
NHANES Years Number of People
I 1960-1975 31,973
II 1980-1986 25,286
III 1988-1994 33,994
IV 1999-present 5,000/year
socioeconomic status, and dietary habits. The physical examinations include a medical and
dental examination, as well as basic physiological measurements and select laboratory tests. The
examination portion attempts to address multiple health topics, over the course of the entire
survey, based on what is considered to be most pertinent at the time. The current focus of topics
includes items such as respiratory health, spinal mobility, oral health, dietary, and audiometry
data for select age groups. Previous topics have included ophthalmology, isokinetics, mental
health conditions as well as peripheral neuropathy and vascular disease. Cause-specific
mortality status is also available for adult participants who died after the conclusion of the
NHANES III survey up until 2006 (CDC 2011).
The NHANES III data set was previously converted into a MySQL database for ease of
access, and determination of correlation between predefined variables by a previous student at
RIT. The conversion of the database into MySQL allows for the development of computational
tools to analyze and determine corresponding relationships between variables (Marzullo 2010).
Development of one such computational tool is the main focus of this project.
Given the combined size, the thoroughness and the availability of the NHANES surveys,
they are a good source of data for health-based studies in the United States and based on
previous work (Marzullo 2010), the NHANES III survey is used in this project for the data set.
The main focus of the information contained within the data set for this project is the birth sex
ratio of mothers and any variables that may affect birth sex ratio.
Factors Affecting Birth Sex Ratio
One of the most commonly accepted views of sex determination in mammalian
reproduction focuses primarily on the genetic level and the contribution of chromosomes from
determination of the offspring. Two possible physiological sources of maternal influence have
been suggested: the physical condition, or nutrition of the mother, and the maternal testosterone
levels.
Nutritional Factors
One of the first hypotheses regarding alternate sex determination models was called the
“good condition” hypothesis. Trivers & Willard first presented the “good condition” hypothesis
in 1973. The hypothesis states that given a male and female in “good condition,” the male is
capable of fathering more children in the same amount of time as the female, since men can
impregnate multiple partners concurrently. It is important to note that good condition here is
considered the overall indication of the nutritional health state that the parents are in. From this
Trivers & Willard propose that there should be a way for the parents to favor reproducing one
sex over the other in order to increase the total number of progeny over multiple generations. It
was concluded that since parents in good condition are an indication of an abundance of
resources the parents would favor producing male offspring during such times since they can
father more children than female offspring (Trivers and Willard, 1973).
Since then, other researchers have attempted to demonstrate similar maternal dietary
effects in mammals on birth sex ratio in support of the good condition hypothesis. Some success
has come from researching dietary components such as saturated and polyunsaturated fat as well
as glucose, which have been shown to significantly alter the birth sex ratio in various mammals.
One such study looked at the sex ratios of mice on diets of very high saturated fats (Alexenko, et
al. 2007). They found a significant (p < 0.0001) difference in the sex ratio of control subjects to
that of mice on the very high saturated fat diet as well as a significant (p < 0.0001) difference of
Mice on the very high saturated fat diet produced a higher ratio of male to female offspring.
Another such study looking at ewes in a controlled environment found a significant difference (p
< 0.001) in the sex ratio of offspring when mothers were fed a diet high in n-6 polyunsaturated
fatty acids (Green, Keisler and Roberts 2008). The resulting difference yielded a higher ratio of
male offspring to female.
Such dietary influences on birth sex ratios have also been examined in humans. A study
on British females (n = 740) compared dietary assessments pre-conception as well as post
conception and found that based on a dietary assessment score that there was an increase in the
ratios of male offspring for pre-conceptual diets high in energy intake, total calories. They found
that 56% of women who were classified in the top third of energy intake pre-conception resulted
in male offspring opposed to 45% of women in the lowest third of energy intake pre-conception
that had male offspring (Mathews, Johnson and Neil 2008).
Testosterone Levels
In addition to dietary factors affecting birth sex ratios, researchers have also looked at
maternal testosterone levels for influences on birth sex ratio. One such study found that in field
voles, there is an association between females with high serum testosterone (p = 0.041) and
glucose levels (p = 0.058) with male-biased litters (Helle, et al. 2007). A similar study involving
bovine test subjects looked at follicular testosterone levels. It was found that ova that had
developed in the presence of high concentrations of testosterone were significantly more likely
(p < .01) to become male offspring (Grant, et al. 2008).
Psychological Factors
While physiological effects can be more accurately measured and observed than
psychological factors that have an impact on sex determination. One such case investigates the
effect of the job stress level, for mothers, on sex determination as well as their partner's income.
Jobs were categorized in different levels based on previous findings of how stressful they are
perceived to be by individuals. It was found that women in high stress categorized jobs,
categories such as processing, manufacturing and utilities or trades, transport and construction,
were more likely to give birth to daughters opposed to women in low stress jobs whom had equal
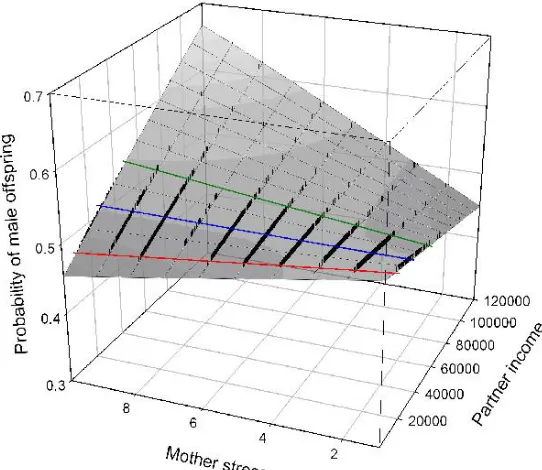
or slightly male biased offspring (p = 0.0051). They also found an interesting relationship
between partner income levels and
maternal job stress in which income
seems to lessen the effect of the stress
on sex ratios at moderate levels and
reverse the ratios at high income
levels. These results can be seen more
clearly in Figure 1 (Ruckstuhl, et al.
2010). While these results may not
directly relate to the original
Trivers-Willard hypothesis, they
show an important possible factor in
determining sex ratios of offspring.
Genetic Algorithm
With the explosion of data that has been seen in the end of the 20th and beginning of the
21st century there has been enormous growth in the ways to interpret and extract information
[image:13.612.272.543.272.507.2]from data-sets. One such way is an intrinsically parallel computational method known as a
Figure 1 - Maternal Stress/Partner Income Effects on Offspring As maternal stress increases the
likelihood of male offspring also increases. Yet higher partner income levels counteracts this effect
genetic algorithm. First developed in the mid 1970’s by Dr. John H. Holland, genetic algorithms
attempt to solve complex problems through the computational modeling of natural selection in
biological systems (Holland 1992). Many components of genetic algorithms use names
analogous to those in biological systems. This makes it important to maintain an abstract idea of
what these terms represent as opposed to the literal meaning within biological context. Some of
these terms include chromosomes, crossover, mutation, and generations, each of which will be
explained in terms of how it relates to the functioning of the algorithm.
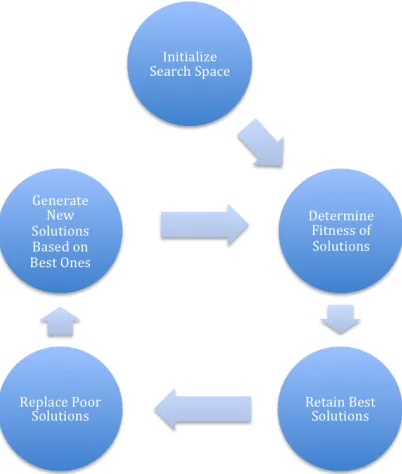
As with most complex computational problems it is important to understand the various
possible answers that you may come across especially when using an approximation-based
algorithm, such as a genetic algorithm. These
answers, be they right, wrong, or somewhere in
between, are a part of what is known as the search
space for the computational problem. The genetic
algorithm will explore this search space
attempting to find the best possible answer based
on the information we give it, hence why it is
classified as an approximation based algorithm.
A general overview of this genetic algorithm can
be seen in Figure 2. In order to formally define the
search space the variables of interest must first be
identified and encoded into a form for the
algorithm to work with. One way to accomplish
[image:14.612.84.285.347.584.2]this, and the method utilized within this paper, is
Figure 2 – Genetic Algorithm Overview
to associate a weight with each variable that represents its importance. Collectively these
weights can be termed a chromosome. Generally the chromosomes are encoded in a binary
fashion to give them a wide range of values and make it easy for mutation and crossover, topics
that will be explained below, to occur. This process results in each chromosome being
represented as a binary string. Multiple chromosomes that represent the same sets of variables
but that differ in value then become a subset of the represented search space of the problem for
the algorithm to use. Through multiple processes these chromosomes are changed, weights take
on different values, and as such move around the search space looking for better answers to the
problem at hand. To determine whether one answer is better than another, a fitness function, and
sometimes a scoring function as well, is implemented that properly represents the desired
solution to the problem trying to be solved. Chromosomes that do not meet the fitness function’s
requirements generally are thrown out or have a less chance of being selected for the subsequent
generations. Ones that do meet the requirements continue on or at least have a better chance to be
selected for crossover and mutation in the next generation. The number of generations that are
allowed to occur can either be an arbitrary number or the fitness value can be observed and
execution can be terminated when subsequent generations cease to produce more fit solutions
(Holland 1992).
When utilizing weights as representations for chromosomes in the genetic algorithm a
scoring function is necessary in order to measure the importance of each variable. A simple
function such as the one proposed by Thompson & Gopal (2006) accomplishes this and is merely
the sum of the product of each variable multiplied by its weight. Since we have multiple
variables for individuals with differing values across each individual we can take one
individual’s set of variables to get a set of scores for a given chromosome. Each score is paired
with the variable of interest for each individual, in this case birth sex ratio, and submitted as a set
for least squares regression analysis. The corresponding R-value returned can be utilized as part
of the fitness function to determine how well a set of weights, when applied across the
population of individuals, is an indicator for birth sex ratio or some other variable of interest.
There are three main processes of a genetic algorithm that need to be addressed after the
search space has been defined: selection, mutation, and crossover. Selection of chromosomes for
crossover and mutation to occur is the first step after defining the initial chromosome weights
and determining the scores and fitness values. Several different popular selection methods exist
for genetic algorithms that include tournament, rank, and proportional-based selection (Miller
and Goldberg 1995). While these are not the only three types of selection that can be used in a
genetic algorithm, they and their numerous variants represent the majority of implementations.
A proportional-based selection method, also known as Monte Carlo or roulette wheel
selection, will select individuals from the population with a probability that is directly
proportional to the fitness value. Rank-based selection is a straightforward method that sorts the
fitness values from best to worst and assigns values to each rank for how many replications each
rank should perform. The last general selection method, known as tournament selection, will
select a subset of the mating pool, usually 2 individuals, at random and use the one with a higher
score for replication. This is generally repeated until the pool for the next generation is filled.
Although these methods have fairly different approaches, they all attempt to accomplish the
same goal, which is the preferential selection of chromosomes within the population based upon
the fitness value. This helps to ensure that individuals that are a better approximation of the
Goals
With NHANES III containing many variables that have been of previous interest in birth
sex ratios, in addition to a plethora of others and having such large sample sizes it is
hypothesized that some degree of correlation will be observed for variables reported as being
significant. The main goal of this project is the construction of part of a set of generic analysis
tools for the NHANES data set, which can theoretically be used to determine correlation between
other variables within the data set. These tools are also written in Perl allowing them to be easily
Materials and Methods
Data Set
The NHANES III database was utilized in its current form, as designed by Brandon
Marzullo (2010) on RIT servers, to extract data and determine birth sex ratios of suspected
mothers within the data set. Due to the anonymity of individuals within the database there are no
direct indications of familial relationships between individuals within a given household. Likely
parent-child relationships were determined using a number of variables that are available within
the data set. Specifically, within a given household if there was a child, the age of the mother at
birth is recorded. If there is a female present in the same household that is within one year of the
recorded age of the mother at birth plus the age of the child then that female is assumed to be the
mother of the child. A tolerance of one year is allowed for ease of computing the relationships in
relation to the birthdates of the mother and child. If there were multiple females within the
household that meet these requirements then they are not selected for analysis. The birth sex
ratios were determined for each mother based upon the natality data available within the database
and linked to epidemiological factors through the use of the common survey participant
identification number (SEQN) that is for all intents and purposes the primary key of the database.
The birth sex ratio is a fraction of the offspring that are female, represented for each parent by a
number between 0 and 1, with 0 representing all male offspring and 1 being all female offspring.
The resulting data file created from the script is a tab-delimited file consisting of a column of
SEQN numbers and the corresponding birth sex ratio for that individual. The file was used as
input for another program consisting of a basic analysis of the data with epidemiological factors.
Basic Analysis
investigation by the more complex genetic algorithm. Data points are split into two groups
consisting of male and female dominate offspring. Since we are attempting to asses the affects
of the variables on the sex outcome of offspring, mothers with equal numbers of male and female
offspring were not included.
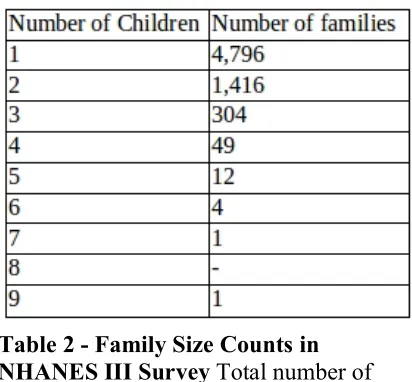
Within the natality data set for the NHANES
III database there are 8,836 children. These children
are in 6,583 family groups consisting of a range of 1
to 9 children within each group, 4,374 are male and
4,462 are female. The number of families present in
the data-set with the corresponding number of
children can be seen in Table 2.
While this study concentrates on birth sex
ratios and epidemiological factors affecting them,
the program is generic in that it will be able to accept any predefined variable of interest, which
is included in the data set, in a similar file format to compare the rest of the variables against for
correlation. The simple algorithm utilizes Welch’s T-test to determine significant differences
between the birth sex ratio and the set of variables (Welch 1947). The output consists of any
variables that meet a user defined significance level in a file that can be used by a subsequent
program for a more complex analysis. The outputted file is in a tab-delimited format consisting
of the SEQN number along with the birth sex ratio, the variable name and significance level of
statistically significant results.
Genetic Algorithm Analysis
[image:19.612.334.540.177.368.2]The second program is a genetic algorithm for a more complex analysis to determine if a
correlation within the data exists. Weights for each individual’s variables are encoded and
expressed as binary strings of 16 bits, corresponding to a range of 0 – 65,535. The scoring
function for the algorithm is a summation of the product between the likelihood of the variable
𝑣! and a weight 𝑤!.
𝑤! × 𝑣!
!
!!!
In this it is similar to the scoring function utilized by Thompson and Gopal (2006) in their
genetic algorithm. The fitness function for the algorithm attempts to maximize the value of the
coefficient of correlation (r) between the birth sex ratio and the value of the scoring function for
a given set of variables. By achieving this, we can say how well a set of variables can help
predict the likelihood of an offspring’s gender. The coefficient of correlation is determined
through the least squares regression.
During execution of the algorithm, the top five percent of scores for chromosomes during
each generation is preserved and passed on to the next generation after allowing for them to
further propagate through crossover events. The other ninety five percent of chromosomes are
allowed to propagate and then are replaced by the offspring of that propagation. The proportion
of chromosomes to retain versus discard is a user-defined value that can be determined at run
time. To determine the location of a crossover event, two chromosomes are first selected at
random. Then a random position is selected at some point along the chromosomes, which is
where the sections of the binary strings are exchanged. After crossover occurs, individual bit
positions are selected at random for a mutation event to take place. The mutation event is
modeled by a bit-flip and is selected at a point along the binary string of values for the
a user-defined value that can be changed at run time. The user is also able to determine the
number of generations to be run. The algorithm was initially set to 10,000 generations however;
Results
Birth Sex Ratio
Within the NHANES III survey, study
participants with ambiguous maternal relationships due to
lack of coding were eliminated. Birth sex ratios were
determined for the remaining 1927 individuals. Ratios
varied from 0 to 1, representing all male and all female
offspring respectively. Eliminating individuals with equal
proportions of male and female offspring resulted in 1598
persons left. Looking at the distribution of the number of
mothers across the ratios, Table 3, we can see that it is
relatively even in regards to the number of predominately
male vs. female offspring (798 vs 800).
T-test
Utilizing the 1598 persons identified from the birth sex ratio script, the two groups were
formed for conducting the t-test calculations based on the 798 mothers with male-biased
offspring and 800 mothers with female-biased offspring. For the variables within the database,
2,301 were explicitly filtered due to complicating factors such as all individuals having equal
values. This resulted in 8,345 variables tested and t-test scores being calculated for. Out of the
8,345 variables, 224 were initially identified with a p-value < .05 and all 357,952 values for the
1,598 persons were passed on for a more complex analysis using a genetic algorithm.
Ratio Number,of,Mothers
0 713
1/5 2
1/4 9
1/3 68
2/5 6
3/5 4
2/3 74
3/4 12
4/5 1
[image:22.612.356.535.143.324.2]1 709
Table 3 - Offspring Ratio Count
Genetic Algorithm
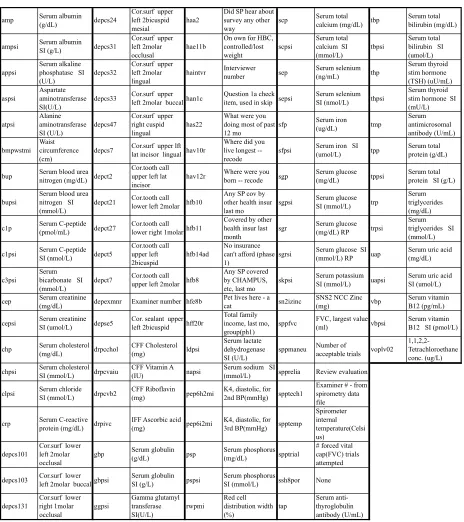
Looking at the 224 identified variables for the 1,598 persons it is clear that not all
variables have values for every individual. To help eliminate the sparseness within the data set,
131 of the 224 variables were identified as containing little information in relation to the number
of individuals measured. These were eliminated as well as 90 individuals who were missing a
significant portion of data for the rest of the variables. This resulted in the testing of 93 variables
for 1508 individuals. A list of these variables, and what they attempt to measure, can be seen in
Table 4. Many of them appear to be measurements from the laboratory tests with some being
amp Serum albumin (g/dL) depcs24
Cor.surf upper left 2bicuspid mesial
haa2
Did SP hear about survey any other way
scp Serum total calcium (mg/dL) tbp
Serum total bilirubin (mg/dL)
ampsi Serum albumin SI (g/L) depcs31
Cor.surf upper left 2molar occlusal
hae11b
On own for HBC, controlled/lost weight
scpsi
Serum total calcium SI (mmol/L)
tbpsi
Serum total bilirubin SI (umol/L)
appsi
Serum alkaline phosphatase SI (U/L)
depcs32
Cor.surf upper left 2molar lingual
haintvr numberInterviewer sep Serum selenium (ng/mL) thp
Serum thyroid stim hormone (TSH) (uU/mL) aspsi Aspartate aminotransferase SI(U/L)
depcs33 Cor.surf upper left 2molar buccalhan1c item, used in skipQuestion 1a check sepsi Serum selenium SI (nmol/L) thpsi
Serum thyroid stim hormone SI (mU/L) atpsi Alanine aminotransferase SI (U/L) depcs47
Cor.surf upper right cuspid lingual
has22
What were you doing most of past 12 mo
sfp Serum iron (ug/dL) tmp
Serum antimicrosomal antibody (U/mL) bmpwstmi Waist circumference (cm)
depcs7 Cor.surf upper lft lat incisor lingual hav10r
Where did you live longest -- recode
sfpsi Serum iron SI (umol/L) tpp Serum total protein (g/dL)
bup Serum blood urea nitrogen (mg/dL) depct2
Cor.tooth call upper left lat incisor
hav12r born -- recodeWhere were you sgp Serum glucose (mg/dL) tppsi Serum total protein SI (g/L)
bupsi
Serum blood urea nitrogen SI (mmol/L)
depct21 Cor.tooth call lower left 2molar hfb10
Any SP cov by other health insur last mo
sgpsi Serum glucose SI (mmol/L) trp
Serum triglycerides (mg/dL)
c1p Serum C-peptide (pmol/mL) depct27 Cor.tooth call lower right 1molarhfb11
Covered by other health insur last month
sgr Serum glucose (mg/dL) RP trpsi
Serum triglycerides SI (mmol/L)
c1psi Serum C-peptide SI (nmol/L) depct5
Cor.tooth call upper left 2bicuspid
hfb14ad
No insurance can't afford (phase 1)
sgrsi Serum glucose SI (mmol/L) RP uap Serum uric acid (mg/dL)
c3psi
Serum bicarbonate SI (mmol/L)
depct7 Cor.tooth call upper left 2molar hfb8
Any SP covered by CHAMPUS, etc, last mo
skpsi Serum potassium SI (mmol/L) uapsi Serum uric acid SI (umol/L)
cep Serum creatinine
(mg/dL) depexmnr Examiner number hfe8b
Pet lives here - a cat sn2izinc
SNS2 NCC Zinc (mg) vbp
Serum vitamin B12 (pg/mL)
cepsi Serum creatinine SI (umol/L) depse5 Cor. sealant upper left 2bicuspid hff20r
Total family income, last mo, group(ph1)
sppfvc FVC, largest value (ml) vbpsi Serum vitamin B12 SI (pmol/L)
chp Serum cholesterol (mg/dL) drpcchol CFF Cholesterol (mg) ldpsi Serum lactate dehydrogenase SI (U/L)
sppmaneu Number of
acceptable trials voplv02
1,1,2,2-Tetrachloroethane conc. (ug/L) chpsi Serum cholesterol SI (mmol/L) drpcvaiu CFF Vitamin A (IU) napsi (mmol/L)Serum sodium SI spprelia Review evaluation
clpsi Serum chloride SI (mmol/L) drpcvb2 CFF Riboflavin (mg) pep6h2mi K4, diastolic, for 2nd BP(mmHg) spptech1
Examiner # - from spirometry data file
crp Serum C-reactive protein (mg/dL) drpivc
IFF Ascorbic acid (mg) pep6i2mi
K4, diastolic, for 3rd BP(mmHg) spptemp
Spirometer internal temperature(Celsi us)
depcs101
Cor.surf lower left 2molar occlusal
gbp Serum globulin (g/dL) psp Serum phosphorus (mg/dL) spptrial
# forced vital cap(FVC) trials attempted
depcs103 Cor.surf lower left 2molar buccalgbpsi Serum globulin SI (g/L) pspsi SI (mmol/L)Serum phosphorus ssh8por None
depcs131
[image:24.612.78.542.65.587.2]Cor.surf lower right 1molar occlusal ggpsi Gamma glutamyl transferase SI(U/L) rwpmi Red cell distribution width (%) tap Serum anti-thyroglobulin antibody (U/mL)
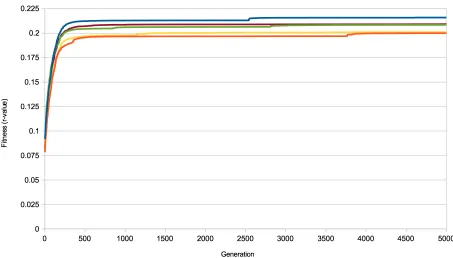
Figure 3 - Maximum Fitnesss The genetic algorithm was run five times with five differing subsets of the data. Each time the results converged on the average correlation of 0.21.
The genetic algorithm was run 5 times with 5 different sets of training and testing data in
an attempt to perform a 5-fold cross-validation. The maximum fitness (r value) attained for each
run are as follows after 5,000 generations: 0.2159900405, 0.2000226177, 0.2011041037,
0.2084594991, and 0.2092766733, Figure 3. These values indicate no clear correlation being
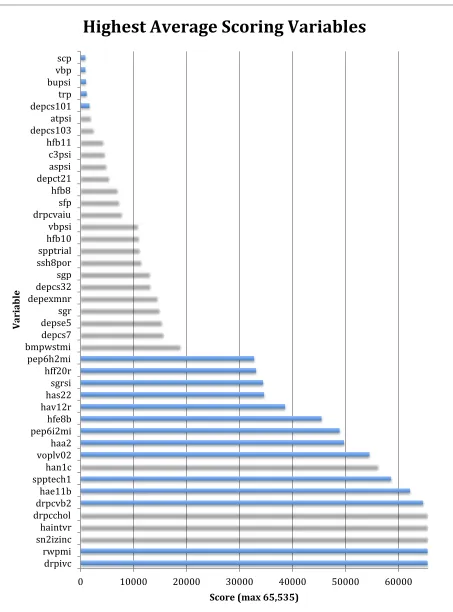
present between this set of variables and the birth sex ratio. The five highest scoring variables,
Figure 4, included measurements such as ascorbic acid, red cell distribution width, zinc,
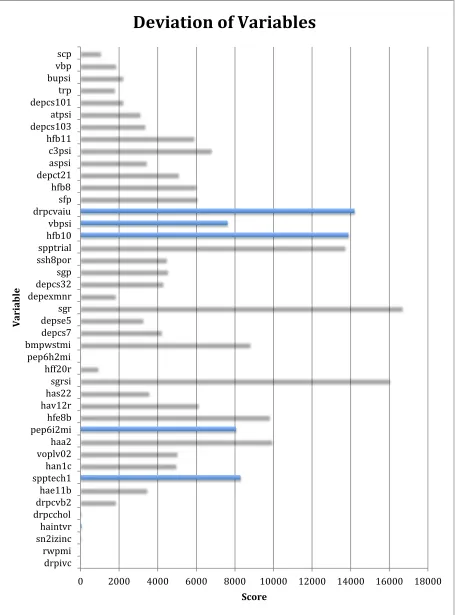
interviewer number and cholesterol in that order. Variables with the largest amount of
differences between runs, Figure 5 included serum glucose, vitamin A and two questions from
Figure 4 - Highest Scoring Variables Variables with the highest average scores across all chromosomes within each run of the genetic algorithm.
0 10000 20000 30000 40000 50000 60000
drpivc rwpmi sn2izinc haintvr drpcchol drpcvb2 hae11b spptech1 han1c voplv02 haa2 pep6i2mi hfe8b hav12r has22 sgrsi hff20r pep6h2mi bmpwstmi depcs7 depse5 sgr depexmnr depcs32 sgp ssh8por spptrial h@b10 vbpsi drpcvaiu sfp h@b8 depct21 aspsi c3psi h@b11 depcs103 atpsi depcs101 trp bupsi vbp scp
Score (max 65,535)
Variable
Figure 5 - Deviation of Variables The deviations of the values of the scores across differing chromosomes in the separate runs of the genetic algorithm.
Figure 5 - Highest Scoring Variables
0 2000 4000 6000 8000 10000 12000 14000 16000 18000
drpivc rwpmi sn2izinc haintvr drpcchol drpcvb2 hae11b spptech1 han1c voplv02 haa2 pep6i2mi hfe8b hav12r has22 sgrsi hff20r pep6h2mi bmpwstmi depcs7 depse5 sgr depexmnr depcs32 sgp ssh8por spptrial h@b10 vbpsi drpcvaiu sfp h@b8 depct21 aspsi c3psi h@b11 depcs103 atpsi depcs101 trp bupsi vbp scp
Score
Variable
Discussion
Possible Improvements
The lack of a clear indication of correlation between the variables selected and the birth
sex ratio for the subjects shows a need for closer scrutiny of variable selection. It could also be
an indicator that a more selective cut off value could be used at the t-test analysis step.
Especially when looking at the nature of some of the selected variables such as: pet lives here – a
cat (hfe8b), examiner number (depexmnr) and interviewer number (haintvr). Some of these
variables should be filtered based on the fact that they are categorical measurements making
them inappropriate for the statistical tests used here. Doing so may very well increase the scores
for a given set of variables and may show improved correlation with birth sex ratio. The nature
of some of the variables that were automatically selected also warrants some further study. For
example, the automatic selection of serum samples measuring triglycerides (trp), glucose (sgp)
and a hormone measurement (thp) are in line with previously published studies and very well
may be useful and real indicators of birth sex ratio.
It is also possible that the settings of mutation and crossover were too conservative to
properly exhaust the search space for an optimum answer. This may be why we see the max
fitness chromosomes converging to a general solution at around 250 generations (Figure 3) and
then continuing to make small incremental advances over the next 4750 generations, quite
possibly indicating that the algorithm is stuck in a local optimum, unable to find a global
optimum due to the size of the search space.
Computational Improvements
In terms of improving the programming of the GA, one item that could be addressed for
threaded process. Parallelizing the program would likely decrease run time significantly
depending on the hardware it is run on. With consumer computers continuously increasing the
number of processors as well as processing cores contained within, it would behoove most
programmers to take advantage of the full processing power of the system available. Since the
program is written in Perl this can be accomplished fairly easily. Perl comes with the ability to
program in a parallel fashion using two different methodologies. The one being the Unix based
fork and the other using threads. Utilizing fork for parallelization is likely the easier of the two,
and can cost significantly less overhead in terms of programming. The disadvantage of fork is
that because of its origins on Unix, it may not always work properly with Perl on
Windows/MS-DOS based machines. Since many of the servers utilized
in the Bioinformatics program at RIT are based on Unix
though, this is of little consequence.
ACO-GA
A specialized form of genetic algorithms also
exists termed Ant Colony Optimization – Genetic
Algorithm or ACO-GA. Ant Colony Optimization is a
heuristic search based method that tries to mimic the way
that biological ants find and inform their colony of
important items (Dorigo and Gambardella 1997).
Biological ants can find the shortest path between their
nest and a food source through the use of a pheromone
trail. As an ant travels it will deposit pheromones for
other ants to preferentially travel along. The more ants
M.Dorigo,L.M.Gambardella/BioSystems43 (1997) 73–81 74
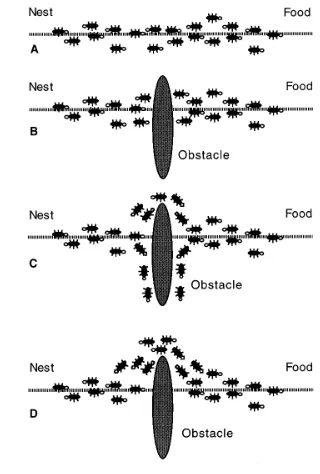
choosebetweenturningright orleft.Inthis situa-tionwe canexpecthalftheantstochooseto turn right andtheotherhalfto turnleft. Avery similar situation can be found on the other side of the obstacle (Fig. 1C). It is interesting to note that thoseants which choose, by chance, the shorter patharoundtheobstacle willmorerapidlyr econ-stitutethe interrupted pheromonetrail compared to those who choosethe longer path. Thus, the shorter path will receive a greater amount of pheromone per time unit and in turn a larger numberofants will choosethe shorterpath. Due to this positive feedback (autocatalytic) process, all the ants willrapidly choose the shorter path (Fig. 1D). The most interesting aspect of this autocatalytic process is that finding the shortest patharoundtheobstacle seemstobeanemergent property of the interaction between the obstacle shapeandantsdistributed behaviour:althoughall ants moveat approximately the same speed and deposit a pheromone trail at approximately the same rate, it is a fact that it takes longer to contour obstacles on their longer side than on their shorter side which makes the pheromone trailaccumulatequickeronthe shorterside.Itis the ants preference for higher pheromone trail levels whichmakesthisaccumulationstillquicker on the shorter path. We will now show how a similarprocess can beput toworkinasimulated worldinhabited byartificialantsthat trytosolve thetravelling salesman problem.
The travelling salesman problem (TSP) is the problem of finding a shortest closed tour which visitsallthe cities inagivenset.Inthisarticle we willrestrict attention to TSPs in which cities are onaplaneandapath(edge) existsbetweeneach pair of cities (i.e., the TSP graph is completely connected).
2.Artificialants
Inthis workanartificialantis anagentwhich
moves from city to city on a TSP graph. It choosesthe city to move to using a probabilistic function bothof trail accumulated on edgesand ofa heuristic value,whichwas chosen heretobe a function of the edges length. Artificial ants
probabilistically prefer cities that are connected by edges withalot ofpheromonetrailandwhich are close-by.Initially,martificialantsareplaced on randomly selected cities. At each time step
they move to new cities and modify the
pheromone trail on the edges used—this is termed local trail updating. When all the ants have completed a tour the ant that made the shortest tour modifies the edges belonging to its tour—termed global trail updating—by adding an amount of pheromone trail that is inversely proportionalto thetourlength.
These are three ideas from natural ant be-haviourthatwehavetransferredto ourartificial antcolony: (i)thepreference forpaths withahigh pheromone level,(ii)thehigher rateof growthof theamount of pheromoneon shorterpaths, and (iii) the trail mediated communication among ants. Artificialants werealsogivenafew
[image:29.612.378.538.346.583.2]capabil-Fig.1.(A) Realants followapath between nest andfood source.(B) An obstacle appears on thepath:ants choose whether to turn left or right with equal probability. Pheromone isdepositedmorequicklyonthe shorterpath.(D) Allantshave chosenthe shorterpath.
Figure 6 - ACO GA The ant colony
that travel the path the stronger the trail becomes. Since a shorter path allows for more ants to
travel across it faster, the shorter paths build pheromone amounts quicker than longer paths
forming a positive feedback loop.
This specialized form of a GA could aid in analysis to help ensure that the solution is not
converging upon a local optima. This could be accomplished by having multiple ants traveling
different paths through the search space of the problem each converging on its own local optima
and increasing the likelihood of other ants traveling that path based on its fitness for the problem
at hand (Miller and Goldberg 1995).
Sample Weights and Data Imputation
The NHANES survey is set up in a very complex and multidimensional way. Each
sample is assigned its own weight for each specific variable. In order to correctly extrapolate an
analysis to the U.S. general public these weights must be used. This is due to the fact that some
minor populations are heavily oversampled to ensure that they are correctly represented.
Furthermore, additional weights are needed for proper variance estimations. While preliminary
analysis can be done without utilizing the weights, a more accurate answer may be obtained if
they are used.
Some variables within the data-set are fairly sparse as well and the CDC has developed a
set of best practices in terms of preparing such data for analysis (CDC 2010). Following such
practices can help to ensure the quality of the data itself.
Possible Applications and Future Development
The development of the genetic algorithm used in this study is valuable not only for
solving other problems related to the NHANES surveys but also as a model for complex
between specific variables. Due to the fact that the algorithms were written in Perl, they can
easily be expanded up and incorporated into other toolkits. In order to apply this algorithm to
similar questions regarding NHANES, a new function should be written to identify individuals
based on a variable of interest, be it one that is present in the data set or one that is computed
from the data set. This algorithm can also be applied to other data sets given that the input is
properly formatted. Input formatting guidelines are contained within the algorithm
documentation. Additionally, the algorithm can be altered to fit other types of problems by
rewriting the fitness function to reflect the particular research question.
A future project that could expand the availability and usability of this type of genetic
algorithm is the development of a graphical user interface. This would allow researchers and
students without previous experience with Perl or coding in general to be able to properly format
their data, run the algorithm and access the maximum fitness results. Some options for creating a
graphical user interface include integrating the algorithm into a web application, utilizing Tcl/Tk,
or using another programming language such as Java.
Conclusion
There have been many studies on possible environmental, physiological and
psychological effects on birth sex outcome. While this study did not outright find any
correlation between such factors, variables related to previous studies were identified
automatically for further investigation. Through a combination of careful screening of
categorical variables, more liberal mutation and crossover settings within the GA, and possible
data imputation, such correlations may be found.
The flexible and simple manner in which the scripts have been created can ensure ease of use
and adaptability to other questions. Many opportunities exist to expand the algorithm to other
Works Cited
Alexenko, A.P., et al. "The Contrasting Effects of Ad Libitum and Restricted Feeding of a Diet
Very High in Saturated Fats on Sex Ratio and Metabolic Hormones in Mice." Biology of
Reproduction, no. 77 (May 2007): 599-607.
CDC. "National Health and Nutrition Examination Survey." Centers for Disease Control and
Prevention. US Department of Health and Human Services. 2011.
http://www.cdc.gov/nchs/data/nhanes/nhanes_07_08/ (accessed September 6, 2011).
—. NHANES III Web Tutorial - Preparing an Analytic Dataset. December 9, 2010.
http://www.cdc.gov/nchs/tutorials/NHANES/preparing/intro_iii.htm (accessed January 13,
2014).
Dorigo, M., and L.M. Gambardella. "Ant colonies for the travelling salesman problem."
BioSystems 43 (1997): 73-81.
Grant, V.J., R.J. Irwin, N.T. Standley, A.N. Shelling, and L.W. Chamley. "Sex of Bovine
Embryos May be Related to Mothers' Preovulatory Follicular Testosterone." Biology of
Reproduction, no. 78 (January 2008): 812-815.
Green, J.A., D.H. Keisler, and R.M. Roberts. "Nutritional skewing of conceptus sex in sheep:
effects of a maternal diet enriched in rumen-protected polyunsaturated fatty acids (PUFA)."
Helle, S., T. Laaksonen, A. Adamsson, J. Paranko, and O. Huitu. "Female field voles with high
testosterone and glucose levels produce male-biased litters." Animal Behaviour, no. 75
(November 2007): 1031-1039.
Holland, J.H. Adaptation in Natural and Artificial Systems: An Introductory Analysis with
Applications to Biology, Control and Artificial Intelligence. Cambridge, MA: Bradford Book,
MIT Press, 1992.
Marzullo, B.J. "The NHANES III Database: Design and a Retrospective Study to Identify
Associations between Vitamin D and Hypertension." Rochester, NY: UMI Dissertation
Publishing, May 2010.
Mathews, F., P.J. Johnson, and A. Neil. "You are what your mother eats: evidence for maternal
preconception diet influencing foetal sex in humans." Proceedings of the Royal Society, no. 275
(April 2008): 1661-1668.
Miller, B.L., and D.E. Goldberg. "Genetic Algorithms, Tournament Selection, and the Effects of
Noise." IlliGAL Report 95006. July 12, 1995.
Myers, W.R. "Handling Missing Data in Clinical Trials: An Overview." Drug Information
Ruckstuhl, K.E., G.P. Colijn, V. Amiot, and E. Vinish. "Mother's occupation and sex ratio at
birth." BMC Public Health, no. 10 (2010): 269.
Thompson, J., and S. Gopal. "Genetic algorithm learning as a robust approach to RNA editing
stie prediction." BMC Bioinformatics, no. 7 (March 2006): 145.
Trivers, R.L. Natural Selection and Social Theory: Selected Papers of Robert Trivers. Oxford
University Press, 2002.
Trivers, R.L., and D.E. Willard. "Natural selection of parental ability to vary the sex ratio of
offspring." Science 179, no. 4068 (January 1973): 90-92.
Welch, B.L. "The generalization of "Student's" problem when several different population