A STUDY ON THE PREVALENCE OF
OVERWEIGHT AND HYPERTENSION AND
ASSOCIATED RISK FACTORS IN ADOLESCENT
SCHOOL CHILDREN 12 – 16 YEARS IN CHENNAI
Dissertation submitted to
THE TAMILNADU DR.M.G.R MEDICAL UNIVERSITY
In partial fulfillment of the requirement
for the award of degree of
MD BRANCH – VII
PEDIATRIC MEDICINE
INSTITUTE OF CHILD HEALTH & HOSPITAL FOR
CHILDREN
MADRAS MEDICAL COLLEGE
CERTIFICATE
Certified that this dissertation entitled “A study of the prevalence
of overweight and hypertension and associated risk factors in
adolescent school children 12 – 16 years in Chennai” is a bonafide
work done by Dr.AIYSHA BEEVI. R.M, Postgraduate, Institute of
Child health and Hospital for Children,Madras Medical College,Chennai
during the academic year 2006- 2009.
Prof. D r. SARADHA SURESH, M.D., Ph.D., F.R.C.P. (Glas), Director and Superintendant,
Institute of Child Health & Hospital for Children,
HOD and Professor of Pediatrics, Madras Medical College,
Chennai – 600 003.
Prof. Dr. P. PARAMANANDHAM, M.D., D.C.H., Ph.D., (NEO),
Professor of Pediatrics,
Institute of Child Health & Hospital for Children,
ACKNOWLEDGEMENT
I express my sincere thanks to Prof. Dr. T. P. KALANITI, M.D.,
Dean, Madras Medical College for allowing me to do this dissertation and
utilize the institutional facilities.
I express my sincere and heartfelt gratitude to Prof. Dr.
SARADHA SURESH, M.D., Ph.D., F.R.C.P. (Glas), Director and
Superintendent, Institute of Child Health and Hospital for Children, for
her invaluable guidance and support.
I am extremely thankful to Prof. Dr. P. PARAMANANDHAM,
MD., D.C.H., Ph.D., (NEO), Professor of Pediatrics, Institute of Child
Health and Hospital for Children, Chennai for his invaluable help and
guidance.
I would to like to thank Dr. B. SATHYAMURTHI, Dr. S.
PARIVATHINI, and Dr. J. HEMACHITRA for their help and support
throughout my study.
I would like to specially thank all my colleagues for their constant
encouragement and support.
I am greatly indebted to all the children who participated in this
study and their parents without whom this study would not have been
CONTENTS
INTRODUCTION 1
REVIEW OF LITERATURE 3
AIM OF THE STUDY 21
MATERIALS AND METHODS 22
OBSERVATION 28
DISCUSSION 46
SUMMARY 50
BIBLIOGRAPHY
INTRODUCTION
The importance of identifying children who are at risk of
developing the metabolic syndrome cannot be underestimated. The
syndrome is a cluster of risk factors for cardiovascular disease and type 2
diabetes, including abdominal obesity, dyslipidemia,glucose intolerance
and hypertension. The modern obesogenic environment is one of a
number of factors that are driving an increase in these risk factors in
children and adolescents.
Obesity is associated with an increase in risk factors for
cardiovascular disease. The persistence of these from childhood and
adolescence to adulthood has been shown in a number of studies.
A clinically accessible diagnostic tool which avoids measurements
that are likely onely available in research settings is needed to identify the
and Human Services recommended that BMI be routinely used to screen
children for overweight. This will identify children at risk for developing
adverse cardiac events and the metabolic syndrome later in life. Early
recognition is desirable because early intervention in the form of lifestyle
modification will go a long way in favorably affecting those children at
risk.
Also, the incidence of primary or essential hypertension is on the
rise in our children and adolescent population as shown by various
studies. Hypertension (BP>95th percentile) is also included as a criterion
for the diagnosis of the metabolic syndrome in children and adolescents
in the IDF (International Diabetes Federation) consensus definition
published in 2007.
This study primarily aims to find out the prevalence of overweight
and hypertension and the associated risk factors in adolescent school
REVIEW OF LITERATURE
The IDF definition of the at risk group and the metabolic syndrome
in children and adolescents.
Age group (Yrs)
Obesity (WC)
Triglycerides HDL-C Blood Pressure
Glucose (mmol/L) Known Type 2 DM 6 to <10 >90th
percentile
Metabolic syndrome cannot be diagnosed but further measurements should be made if there is a family history of metabolic syndrome, T2DM, dyslipidemia, hypertension, cardiovascular disease and/ obesity
10 to <16 >90th
percentile or adult cutoff if lower >1.7 mmol/L (150 mg/dL) <1.03mmol/L) (<40 mg/dL) Systolic >130 mm Hg Diastolic >85 mm Hg >5.6 mmol/L (100 mg/dL) 16 and above
Use existing IDF criteria for adults
The centre for disease control, Atlanta has defined ‘at risk of
overweight’ as a BMI > 85th to 94th percentile and ‘overweight’ as a BMI
of >95th percentile. Most children experience obesity than any of the
of developing the metabolic syndrome in children 8 – 10 times ( Harrell
et al., 2006).
Prevention and treatment of the metabolic syndrome
The metabolic syndrome is due partially to health practices,
therefore healthy lifestyle choices can aid in prevention and treatment.
These include education, physical activity participation, physical fitness ,
healthy diets and regular health check ups. The focus should be on
prevention, as all of these risk factors are controllable.
Education
The environmental culture that children grow and develop in is
essentially determined by parents. Parents must understand the
detrimental effects that poor eating habits, a sedentary orientation and
low fitness have on the metabolic syndrome. For parents to provide
children with a healthy living environment, they must practice healthy
living themselves this should include regular health check ups , and
showing the child how to live.
of males and 2.1 % of females). Of adolescents with the syndrome, 73.9%
were overweight and 25.2% were at risk of overweight.
De Ferranti et al examined more than 3400 children and one in ten
had the metabolic syndrome.
Using a sample of adolescents from NHANES III, the overall
prevalence of the metabolic syndrome in moderately obese subjects was
found to be 38.7% and 49.7% in severely obese subjects by Weiss et al.
Age adjusted prevalence of overweight from national surveys(1963
to 1994) 12 – 17 yrs
Population group Males Females
ALL races
HYPERTENSION
Definition of blood pressure
Blood pressure is the lateral pressure exerted by the blood on the
vessel walls while flowing through it.
Lateral pressure is that pressure when force is exerted at right
angles to the direction of flow at any point within a tube filled with a
circulating fluid. Resistance is opposite to force.
Systolic pressure : The maximum pressure during systole.
Diastolic pressure : The minimum pressure during diastole.
Pulse pressure : The difference between systolic and accepted
diastolic pressure
Mean pressure : Diastolic pressure plus one third of pulse
PHYSIOLOGY
Physiological variations of blood pressure
A. AGE
Blood pressure rises with age.During infancy the systolic pressure
is from 70 – 90 mm Hg. In children it is 90 – 110 mmHg and at puberty
110- 120 mm Hg.
B. SEX
In females both systolic and diastolic pressures are slightly lower
than in males upto the age of 40 – 50 years.
C. BUILD
The systolic pressure is usually high in obese persons
D. EXERCISE
E. POSTURE
The diastolic pressure is slightly higher in the standing position. In
the recumbent posture the diastolic pressure is lower than in standing or
sitting posture.
F. SLEEP
Systolic pressure falls by about 15 – 20 mmHg during sleep.
G. AFTER INGESTION OF FOOD
There is a slight increase of systolic pressure
H. EMOTION OR EXCITEMENT
FACTORS CONTROLLING ARTERIAL BLOOD PRESSURE
1. Pumping action of the heart
2. Cardiac output
3. Peripheral vascular resistance: It is the resistance which the
blood has to overcome while passing through the periphery.
The chief seat of arterial resistance is the arterioles. It
depends upon the following
a. Velocity of blood
b. Elasticity of arterial walls
c. Lumen of blood vessels
4. Elasticity of arterial walls
5. Blood volume
SIGNIFICANCE OF BLOOD PRESSURE
The height of systolic pressure indicates:
1. The extent of work done by the heart
2. The force of pumping
3. The degree of pressure the arterial walls have to withstand.
Diastolic pressure indicates the measure of peripheral vascular
resistance against which the heart has to work constantly.
The normal function of blood pressure is
1. To maintain sufficient pressure head to keep the blood
flowing.
2. To provide for the motive force of filtration at the capillary
bed thus providing nutrition to the tissue, formation of
MEASUREMENT OF BLOOD PRESSURE
GENERAL PRECAUTIONS
Errors in measurement revolve around the patient, the instrument,
the technique of measurement and the examiner.
THE PATIENT
The level of arterial blood pressure both systolic and diastolic may
vary considerably with the phase of respiration or with the changes in
cardiovascular hemodynamics. Deep breathing, crying, laughing, anxiety,
recent activity and abnormal body temp may exert profound influences.
Thus it is important to reassure the patient and to allow time for recovery
from apprehension or recent activity. Since the state of relaxation is
generally less stable in children than in adults, greater difference with
consecutive measurements are often observed particularly with age group
THE CHOICE OF INSTRUMENT
The mercury manometer is the sphygmomanometer of choice as it
has the advantages of widespread general usage, reliability, accuracy and
of not requiring recalibration. The level of mercury at zero cuff pressure
and definition of the meniscus should be checked before measurement.
Aneroid manometers are inferior to the mercury type since the former are
more sensitive to jolt and mechanical error.
TECHNIQUE OF MEASUREMENT
The mercury column must be vertical and the eyes of the examiner
should be at the level of meniscus . The appropriate sized cuff should be
used.
The preparation of the child is essential for the determination of
BP. The examining room should be quiet. The procedure is fully
explained to the children and they are allowed to sit for 15 minutes to
recover from recent activity and apprehension. The children were
examined in a comfortable sitting position with right arm fully exposed,
resting on a supportive surface at the heart level. The manometer should
THE WIDTH OF THE CUFF
The Riva Rocci’s cuff which is too narrow may result in an error
on the higher side whereas one which is too wide may result in an error
on the lower side. Use of a narrow cuff requires higher inflation pressures
to compress the artery while the use of a cuff which is too wide
compresses a large segment of the vessel, resulting in increased resistance
to flow and a tendency for pulse to disappear before it reaches the lower
edge of the cuff.
Although Moss et al., established a relatively precise index for
proper cuff selection for a given child, for practical purposes it is
significant merely to select a cuff which covers about two thirds of the
DIMENSIONS FOR APPROPRIATE SIZE CUFF
Range of dimension of the bladder (in cm)Cuff name Width (cm) Length (cm) Newborn 2.5- 4 5 – 10 Infant 6 - 8 12 -1 3 Child 9 - 10 17 – 22.5 Adult 12 - 13 22 – 23.5 Large adult arm 15.5 30
Adult thigh 18 36
LENGTH OF THE CUFF
Ideal cuff should have a bladder length that is 80% and a width that
is at least 40% of the arm circumference.( Length to width ratio of 2:1
Pickering et al).
Data regarding the appropriate size cuff for measurement of blood
pressure in the lower extremity is lacking. The common impression that
arterial pressure is higher in the leg than in the arm is a misconception
The cuff should be applied snugly to the bare limb. A loosely
applied cuff results in ballooning of the bag and narrowing of the
effective surface.
THE EXAMINER
Determination of the blood pressure can be entrusted to physician’s
ability to hear the Korotkoff sounds and relate them to calibrated mercury
column. It is recommended that the average of atleast three readings of
systolic and diastolic pressures be accepted as the final estimate.
METHODS OF BLOOD PRESSURE MEASUREMENT
AUSCULTATORY METHOD
The diaphragm of the stethoscope is firmly applied over the cubital
fossa. It should not be in contact with the lower edge of the cuff. The cuff
should be inflated rapidly by about 30 mm of mercury above the systolic
BP detected by palpatory method and the cuff be deflated at 2 mm Hg per
result I a period between systolic and diastolic pressure during which all
vascular sounds disappear ( auscultatory gap). The auscultatory gap may
result in profound error in interpretation of either systolic or diastolic
pressure.
With cuff inflation above the peak pressure of the arterial pulse
wave, the artery is completely occluded. With gradual deflation , the
vessel opens and the pressure pulse is transmitted to the periphery and
the vascular sounds of Korotkoff become audible. These can be identified
as occurring in 5 distinct phases
Phase 1 : A sudden appearance of a sharp thud
Phase 2 : Prolongation of sound into a murmur
Phase 3 : Increased intensity of sound
Phase 4 : Muffling of sounds
Phase 5 : Complete disappearance of sounds
Available data indicate that in children, muffling is probably the
best index but neither muffling nor cessation accurately reflect intra
arterial pressure.
Muffling tends to give higher readings and cessation gives lower
reading. Latest recommendations of the American Heart Association
regards muffling as the best index of diastolic BP.
Some attention should be directed to the measurement of BP in
school going children. It is particularly here that proper selection of cuff
size is crucial.It is important to recognize that although some of the cuff
pressure may be dissipated by excessive fatty tissue. In view of higher
incidence of hypertension in these subjects, it would be a mistake to
dismiss on abnormally high readings on the basis of error due to cuff size.
ULTRASOUND
Ware et al., described the indirect measurement of systolic pressure
utilizing the Doppler principle. This method has been proved quite
reliable and a number of devices are commercially available . Antonio
Hernandez et al.
FLUSH METHOD
In 1952, Cappe et al., and Goldring et al measured the digital BP
by application of a pneumatic cuff to the wrist.
With the infant in a recumbent position, the arm and ankle cuffs are
applied. The extremity distal to the cuff is compressed by firmly
wrapping it with a soft wide rubber drain, an elastic bandage the purpose
of which is to drain the hand or foot of the blood. The wrapping should
begin at the tips of the digits working proximally to the lower edge of the
cuff. Compression with one hand is to be condemned since it often
produces inaccurate results because of incomplete drainage leading to
poor definition of the end point. A 5 cm cuff is generally easier to work
with but it has been established that various cuffs from 5 – 9.5 cm in
pressure, a level is eventually reached at which there is a definite flushing
of the blanched distal portion of the extremity. This is the end point with
a deflation rate not exceeding 5 mmHg /second. The end point has been
found to approximate the mean arterial pressure.
Viring et al., recognized that severe anemia, edema and marker
hypothermia may adversely affect the end point. Although there are
conflicting opinions, it appears that the flush BP is greater in the wrist
PALPATORY METHOD
This is the oldest one, seldom used alone. The radial pulse is
located and the pressure in the pneumatic cuff is raised above the level at
which palpable pulsation disappears. With gradual deflation of the cuff,
the pulsation reappears . The first palpable sound is considered as the
systolic BP. This is usually 5 – 10 mm lower than auscultatory method.
VISUAL OSCILLOMETRY
This method was first introduced in 1904 and is based on
visualization of the oscillations transmitted by the arterial pulse to the
mercury column in the manometer. With cuff deflation, the level at which
the oscillation appears and disappears is read as the systolic and diastolic
AIM OF THE STUDY
1. To assess the prevalence of • at risk of overweight • overweight and
• asymptomatic hypertension
in adolescent boys and girls 12 – 16 yrs of age
2. To assess the association of risk factors like • Sex
• Socioeconomic status • Family H/O obesity • Family H/O HT/DM and • Hours of physical activity
SUBJECTS AND METHODS
STUDY DESIGN : Cross sectional survey/Case control study
PLACE OF STUDY : Middle schools ,high schools and higher
secondary schools that belong to The
Corporation of Chennai and private
schools of Chennai.
DURATION : February 2007 – April 2008
EXCLUSION CRITERIA
Obesity due to endocrine abnormalities
Syndrome associations
Secondary hypertension Cardiac / Renal disease Chronic drug intake
SAMPLE SIZE:
For an existing prevalence of 10%, with 20% precision accuracy
and 95% confidence interval , sample size calculated by formula is 1060
n = 1060
CASES: Children “at risk of overweight” and
“overweight”
RISK FACTORS:
1. SEX
2. SOCIOECONOMIC STATUS
The modified Kuppusamy Scale ( 1997-1998)
was used which takes into consideration education and
occupation of the parent and the monthly per capita
income. Children with a score of fifteen and above were
arbitrarily assigned to the high socioeconomic status and
those with score <15 were put in the low socioeconomic
group
3. FAMILY H/O HT/DM
4. FAMILY H/O OBESITY
5. PHYSICAL ACTIVITY
Arbitarily those children with a physical activity of < 30 minutes
METHODOLOGY:
The subjects of the study were adolescent school children between
the ages of 12 – 16 years of both sexes and belonging to high and low
socioeconomic classes as per the modified Kuppusamy’s scale.
Age was taken in completed years from the school records.
Height was taken using a vertical scale to the nearest 0.5 cm.
Weight was measured using a standard weighing scale to the
nearest 0.5 kg.
The procedure was informed to all children and measures had been
taken to reduce their anxiety. Their cooperation was sought specifically
for information regarding their father’s education, occupation ,monthly
income, no of family members, family H/O obesity, HT/DM, hours of
RECORDING OF BLOOD PRESSURE
A cordial atmosphere was created to do an unhurried and relaxed
examination. A cursory physical examination was done to rule out
endocrine, cardiac and renal problems. BP recording was done as the last
part of the examination to allay the anxiety of the child. Prior to recording
the child was asked to void urine and basal pressures were obtained. The
basal pressure in adolescents seems to be a better predictor of essential
hypertension in adulthood than casual blood pressure.
The instrument used was mercury sphygmomanometer in
conjunction with a good stethoscope for all ages. Cuff sizes of 7 cm and
12 cm were used and care was taken to select an appropriate sized cuff
which covered two third of the arm. All observations were made in the
right arm with the child properly seated and the sphygmomanometer at
the child’s heart level. The cuff was firmly placed over the brachial
artery and inflated to 30 mm Hg above the systolic BP calculated by the
palpatory method. Then the cuff was deflated by 2 – 4 mm per second.
The appearance of the first Korotkoff sound and muffling were taken as
STATISTICAL ANALYSIS
To examine the various determinants of overweight & obesity like
sex, socioeconomic status, family H/O obesity, family H/O HT & DM
and physical activity, univariate and multivariate analysis (logistic
regression ) were performed.
The unadjusted & adjusted odds ratio were computed for
overweight with other risk factors collected in the study.
All analysis were two tailed and a p value of <0.05 was considered
statistically significant. Statistical analysis was performed using SPSS
OBSERVATIONS
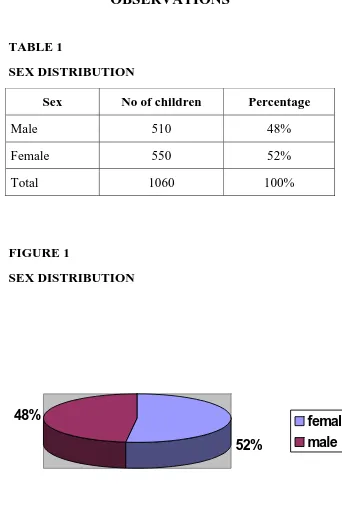
TABLE 1
SEX DISTRIBUTION
Sex No of children Percentage
Male 510 48%
Female 550 52%
Total 1060 100%
[image:33.612.146.488.84.594.2]FIGURE 1
SEX DISTRIBUTION
52%
48%
female
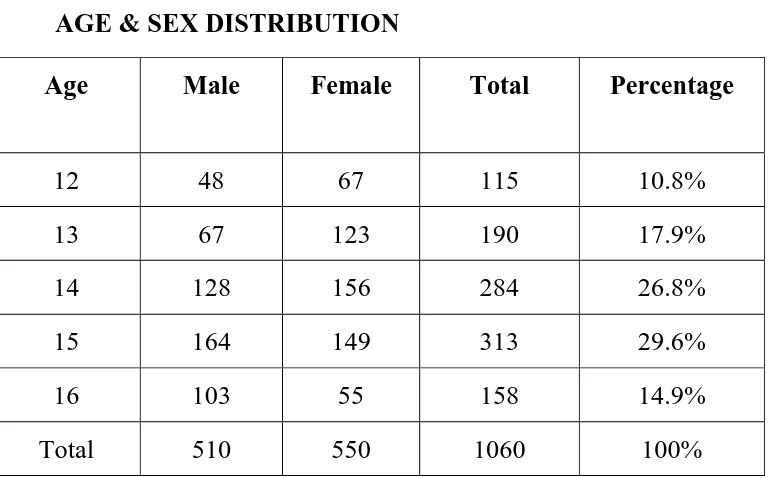
TABLE 2
AGE & SEX DISTRIBUTION
Age Male Female Total Percentage
12 48 67 115 10.8%
13 67 123 190 17.9%
14 128 156 284 26.8%
15 164 149 313 29.6%
16 103 55 158 14.9% Total 510 550 1060 100%
Highest number of cases studied was in the age group 15 yrs. In the
TABLE 3
MEAN AND PERCENTILE POSITION FOR SYSTOLIC BP BASED ON AGE AND SEX
MALE
FEMALEAge
(yrs)
n Mean ± SD 5th 95th n Mean ± SD 5th 95th
12 48 112.58 ± 9.91 97.8 125.2 67 107.61±10.45 94.0 120.8
13 67 113.58 ± 9.73 100 126.4 123 109.06±11.11 92.4 124.0
14 128 113.48 ± 9.78 97.8 128.2 156 112.29±11.38 94.0 124.6
15 164 114.04±11.38 96.0 129.0 149 111.91±11.99 90 128.0
TABLE 4
MEAN AND PERCENTILE POSITION FOR DIASTOLIC BP BASED ON AGE AND SEX
MALE FEMALE Age
(yrs)
n Mean ±SD 5th 95th n Mean ±SD 5th 95th
12 48 74.25±5.11 67 78.2 67 69.85±8.64 64.0 76.2
13 67 73.46±6.44 68.2 79.6 123 72.23±7.76 66.0 78.4
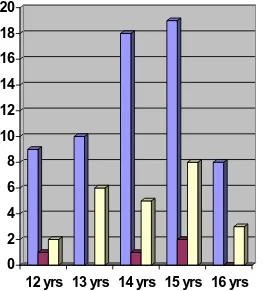
TABLE 5
TYPE OF HYPERTENSION IN VARIOUS AGE GROUPS
12 yrs 13 yrs 14 yrs 15 yrs 16 yrs
Male Female Male Female Male Female Male Female Male Female
Normal BP 40 51 60 104 112 127 139 124 88 50
Systolic HT 6 3 5 5 8 10 11 8 6 2
Diastolic HT 0 1 0 0 1 0 0 2 0 0
Both 0 2 1 5 2 3 5 3 2 1
Low BP 2 10 1 9 5 16 9 12 7 2
Chisquare
FIGURE 2
TYPE OF HYPERTENSION IN VARIOUS AGE GROUPS
0
2
4
6
8
10
12
14
16
18
20
12 yrs 13 yrs 14 yrs 15 yrs 16 yrs
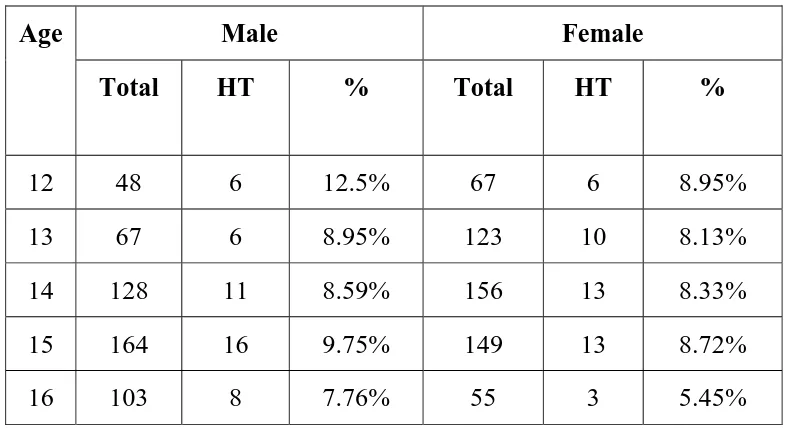
TABLE 6
AGE RELATED HYPERTENSION
Male Female Age
Total HT % Total HT %
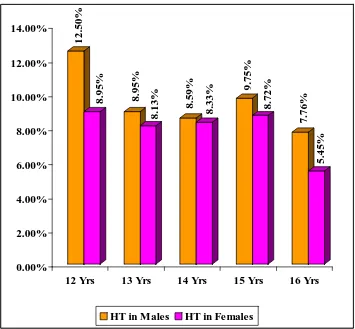
FIGURE 3
PREVALENCE OF HYPERTENSION IN VARIOUS AGE GROUPS
12.50%
8.95% 8.95%
8.13%
8.59%
8.33%
9.75%
8.72%
7.76%
5.45%
0.00% 2.00% 4.00% 6.00% 8.00% 10.00% 12.00% 14.00%
12 Yrs 13 Yrs 14 Yrs 15 Yrs 16 Yrs
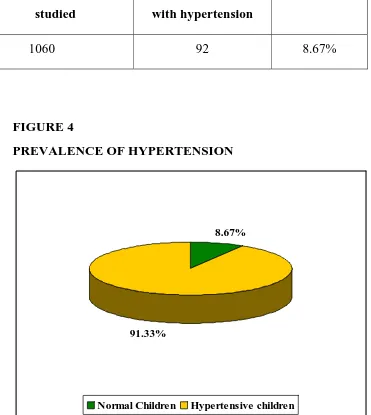
TABLE 7
PREVALENCE OF HYPERTENSION
Number of children studied
Number of children with hypertension
Percentage
1060 92 8.67%
FIGURE 4
PREVALENCE OF HYPERTENSION
8.67%
91.33%
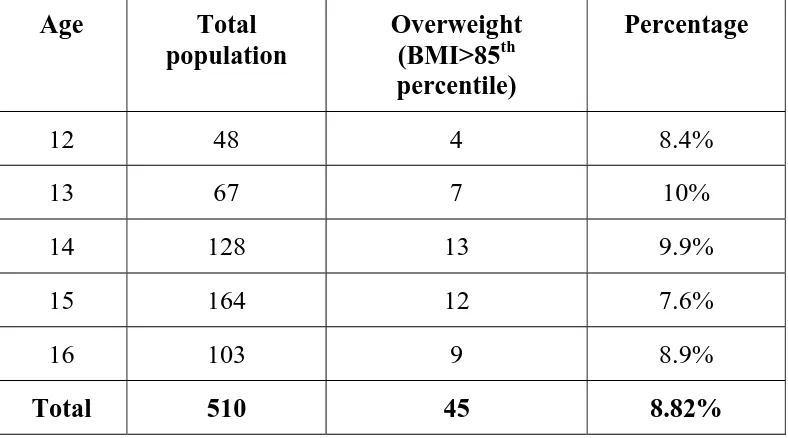
[image:41.612.142.513.181.596.2]TABLE 8
PREVALENCE OF OVERWEIGHT AMONG MALES
Age Total population
Overweight (BMI>85th percentile)
Percentage
12 48 4 8.4%
13 67 7 10%
14 128 13 9.9%
15 164 12 7.6%
16 103 9 8.9%
FIGURE 5
PREVALENCE OF OVER WEIGHT AMONG MALES
8.40%
10.00% 9.90%
7.60%
8.90%
0.00% 2.00% 4.00% 6.00% 8.00% 10.00% 12.00%
12 Yrs 13 Yrs 14 Yrs 15 Yrs 16 Yrs
TABLE 9
PREVALENCE OF OVERWEIGHT AMONG FEMALES
Age Total population
Overweight (BMI>85th percentile)
Percentage
12 67 8 11.9%
13 123 16 13.4%
14 156 19 12.08%
15 149 16 10.57%
16 55 7 13.07%
FIGURE 6
PREVALENCE OF OVER WEIGHT AMONG FEMALES
11.90%
13.40%
12.08%
10.57%
13.07%
0.00% 2.00% 4.00% 6.00% 8.00% 10.00% 12.00% 14.00% 16.00%
12 Yrs 13 Yrs 14 Yrs 15 Yrs 16 Yrs
FIGURE 3
PREVALENCE OF OVERWEIGHT AMONG BOYS
91% 9%
FIGURE 4
PREVALENCE OF OVERWEIGHT AMONG FEMALES
88% 12%
TABLE 10
RISK FACTORS FOR OVERWEIGHT AMONG 12 – 16 YR OLDS – A UNIVARIATE ANALYSIS
Cases Control S
N o
Risk factor
n % n %
OR (95% CI) p valu e Femal e
66 12% 48 4
88% 1.
Sex
Male 45 8.82 % 46 5 91.18 % 1.388 (1.115 -1.727) 0.00 4
High 10 2 17.1 % 49 9 82.9% 2. Socioeconomi
c status
Low 42 9.1% 41 7 90.7% 2.062 (1.409 -3.017) 0.00 0
Yes 13 14.2 %
81 85.8% 3. Family H/O
HT/DM
1.665 (1.205
<30 min
31 9.8% 28 9
90.2% 5. Physical
activity
>30 min
69 9.4% 67 1
90.6%
0.959 (0.761 - 1.209)
TABLE 11
RISK FACTORS FOR OVERWEIGHT IN CHILDREN 12 – 16 YRS – A MULTIVARIATE ANALYSIS
95% CI Risk factor SE df Significance OR
Lower Upper
Family H/O HT/DM 0.170 1 0.002 1.677 1.203 2.339
Family H/O
obesity
0.225 1 0.000 4.679 3.089 7.276
High socioeconomic status
0.119 1 0.000 2.179 1.475 3.220
DISCUSSION
A total of 1060 cases in age groups 12 – 16 yrs of age was
tabulated. The highest no of case were studied in the age group of 15 yrs.
And lowest number in the age group of 12 yrs.
The mean systolic & diastolic BP levels of the 1060 children were
studied in relation to age in both sexes. BP levels were found to increase
progressively with age.
The gradual increase in mean systolic & diastolic BP of boys &
girls with age as noted by us agrees with the findings of The Task Force
Committee Report and other workers. Dubest Londe et al.,
The mean systolic pressure of males for various age groups are
higher than females. The difference in diastolic pressure between males
and females is negligible.
In Indian school children an increase in systolic BP & diastolic BP
with age has also been reported by various authors – Chahar et al., Verma
et al., Anand & Tandon, Chadha et al.,
In the present study , the value of systolic & diastolic BP is slightly
lower among girls than boys but the difference was not found to be
statistically significant in most of the age groups. This is consistent with
the finding of Laroia et al., Voors et al, Anand & Tandon et al., Chadha et
al.
The prevalence of HT in school children of Chennai is 9.21% in
boys & 8.18% in girls in our study. According to Chadha et al., the
prevalence of HT in Delhi school children of age 5 – 14 yrs is 11.7%.
Anjana,Prabhjot et al., reported a prevalence of 7.5% in boys & 6.52% in
girls in Amritsar. But Chahar et al .,Agarwal et al & Anand & Tandon
In the present sample , sex difference in the prevalence of HT was
not statistically significant ( p value> o.o5). the finding that there are no
appreciable sex difference in the prevalence of Ht among school children
has also been observed by Chadha,Anand & Tandon, Voors et al.,
In our study, the prevalence of overweight is 10.47%(111/1060).
Overweight among males was 8.82% (45/510) and among females was
12% (66/550).
Prevalence of overweight among low socioeconomic status was
9.1% compared to 17.1% among high socioeconomic status in our study.
Family H/O HT/DM among overweight children was 13%
compared to 8.4% in others.
Overweight children were 4 times more likely to have a family
H/O of obesity compared to children with normal BMI [OR(95% CI)
4.20(2.728- 6.486)].
Overweight children were 1.3 times more likely to be females
Physical activity was not found to be a significant risk factor by
univariate analysis by our study.
The factors which wre found to be significant by univariate
analysis namely family H/O HT/DM, family H/O obesity, high
socioeconomic status and female sex were included for multivariate
analysis.
Three risk factors namely
Family H/O HT/DM [OR (95% CI) 1.677 (1.203 – 2.339)] &
Family H/O obesity [OR (95%CI) 4.679(3.009- 7.276)] &
High socioeconomic status [OR (95% CI) 2.179 ( 1.475 – 3.220)]
were found to be independent risk factors for overweight by multivariate
SUMMARY
• The prevalence of HT (BP> 95th percentile) in adolescent children 12 – 16 yrs was found to be 9.21 % in boys and
8.18% in girls.
• BP levels were found to increase progressively with age.
• “At risk for overweight” and “overweight” ( BMI >85th percentile) had an overall prevalence of 10.47% ( 8.82% in
males and 12% in females.
• High socio economic status, family H/o obesity and family H/O HT/DM were found to be independent risk factors for
BIBLIOGRAPHY
1. The metabolic syndrome in children and adolescents – An IDF consensus report ( Pediatric Diabetes 2007;8:299- 306).
2. Cook.S. et al.,Prevalence of a metabolic syndrome phenotype in adolescents. Findings from the third National Health & Nutrition Examination Survey, 1988- 1994. Arch Pediatr Adol Med 2003; 157:821-7.
3. De Ferranti et al,Circulation 2003;108:17;727 – 731.Meeting abstract #3286.
4. Weiss.R, et al . Obesity and the metabolic syndrome in children & adolescents. NEJM 2004;350:2362 – 74.
5. Trojano RP,Flegal KM. Age adjusted prevalence of overweight from national surveys ( 1963 to 1994). Pediatrics 1998;101:497 – 504.
6. Body mass index for age percentile chart for boys and girls. National center for health statistics. Published May 30, 2000.
10. Williams CL, HAYMAN LL,Daniels SR et al. Cardiovascular health in childhood: A statement for health professionals from the Committee on Atherosclerosis, Hypertension, and Obesity in the Young ( AHOY) of the Council of Cardiovascular Disease in the Young, American Heart Association. Circulation. 2002;106 :143 – 160.
11. Ramachandran A, Snehalatha C et al . Rising prevalence of NIDDM in an urban population in India. Diabetologia 1997; 40:232 – 7.
12. David L . Lee . Overweight children - Prevalence, problems and solutions. FCSN 547 , Nutrition Update, Summer 2004.
13. Csabi G,Torok K,Jeges S.Presence of metabolic cardiovascular syndrome in obese children . Eur J Pediatr 2000;159;91-94.
14. He Q, Ding ZY et al. Blood pressure is associated with BMI in both normal and obese children. Hypertension 2000; 18:499 – 502.
15. Anjana , Prabjot et al. Variation in BP among school children of Punjab (Amritsar). Anthropologist, 7 (3): 201 – 204 (2005).
16. Aggarwal, V.K., Sharan et al. Blood pressure profile in children of age 3 – 15 yrs. Ind pediatr.,20:921-925 (1983).
17. Anand NK , Tandon L. Prevalence of HT in school going children. Indian periatr 33:337 -381 (1996).
19. Chadha SL,Tandon R.An epidemiological study of blood pressure in school children 5 – 14 yrs in Delhi. Ind heart J .,51:178- 182 (1999).
20. Chahar CK ,Shekawat et al. A study of Blood pressure in school children in Bikaner. Ind.J.Pediatr 49:791-794 (1982).
21. Gupta ,AK. Influence of morbid cardiovascular event on BP level of school children. Ind. Pediatr., 28:131-139 (1991).