OPTICAL COHERENCE TOMOGRAPHIC FEATURES
OF MACULAR PATHOLOGIES IN DIABETIC
RETINOPATHY
Dissertation submirtted to Tamil Nadu Dr.M.G.R. Medical University, Chennai
OPTICAL COHERENCE TOMOGRAPHIC FEATURES OF MACULAR
PATHOLOGIES IN DIABETIC RETINOPATHY
Dissertation submitted to
THE TAMILNADU Dr. M.G.R. MEDICAL UNIVERSITY
CHENNAI, INDIA
M.S. DEGREE EXAMINATION
BRANCH – III, OPHTHALMOLOGY
INSTITUTE OF OPHTHALMOLOGY
JOSEPH EYE HOSPITAL , TIRUCHIRAPALLI
This is to certify that the dissertation entitled OPTICAL COHERENCE TOMOGRAPHIC FEATURES OF MACULAR PATHOLOGIES IN DIABETIC RETINOPATHY is a Bonafide work done by Dr.M.MURALI , MS, student during May 2005 to March 2008 under our direct supervision and guidance at our institute in partial fulfillment of regulations governing the award of Master of Surgery Branch III ophthalmology Tamilnadu Dr.MGR MEDICAL UNIVERSITY CHENNAI MARCH 2008.
Dr. C.A.Nelson Jesudasan , MS, DOMS, FRCS( Edin and Glas) Professor and Director
Dr. M.Rajamohan , MS, DO, CCEH (London) Professor and HOD Retina ( Guide)
Dr. Amjad Salman, MS (ophthal) Professor and Registrar (Co-Guide)
ACKNOWLEDGEMENT
I thank Dr. C.A. Nelson Jesudasan, Director and Professor, Institute of Ophthalmology, Joseph Eye Hospital, Trichy, for his support and guidance rendered in this study.
I thank Dr. M. Rajamohan, Professor and HOD of retina, Institute of Ophthalmology, Joseph Eye Hospital, Trichy, Guide for his guidance, that I received in every step of this study.
I thank Dr . Amjad salman, Professor and Registrar, Institute of Ophthalmology, Joseph Eye Hospital, Trichy, co guide for his guidance ,that I received in every step of this study.
I thank Dr. Prathiba, Reader and RMO, Institute of Ophthalmology, Joseph Eye Hospital, Trichy. for timely help and advice given to me during this study.
I thank Dr. V. M. Loganathan, Formerly Professor and Director RIOGOH Chennai for his advice given to me during this study.
I thank Mr. Rajkumar , Librarian, Mr. Venkataraman Assistant Registrar, Mr. Daniel Prince, Assistant Librarian for their support during the study
I thank my mother Mrs. Sarojini and my wife Mrs .Leela and my children Swathika and
CONTENTS
INTRODUCTION ………… 1
AIMS AND OBJECTIVES ………… 2
REVIEW OF LITERATURE ………… 3
MATERIALS AND METHODS …………. 22
RESULTS …………. 27
DISCUSSION ………… 48
SUMMARY ………… . 51
CONCLUSSION …………. 52
BIBLIOGRAPHY …………. 53
APPENDIX …………. 57
___________________________________________________________________
INTRODUCTION
High resolution cross sectional imaging of retina is useful for
identifying ,monitoring and quantitatively assessing macular disease . Optical
Coherence Tomography (OCT) Is a new medical diagnostic imaging technology
which can perform high resolutional cross sectional tomographic imaging in
biological tissues. Cross sectional images of retina are obtained at the resolution 10
microns. OCT uses low coherence or white light interferometry to perform high
resolutional measurements and imaging. The infra red light beam has a wave length
of 820nm
Macular pathologies in diabetic retinopathy consists of 1)Macular
edema which may be localized , diffuse , CSME and ischemic which may show on
OCT as (a) Sponge like thickening (b) Cystoid macular edema (c) Subfoveal serous
detachment (d) Taut posterior hyaloid membrane (e) Foveal tractional retinal
detachment
OCT offers an objective method for qualitative identification and
quantitatively monitoring and evaluation of patients with diabetic maculopathy which
are not seen clinically and by FFA
___________________________________________________________________
AIMS AND
OBJECTIVES
AIMS OF THE STUDY
To study the OCT features of various macular pathologies in diabetic retinopathy.
To compare these features with clinical features and fundus fluorescein angiographic features.
To compare foveal thickness by OCT with visual acuity.
To quantitatively monitoring the response by measuring the foveal thickness by OCT in various types of diabetic macular pathologies after Intra vitreal
REVIEW OF LITERATURE
ANATOMY OF MACULA [1]
Macula refers to that part of central retina having a diameter of 5.5mm
and limited by superior and inferior temporal vascular arcades, including optic disk
on nasal side and histologically by outer boundary of perifovea where the ganglion
cells are reduced to a single layer
PARTS OF THE MACULA
UMBO it is a tiny depression in the very center of the foveola which corresponds to the ophthalmoscopically visible foveal reflux
FOVEOLA (350microns-0.35mm) it is a small central region in which the thickness of retina is reduced so as to contain only photoreceptors glialcells and
mullercells
FOVEAL AVASCULAR ZONE(FAZ-800microns-0.8mm)it is located inside fovea but outside foveola
FOVEA (1500microns-1.5mm)it is a small depression where the retina is reduced to half its normal thickness. Moving towards the centre of retina the inner nuclear
PARA FOVEAL AREA (2500microns-2.5mm) it is characterized by densest accumulation of nerve cells in the entire retina especially ganglion cells and inner
nuclear layer. The outer boundary is the point where the ganglion cell layer has
four rows of nuclei
PERI FOVEAL AREA(5500 microns-5.5mm) it ends where ganglion cells are reduced to a single layer
HISTOLOGY OF MACULA: The center of macula is the fovea containing the following layers; internal limiting membrane, outer plexiform layer, outer nuclear
layer, layer of cones, and retinal pigment epithelium.
DIABETIC RETINOPATHY
Diabetic retinopathy is a leading cause of severe loss of visual acuity (3rd common
cause) in the world. About 25% of diabetic patients have sight threatening levels of
retinopathy with legal blindness. DR being 25 times more common in diabetics when
compared to the non diabetic population (2)
ETIOPATHOGENESIS
The exact cause of diabetic microvascular disease is unknown. It is believed that
exposure to chronic hyperglycemia results in a number of biochemical and
physiological changes that ultimately causes vascular endothelial damage.
There is an association between higher levels of glycosylated hemoglobin (Hb A1c)
and diabetic retinopathy and CSME HLA B 8, B15, DR3, DR4, is more commonly
found more in patients with IDDM than NIDDM.
PATHOGENESIS OF MICROVASCULAR OCCLUSION (AAO-2000-2001)
1) Basement membrane thickening,2) Damage and proliferation of endothelial cells.
3) Erythrocyte aggregation leading to defective O2 transport. 4) Increased platelet
adhesiveness 5] Abnormal levels of growth hormones like VEGF. 6) Defective
fibrinolysis. 7) Abnormal serum lipids. 8) Increased blood viscosity .All these leading
to
B) Loss of pericytes leading to physical weakening of capillary wall resulting in
localized vascular out pouching termed micro aneurysms which may leak or
become thrombosed
FEATURES OF DIABETIC RETINOPATHY
1) VENOUS CHANGES: Earliest, consists of dilatation of veins and later looping,
beading and sausage like segmentation, FFA shows these findings
2)MICROANEURYSMS: Earliest due to weakening of capillary walls, results in
localized secular out pouching of vessel wall and appears as tiny round red dots
.FFA shows hyper fluorescent dots
3) HARD EXUDATES: Due to capillary leakage and appears as waxy yellow lesions
with relatively distinct margins often arranged in clumps or rings around blood
vessels at posterior pole. FFA shows hypo fluorescence due to blockade of
background choroidal fluorescence. OCT shows hyper reflective lesions
4) HEMORRHAGE: Intra retinal dot and blot; Arises from venous end of capillaries
located in compact middle layers of retina .Blot hemorrhages due to hemorrhagic
infarcts ,Nerve fiber layer flame shaped Hemorrhage arises from superficial pre
capillary arterioles FFA shows blocked fluorescence (18,19).OCT shows in thin
hemorrhages increased scattering and hyper reflective lesions and thick
hemorrhages blocks the reflections from under lying structures and appears hypo
reflective
5) COTTON WOOL SPOTS: They represent focal infarcts of retinal nerve fiber layer
axoplasmic transport with subsequent build up of transported materials within axons
(axoplasmic stasis) and appears as white fluffy superficial lesions with ill defined
borders and obscures underlying blood vessels and seen mostly in post equatorial
retina. FFA shows hypo florescence due to capillary non perfusion. OCT shows
hyper reflective lesions
6)INTRA RETINAL MICROVASCULAR ABNORMALATIES(IRMA): They represent
shunts that run from retinal arterioles to venules bypassing capillary bed and are
therefore often seen adjacent to areas of capillary closure. They are seen as fine
red lines running from arterioles to venules thus resembling focal areas of flat retinal
new vessels but they are intra retinal location and fail to cross major blood vessels.
FFA shows hyper fluorescence with absence of leakage adjacent to areas of
capillary closure
7) ARTERIAL CHANGES: Narrowing, obliteration and silver wiring.
8) NEOVASCULARISATION: They are fresh endothelial channels arising due to
severe ischemia and appear frond like rising above retina may be associated with
fibrous tissue which may appear over the disc or within 1disk diameter around the
disk(NVD) or they may appear in other areas elsewhere(NVE) which may be high
risk or low risk. FFA shows hyper fluorescence with leakage
NVD Low risk < 1/3DD, NVD High risk >1/3DD, associated with hemorrhage
9) INVOLUTIONAL, END STAGE, BURNT OUT RETINOPATHY: Attenuated
vessels pale disk, neovascularisation replaced by glial scar tissue, opaque
membranes and tractional retinal retinal detachment
ETDRS CLASSIFICATION OF DIABETIC RETINOPATHY (4,5)
1) NON PROLIFERATIVE DIABETIC RETINOPATHY.
A) MILD: Few micro aneurysms in less than 4 quadrants
Few dot hemorrhages in less than 4 quadrants
Hard exudates and macular edema may or may not
be present
B) MODERATE: Micro aneurysms or dot haemmorages present in 4
Quadrants
Hard exudates, Macular edema, cotton wool spots
Venous beading and looping in 1 quadrant
C) SEVERE (4:2:1rule): Severe intra retinal hemorrhages (dot and blot) in 4
Quadrant
Venous beading in 2 quadrants
IRMA in 1 quadrant
Along with microaneurysms ,hardexudates, macular
edema, cws
D) VERY SEVERE: Any 2 of the features of NPDR
DIABETIC MACULOPATHY(6,7,8,9)
Due to involvement of macula by edema and hard exudates due to
capillary leakage or ischemia due to capillary closure and it is the most common
cause for visual impairment in diabetic patients mostly type 2 diabetics which may
be
Focal exudative
Diffuse exudative
CSME
Ischemic
Mixed
FOCAL EXUDATIVE:
Well circumscribed retinal thickening due to edema associated with complete or
incomplete rings of perifoveal hard exudates. FFA shows late focal hyper
fluorescence due to focal leakage with good macular perfusion .OCT shows focal
sponge like thickening
DIFFUSE EXUDATIVE:
Diffuse retinal edema and thickening which may be associated with cystoid changes
with obliteration of land marks which may render localization of the fovea impossible.
FFA shows widespread late diffuse hyperfluorescence with flower petal pattern if
cystoid macular edema is present, OCT shows diffuse sponge like thickening and
CLINICALLY SIGNIFICANT MACULAR EDEMA; (CSME);
1) Retinal edema within 500 microns of centre of fovea
2) Retinal edema of one disk diameter(1500 microns) or larger any part of which
is within one disk diameter of centre of fovea
3) Hard exudates within 500 microns of centre of fovea with adjacent retinal
edema which may be outside 500 microns
FFA shows focal hyper fluorescence or blocked fluorescence within 500 microns of
centre of fovea .OCT shows sponge like or cyst like spaces within 500 microns
ISCHEMIC MACULOPATHY: Due to macular non perfusion with decreased visual
acuity with relatively normal appearance of fovea . Dark blot haemmorages may be
seen .FFA shows capillary non perfusion areas at the fovea and enlargement of
foveal avascular zone (FAZ)
MIXED EXUDATIVE AND ISCHEMIC: Signs characterized by features of both
Optical Coherence Tomography
Optical Coherence Tomography is a new diagnostic tool that can perform
tomography / cross – sectional imaging of biological tissues with ≤10 microns axial
resolution using light waves.
Principle:
It uses infrared light. The speed of light is almost a million times faster than sound
and this difference allows the measurement of structures with resolution of ≤ 10
microns compared to 100 micron scale of ultrasound. Ultrasound needs contact with
the tissue under study, whereas OCT does not, require any contact.
It is a non contact, non – invasive device where a broad band width of near infra –
red light beam (820nm) is projected on to the retina. The light gets reflected from the
boundaries between the microstructure and also gets scattered differently from
tissues with different optical properties. It then compares the echo time delay of the
same wavelength that is reflected from a reference mirror at a known distance.
Optical coherence tomography uses, low coherence or white light interferometry to
An optical beam from a laser or light source which emits short optical pulses or short
coherence length light, is directed onto a partially reflecting mirror (optical beam
splitter). The partially reflecting mirror splits the light into two beams, one beam is
reflected and the other is transmitted. One light beam is directed on to the patients
eye and is reflected from intraocular structures at different distances.
The reflected light beam from the patient’s eye consists of multiple echoes which
give information about the range or distance and thickness of different intra-ocular
structures. The second beam is reflected from a reference mirror at a known spatial
position. This retro-reflected reference optical beam travels, back to the partial mirror
(beam splitter) where it combines into the optical beam reflected from the patient’s
eye.
When the two light pulses co inside they produce a phenomenon known as
interference which is measured by a light sensitive detector (photodetector). Thus
the interferometer can precisely measure the echo structure of reflected light and
perform high resolution measurements of the distance and thickness of different
tissue structures.
The key feature of interferometer is that it can measure the time delay of optical
echoes by comparing the reflected light beam with a reference beam. While the
explanation presented here assumes that the light is composed of short optical
pulses, the measurement may also be performed using non-pulsed or continuous
light with a short coherence length. For this reason, the measurement techniques
The light source for the interferometer is a compact super luminescent diode, which
is coupled directly into an optical fiber. This light source is similar to laser diode used
in optical compact disc players, except in OCT, the diode source is designed to emit
short coherence length light. The interferometer is constructed using a fiber optic
coupler which functions, analogous to a beam splitter. The arm of the interferometer
which consists of reference mirror is located within the instrument, while the optical
fiber in the second arm of the interferometer is connected to the OCT ophthalmic
instrument resembling a slit lamp biomicroscope or fundus camera.
Image resolution
The image resolution of OCT in the axial (or longitudinal) verses transverse
directions is determined by different mechanisms. The resolution of the image in the
axial (longitudinal) direction is determined by the resolution of the optical ranging
measurement. This is determined by the physical properties of light source which is
used for the measurement. If a short pulse laser source is used, the axial resolution
is determined by the pulse duration. Conversely, if a continuous, low-coherence light
source is used, the axial resolution is determined by the ‘coherence length’ of the
light source. It is important to note that the measurement of distance or tissue
thickness can, in practice, be performed with significantly higher resolution than this
limit.
The transverse resolution of the image is determined by the size of the focused
optical beam. This is a function of the optics used to project the beam onto the eye
depth, such as in the anterior eye, or whether the focusing angle is restricted, as in
imaging the retina. The image resolution is also a function of the size of the
tomogram that is desired.
OCT Scan Protocols in Macula
The protocols that are helpful in macular diseases are the following.;
(i) Line Scan
The line scan gives an option of acquiring multiple line scan without returning to
main window. The length of the line scan and the angle can be altered, though one
has to keep in mind that as the scan length increases the resolution decreases.
(ii) Radial Lines
The scan protocol consists of 6 -24 equally spaced line scans that can be varied in
size and parameters. All the lines pass through a central common axis. The radial
lines are useful for acquiring macular scan and retinal thickness / volume analysis.
(iii) Macular thickness map
This is the same as radial lines except that the aiming circle has a fixed, diameter of
(iv) Fast macular thickness map
It is designed for use with retinal thickness analysis. When done in both the eyes, it
can be used for comparative retinal thickness / volume analysis. It is a quick protocol
that takes only 1.95 sec to acquire six scans of 6mm length each
(v) Raster Line
This provides an option of acquiring series of line scans that are parallel, equally
spaced and are 6 – 24 in number. These multiple lines scans are placed over
rectangular regions, the area of which can be adjusted so as to cover the entire area
of pathology. This is especially useful in conditions like choroidal neovascular
membrane one wishes to obtain scans at multiple levels.
(vi) Repeat:
Repeat protocol enables one to repeat any of the previously saved protocols using
same set of parameters, that includes scan size, angle, placement of fixation, light
emitting diode (LED) and landmark.
Normal macular scan
On a 10mm horizontal line scan passing through the foveal centre, one can clearly
demarcate two major landmarks namely optic disc and fovea.
The optic disc is seen towards the right of the tomogram and is easily identifiable by
continuing behind is the anterior part of the optic nerve. The fovea is seen to the left
and is easily identifiable by the characteristic thinning of retinal layers. The vitreous
anterior to the retina is non-reflective and is seen as a dark space. The interface
between the non – reflective vitreous and back scattering retinal layers is the
vitreoretinal interface. The retinal nerve fiber layer (NFL) is highly reflective and
increases in thickness towards the optic nerve. The posterior boundary of the retina
is marked by a hyper – reflective layer that represents retinal pigment epithelium
(RPF) and chorio capillaries.
Just anterior to RPE – choriocapillaries complex, is a minimally reflective layer that
represent photoreceptors. Above this layer of photoreceptors are alternating layers
of moderate and low reflectivity that represents different layers of neurosensory
retina. The retinal blood vessels within the neurosensory retina shows back scatter
and also cast a shadow behind.
Image Interpretation: a) Objective
b) Subjective
1) Objective
Hard exudates: are seen as hyper – reflective shadows in the neurosensory retina
that completely blocks the reflections from the underlying retina.
Blood: Blood causes increasing scattering. Small to thin hemorrhages are seen as
hyper reflective lesions .Thick hemorrhages blocks the reflections from the
underlying structure.
Scars : All fibrotic lesions including disciform scars, choroidal rupture scars, healed choroiditis etc are hyper – reflective.
Hypo – reflective lesions are:
Serous fluid: Retinal edema is the commonest cause of reduced back scattering
and one can actually point out the site of fluid accumulation. The serous fluid that is
devoid of any particular matter, produces an optically empty space with no back
scattering.
Hypo – pigmented lesions of RPE.
Subjective analysis. Qualitative,
Protocols are a) Normalize b) Align
Quantitative:
a) Retinal thickness / volume
b) Retinal thickness or volume tabular c) Retinal thickness / volume change
Advantages of OCT over FFA
• Non contract, non invasive
• Time saving technique
• Totally avoids mild complications like nausea to life threatening hypersensitivity
reactions seen in FFA.
• Measurement of retinal thickness by OCT correlate more strongly with visual
acuity than the presence of leakage on angiography.
• OCT is effective and superior to FFA in demonstrating axial distribution of fluid.
• Can be repeated as many times needed.
• Can quantitatively assess retinal thickness and demonstrate any associated RPE
structural anomalies.
OCT : Features in Diabetic maculopathy (10)
OCT almost gives the in vivo histopathology of retinal layers that help in the better
disease understanding and pathogenesis. Oct is a useful tool in monitoring response
to an intervention (IVTA) in maculopathy. There are five patterns of diabetic
maculopathy. They are.
1. Sponge like thickening of retinal layers : This is mostly confined to outer retinal
layers and reduced back scattering from intra retinal fluid accumulation.
2. Cystoid macular edema : Large cystoid spaces involving variable depth of retina
with intervening septae. The cystoid spaces are initially confined to outer retina
mostly but in long standing cases these cysts fuse to involve almost entire
thickness of retina.
3. Subfoveal serous detachment; This is shown as hypo reflective area in subfoveal
region
4. Taut posterior hyaloid membrane; This may result in recalcitrant macular edema
with foveal detachment that can be diagnosed easily on OCT even when sub
clinical. In advanced cases it can be diagnosed as a taut shiny glistening
membrane with retinal striae on bio microscopic examination. CSME with TPHM
is generally non responsive to laser and is an indication for Pars plana vitrectomy
5. Tractional detachment of fovea; Foveovitreal traction may result in detachment of
fovea, This can be diagnosed easily in OCT. This is an indication for pars plana
vitrectomy to release the traction. Laser photo coagulation may only worsen
_________________________________________________________________________
MATERIALS AND METHODS
Patients with diabetic maculopathy who presented to the Retina Clinic of
Institute of Ophthalmology Joseph Eye Hospital Trichy between July 1st 2006 to June
30th 2007 are included in this study
PATIENTS: Sixty three eyes of forty patients with diabetic retinopathy
INCLUSION CRITERIA:
All patients with clinical diagnosis of diabetic maculopathy whether NPDR or
PDR
EXCLUSIONCRITERIA:
Patients with diabetic retinopathy NPDR or PDR with out maculopathy
Patients with other causes of maculopathy
METHODS:
A standard protocol was used to collect and document all details regarding
the cases included in this study
A detailed information about the history of diabetes, with duration and associated
The history of treatment of diabetes, whether oral hypoglycemic drugs or insulin
was taken
Visual acuity, Distance vision, Near vision, Best corrected visual acuity was taken
initially and after intra vitreal triamcinolone acetonide at 1, 2, 3, 6 months follow up
A complete ocular examination was done for each patient which included slit lamp
examination of anterior segment, 90D slit lamp indirect ophthalmosocpic
examination, indirect ophthalmoscopic examination, and following were noted
clinically
1) Type of diabetic retinopathy; NPDR or PDR
2) Type of maculopathy; Focal, Diffuse, CSME, CME , foveal tract ional RD were
noted
A digital fundus fluorescein angiography was done using Carl Zeiss ff450 plus IR
digital camera. 3ml of 20% sodium fluorescein is injected into anterior cubital vein. A
series of photographs are taken. Normally fluorescein begins to show in the choroid
in10 to12 seconds after injection. The type of leaks and area of leak (hyper
fluorescence) whether focal, or diffuse or specific pettaloid pattern is taken. A note
was made on macular perfusion , late staining and blocked fluorescence due to hard
exudates
Optical coherence tomography was done using Carl Zeiss stratus OCT 3. Fast
macular scan was done at the time of presentation .This protocol is designed for use
with retinal thickness analysis in all cases. It is a quick protocol that takes only 1.92
seconds to acquire 6 scans of 6mm length each and various parameters noted for
presence of maculopathy, The type of maculopathy, CME, Sponge like thickening,
Subfoveal serous detachment, Taut posterior hyaloid membrane and Vitreo macular
TREATMENT
Patients who had CME, Sponge like thickening and subfoveal serous
detachment was given intra vitreal triamcinolone acetonide injection of 0.1ml (4mg)
and immediate post intervention the patients was given tab Diamox 250mg tds for 2
days, Timolol eye drops 0.5% bd for 2 weeks, ciprofloxacin eye drops 0.03% for 2
days
FOLLOW UP
The patients were followed up at 1 week, 1 month, 3months,and 6 months and all
patients who under went IVTA underwent OCT examination and foveal thickness
measurement at 6 months follow up and IOP recorded at each visit.
STATISTICAL ANALYSIS
Statistical analysis was done by student t test, regression analysis, chi
Fig 2
Carl Zeiss Digital Digital Camera with Fundus Fluorescein Angiogram
Fig 3
[image:35.612.188.479.88.322.2] [image:35.612.162.505.407.641.2]__________________________________________________________________________ _
RESULTS
In this prospective comparative case series study 63 eyes of 40 patients with
diabetic maculopathy who presented at retina clinic of Institute of Ophthalmology
Joseph Eye Hospital Trichy between July 1st 2006 to June 30th 2007 was included in
this study
GENDER : In this study there were 28 male (70%) and 12 female (30%)
AGE : In this study the mean age was 57.75 years(range 35 to 70 years) and
Maximum number of patients were in 51 to 60 yrs range 21 patients (52.7%), and 61
to 70 yrs 14 patients (35%) , and 41 to 50 yrs 2 patients (5%) ,and 31 to 40 yrs 3
patients (7.5%)
TYPE OF DIABETES MELLITUS; In this study there were 37 patients with NIDDM
(92.5%),and 3 patients with IDDM (7.5%).
DURATION OF DIABETES MELLITUS: In this study duration of diabetes was 10 to
15 years in 28 patients (70%), and 5 to 10 yrs in 6 patients (15%), and less than 5
years in 6 patients (15%).
ASSOCIATION WITH SYSTEMIC DISEASES: In this study Hypertension was
TYPE OF DIABETIC RETINOPATHY; In this study NPDR was present in 26
patients (65%) ,PDR in 14 patients (35%).
TYPE OF DIABETIC MACULOPATHY CLINICALLY; In this study Clinically
Significant Macular Edema was seen In 58 eyes (92%) , Cystoid Macular edema in 2
eyes3.(2%),Diffuse Edema in 2 eyes(3.2%), Fibrous traction in1eye(1.6%)
TYPE OF DIABETIC MACULOPATHY WITH FFA: In this study With FFA, Diffuse
leak was seen in 49 eyes (78%), Focal leaks in 7 eyes (11%), Pettaloid pattern in 3
eyes (5%), Ischemic pattern in 3 eyes (5%), Blocked fluorescence in 1eye (2%).
TYPE OF DIABETIC MACULOPATHY WITH OCT: In this study with OCT, Cystoid
macular edema was seen in 32eyes (51%), Sponge like thickening in21eyes (33%),
Subfoveal serous detachment in 9 eyes (14%) ,Foveal tract ional retinal detachment
in 1 eye (2%).
CORRELATION BETWEEN FOVEAL THICKNESS AND VISUAL ACUITY IN
DIABETIC MACULOPATHY; In this study there was no correlation between visual
acuity and foveal thickness measured by OCT
In GRADE 1 visual acuity 6/6 to 6/18 There were 6 eyes (10%) in 400 to 500
In GRADE 2 VA 6/24 to 6/60 There were 15 eyes (24%) are in 300 to 400
microns thickness
In GRADE 3 VA < 6/60 There were 8 eyes(13%) in 300 to 400 micron thickness
IMPROVEMENT OF VISUAL ACUITY AFTER IVTA IN DIABETIC
MACULOPATHY; In this study there was a definite increase in visual acuity after
intravitreal triamcinolone acetonide after three months.
CME group showed more definite increase in visual acuity than other two groups.
The Pretreatment mean visual acuity in decimals was 0.2 (standard
deviation=+/-0.16 and Post treatment mean visual acuity in decimals was 0.25(std
dev=+/-0.16). and Visual acuity improved in 27 eyes and did not improve in 5 eyes
paired “t” test(p value=0.009) which is statistically significant.
SPONGE LIKE THICKENING group showed increase in visual acuity than
Subfoveal group but less than CME group
The Pretreatment mean visual acuity in decimals was 0.16(standard
deviation=+/-0.14) and Post treatment mean visual acuity in decimals was 0.18(std
dev=+/-0.16) and Visual acuity improved in 14 eyes and did not improve in 7 eyes
SUBFOVEAL SEROUS DETACHMENT group showed insignificant increase in
visual acuity than above two groups
The Pretreatment mean visual acuity in decimals was 0.20(std dev=+/-0.14) and
Post treatment mean visual acuity in decimals was 0.23(std dev=+/-0.16) and Visual
acuity improved only in 5 eyes and did not improve in 4 eyes paired “t” test(p
value=0.57) statistically very insignificant
IMPROVEMENT (DECREASE) OF FOVEAL THICKNESS AFTER IVTA IN
DIABETIC MACULOPATHY: In this study there was a definite decrease in foveal
thickness after intra vitreal triamcinolone acetonide after three months.
CME group showed more definite decrease in foveal thickness
The Pretreatment mean foveal thickness in microns was 452(std dev=+/-173) and
Post treatment mean foveal thickness in microns was 273(std dev=+/-76) and the
Thickness reduced in 31 eyes and was not reduced in 1 eye paired “t” test(p
value=<0.001) statistically very significant
SPONGE LIKE THICKENING group also showed more definite decrease in foveal
The Pretreatment mean foveal thickness in microns was 464(std dev=+/-102) and
Post treatment mean foveal thickness in microns was 282(std dev=+/-50.55)
and the Thickness reduced in all 21 eyes paired “t” test (p value=<0.001) statistically
very significant
SUBFOVEAL SEROUS DETACHMENT group showed only a slight reduction in
foveal thickness
The Pretreatment mean foveal thickness in microns was 404(std dev=+/-96 and
Post treatment mean foveal thickness in microns was 344(std dev=+/-192) and the
Thickness reduced in 6 eyes and was not reduced in 3 eyes paired “t” test (p
value=0.43) statistically very insignificant
COMPARISION OF VISUAL ACUITY IMPROVEMENT AFTER IVTA BETWEEN
THREE GROUPS OF DIABETIC MACULOPATHY: (Chi square test)
In this study CME group showed more improvement in visual acuity than Sponge
like thickening group (p=0.13) and Sub foveal group (p=0.06).And Sponge like
COMPARISION OF FOVEAL THICKNESS REDUCTION AFTER IVTA BETWEEN
THREE GROUPS OF DIABETIC MACULOPATHY (Chi square test)
In this study CME group and Sponge like thickening both showed more reduction in
foveal thickness (p=0.55)
The CME group showed more significant reduction in foveal thickness than Sub
foveal group (p=0.007) and Sponge like thickening group more significant reduction
RESULTS
GENDER
SEX MALE FEMALE
NUMBER OF EYES 28 12
PERCENTAGE 70% 30%
AGE DISTRIBUTION
AGE 31 TO40 41 TO50 51 TO 60 61 TO 70
NO PATIENTS 3 2 21 14
PERCENTAGE 7.5% 5% 52.5% 35%
TYPE OF DIABETES
TYPE OF DM IDDM NIDDM
NO OF PATIENTS 3 37
DURATION OF DIABETES
DURATION < 5 YEARS 5 TO 10 YEARS 10 TO 15 YEARS
NO OF
PATIENTS 6 6 28
PERCANTAGE 15% 15% 70%
TYPE OF DIABETIC RETINOPATHY
TYPE OF DR PDR NPDR
NUMBER OF EYES 14 26
PERCENTAGE 35% 65%
TYPE OF DIABETIC MACULOPATHY CLINICALLY
TYPE OF
MACULOPATHY CSME CME
DIFFUSE EDEMA
FIBROUS PROLIFERATION
NO OF EYES 58 2 2 1
TYPE OF DIABETIC MACULOPATHY WITH FFA
TYPE DIFFUSE LEAK PETTALOID PATTERN FOCAL LEAKS PERFUSIONNON FLUORESCENCEBLOCKED
NO OF
EYES 49 3 7 3 1
PERCENT 77.8% 4.8% 11.2% 4.8% 1.6%
TYPE OF DIABETIC MACULOPATHY BY OCT
TYPE CYSTOID MACULAR EDEMA SPONGE LIKE THICKENING SUBFOVEAL SEROUS DETACHMENT FOVEAL TRACTIONAL DETACHMENT
NO OF EYES 32 21 9 1
GENDER DISTRIBUTION
0
28
12
SEX
MALE
FEMALE
TYPE OF DIABETES
NO OF PATIENTS
3, 8%
37, 92%
NUMBER OF EYES
14, 35%
26, 65%
PDR NPDR
0 5 10 15 20 25
31 to 40 41 to 50 51 to 60 61 to 70
AGE DISTRIBUTION
0 5 10 15 20 25 30
< 5 years 5 to 10 years 10-15 years DURATION OF DIABETES
0 10 20 30 40 50 60
Csme CME Diffuse Edema Fibrous proliferation
0 5 10 15 20 25 30 35
CME Sponge like thickening
Subfoveal serous detachment
foveal tractional detachment
TYPE OF MACULOPATHY BY OCT
0 10 20 30 40 50 Diffuseleak Pettaloid patternfocal leaks non perfusion
Fig-1 OCT Picture shows Sponge like thickening of macula
[image:50.612.132.536.392.607.2]fig -3 Sub foveal serous detachment
[image:51.612.126.542.392.639.2]OCT Picture shows cystoid macular edema after 6 Months post IVTA
OCT Picture shows Sponge like thickening of macula after 6 Months post IVTA
fig-8 Fundus picture shows NPDR
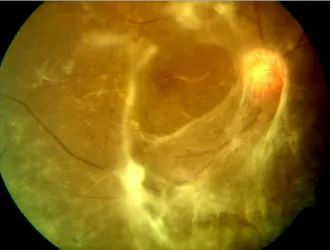
[image:53.612.164.504.410.658.2]fig-10 PDR with Foveal tract ional retinal detachment
fig-13 FFA shows cystoid macular edema(flower petal pattern)
fig-15 FFA shows PDR with diffuse leak.
__________________________________________________________________________
DISCUSSION
Optical coherence tomography is a novel, objective test for the qualitative and
quantitative evaluation of patients with diabetic maculopathy who may not be so
precisely evaluated clinically and by fundus fluorescein angiographically
In this study 63 eyes of 40 patients were examined clinically, by FFA and by
OCT . On comparison between them ,OCT precisely delineated more types
of maculopathy than clinically and by FFA and so OCT is a more sensitive
method of diagnosis in diabetic maculopathy.
This is similar to the study conducted by David J Browing et al (11,12)
(Ophthalmology,2004. AJO 2005) in which they Showed 4 abnormalities (1)
increased total macular volume (2) increased foveal zone thickness (3)
increased inner parafoveal zone thickness and (4) increased outer parafoveal
zone thickness. And so the diagnosis of diabetic macular edema by
stereoscopic slit lamp biomicroscopic examination of fundus with diagnosis by
OCT showed slit lamp diagnosis of DME is less sensitive than OCT.
In this study on comparison between FFA findings and OCT findings, OCT
showed more types of maculopathy and so OCT is a useful tool to diagnose
This is similar to the study conducted by SE WOONG KANG et al (13)(AJO
FEB 2004) in which 145 eyes of 91 patients were categorized by FFA into 3
types ,focal leakage type ,diffuse leakage type, cystoid leakage type and by
OCT into 4 types, Type 1-thickening with homogenous optical reflectivity,
Type 2-thickening with markedly decreased optical reflectivity in outer retinal
layer, Type 3a-foveolar detachment with out traction, Type 3b- foveolar
detachment with traction and showed (a) The prevalence of OCT type 1 was
higher in focal leakage type and diffuse leakage type than in cystoid leakage
type (b) The prevalence of OCT type 2 and 3a was higher in cystoid leakage
type than in focal and diffuse leakage type and they concluded that there was
a correlation between features of FFA and OCT
In this study there is no correlation between foveal thickness by OCT and visual
acuity.
In this study there is a definite increase in visual acuity after IVTA in all three
groups but was statistically more significant in eyes with CME group.
In this study there is a significant reduction in foveal thickness after treatment with
The above three results are similar to the study conducted by JORGEN
LARSSON et al (14) AJO APRIL 2005 in which they showed that 24 eyes with
diabetic macular edema treated by IVTA had reduction in foveal thickness from
mean of 462 +/- 154 microns to 257 +/- 114 microns ( p value < 0.0001)after 3
months and the log MAR average visual acuity increased from 60.5+/-10.5 to 65.5
+/-11.1 (p value =0.0001) 3 months after IVTA treatment.
In this study eyes with CME group showed more improvement in visual acuity after
IVTA than Sponge like thickening group and Sub foveal serous detachment group
showed very little improvement
In this study eyes with both CME group and Sponge like thickening group
showed significant reduction in foveal thickness after IVTA. Sub foveal serous
detachment group showed very little reduction in foveal thickness after IVTA.
__________________________________________________________________________ _
SUMMARY
In this prospective comparative study 63 eyes of 40 patients with Diabetic
maculopathy were included. All underwent examination clinically, by FFA, and by
OCT. Optical coherence tomography precisely showed four types of diabetic
maculopathy (a) Cystoid macular edema 32 eyes (b) Sponge like thickening 21 eyes
(c) Subfoveal serous detachment 9 eyes (d) Foveal tract ional retinal detachment 1
eye, which were not seen clinically and by FFA.
The foveal thickness was measured by OCT in all patients at presentation
and intravitreal triamcinolone acetonide is given to 62 eyes (except one eye with
vitreo macular traction for which the treatment is mainly surgical) and after 6 months
foveal thickness measured by OCT. The foveal thickness in diabetic macular edema
reduced after intravitreal triamcinolone acetonide. More significantly in Cystoid
macular edema group and Sponge like thickening group than in subfoveal serous
detachment group.
There is no correlation between foveal thickness and visual acuity. But there
is a increase in visual acuity after treatment with intravitreal triamcinolone acetonide.
More significantly in Cystoid macular edema group.
OCT with its high resolution imaging of retina has a role in diagnosis of
different types of diabetic maculopathy and to monitor the thickness of fovea before
and after treatment with intra vitreal triamcinolone acetonide.
CONCLUSION
Optical Coherence Tomography a non contact, non invasive investigation is
slowly emerging as an important diagnostic tool in differentiating various types of
diabetic maculopathy. In comparison with clinical assessment and FFA it is definitely
turning out to be a superior and more useful method of evaluating and monitoring
Diabetic Maculopathy either as a single procedure and may be more useful when
used in conjunction with fundus fluorescein angiography.
OCT is a useful tool to quantitatively monitor the response of different diabetic
macular pathologies to intra vitreal triamcinolone acetonide by measuring the pre
treatment foveal thickness and post treatment foveal thickness and there is a
significant reduction in foveal thickness after intra vitreal triamcinolone acetonide.
There is no correlation between thickness of fovea measured by OCT and
visual acuity.
Option for surgical intervention in cases of Diabetic Maculopathy with macular
traction and taut posterior hyaloid membrane depends mainly on the OCT images
REFERENCES
1) KANSKI JJ 5th edition clinical ophthalmology a systemic approach
BUTTER WORTH HEINMANN, LONDON.
2) RETINA VOL -2, STEPHEN,J .RYAN,MD ,fluorescein angiography basic principles and interpretation.
3 ) KLLIEN BA et al macular lesions of vascular origin ,Functional vascular conditions leading to damage of macula lutea ,AJO 1953; p1to3.
4) GRAY JDM ,Atlas of macular diseases St Louis CY Mosby 1987 p 46 to 59.
47
5) Early treatment diabetic retinopathy study research group
photocoagulation for diabetic macular edema, ETDRS study report and number ,ARCHIVES OF OPHTHALMOLOGY
1985,p103;1976,p 806.
6)The early treatment diabetic retinopathy report no 7; OPHTHALMOLOGY 1991,1998,p 741 to 756.
7) The diabetic retinopathy study research group preliminary report on effects of photocoagulation, AJO ,1976 ; Vol 81;p 383 to396.
8) RUBENSTEIN K, et al treatment of diabetic maculopathy, BJO, 1972;vol 56;p 1 to 5.
10) Mc NEEL JW et al diabetic maculopathy in symposium, current status of macular diseases ;TRANS AAO 1977 ;Vol 83 p 476- 488
11) OTANI T,KASHI S, et al; Patterns of diabetic macular edema with OCT, AJO,1999, Vol 27; p 688 to 693
12) DAVID .J.BROWING et al, regional patterns of sight threatening diabetic macular edema, AJO JULY 2005 , p117 to 124.
13) DAVID .J. BROWING et al , comparison of clinical diagnosis of
diabetic macular edema with diagnosis by OCT ,AAO 2004; p 712 to715.
14) SER WOONG KANG et al ,the correlation between fluorescein angiographic and OCT features in CSME,AJO ,FEB 2004 ;p 313
15)JORGEN LARSEN et al, reduction of foveal thickness in diabetic macular edema after IVTA AJO 2005.
16) BAUMAD CR et al; clinical applications of optical coherence
tomography CURR OPIN OPHTHALMOL 1999 ; Vol 10 (3);p182 to188.
17) CARMEN A PULIAFITO; MD, MICHAEL R HEE et al, imaging of
macular diseases with OCT, OPHTHALMOLOGY1995;vol102;217 to219
18) COKER J G et al macular diseases and OCT, CURR OPIN OPHTHALMOL 1996; Vol 7(3) ,p 33 to38
20) DAVID GAULTER et al OCT assessment of vitreo retinal relationship in diabetic macular edema, AJO may 2005; p 807 to 815.
21) TOWNSEND C ,BAILEY J, et al ,xenon arc photocoagulation in treatment of diabetic maculopathy, TRANS OPHTHALMOL SOC UK 1976; vol 99;p 13 to 16.
22) DOBREE JH et al simple diabetic retinopathy evolution of lesions and therapeutic considerations; BJO 1970, p 541
23) Interpretation of fundus fluorescein angiography, HOWARD SCHATZ, BURTON..
24) Diabetic retinopathy study research group, photocoagulation of proliferative diabetic retinopathy, clinical application of DRS findings; DRS report 8 , OPHTHALMOLOGY 1981; vol88; p 583 to 600.
25)FLORIAN .KP.SUTTER, JUDY M et al ; Intravitreal triamcinolone acetonide for diabetic macular edema that results after laser treatment, OPHTHALMOLOGY 2004;p 2044 to 2049.
26) JONAS JB at al ; Intravitreal TCA for diffuse macular edema, ARCHIEVES OF OPHTHALMOLOGY ,2003,vol 121,p 57 to 61..
27) MARTIDIS A, DUKER JS et al ; Intravitreal triamcinolone acetonide for diabetic macular edema, OPHTHALMOLOGY,2002, vol199, p 920 to 927
28) MARSIN P, AUDREN F et al; Intravitreal triamcinolone acetonide for
diffuse macular edema preliminary results of a prospective study BJO 2002 p34 to36
29) The early treatment diabetic retinopathy study research group photocoagulation for diabetic macular edema. Early treatment diabetic retinopathy study report, ARCHIEVES OF
OPHTHALMOLOGY, 1985, vol103 ;p1796 to1806
__________________________________________________________________________
PROFORMA
Institute of Ophthalmology, Joseph Eye Hospital, Trichy.
OCT IN DIABETIC MACULOPATHY
Study No MRD No Retina No
Name AGE Sex
Systemic diseases IHD/HT/Nephropathy/Other s
Diabetic Type 1 IDDM Type 2 NIDDM Duration
Treatment undergone Diet and Exercise/Drugs Insulin
VISUAL ACUITY
Distant vision unaided
With correction BC DVA
Right eye Left eye
Near vision unaided
With correction BC NVA
RE LE
SLIT LAMP EXAMINATION
Anterior segment Right eye Left eye
FUNDUS EXAMINATION
(Indirect/90D) RE LE
Diagnosis ; NPDR ;Mild/Moderate/Severe ;PDR ;MACULOPATHY ;Focal/Diffuse
FFA RE LE
OCT
SET UP
Size Site Length Width Height
MACULOPATHY(OCT)
1)SPONGE LIKE THICKENING
2)CYSTOID MACULAR EDEMA
3)SUBFOVEAL SEROUS DETACHMENT
4)TAUT POSTERIOR HYALOIDAL MEMBRANE
5)FOVEAL TRACTIONAL RETINAL DETACHMENT(Vitreo Retinal Traction)
__________________________________________________________________________