Copyright © 1999, American Society for Microbiology. All Rights Reserved.
Consistent Viral Evolutionary Changes Associated with the Progression
of Human Immunodeficiency Virus Type 1 Infection
RAJ SHANKARAPPA,
1JOSEPH B. MARGOLICK,
2STEPHEN J. GANGE,
3ALLEN G. RODRIGO,
1DAVID UPCHURCH,
1HOMAYOON FARZADEGAN,
3PHALGUNI GUPTA,
4CHARLES R. RINALDO,
4GERALD H. LEARN,
1XI HE,
1XIAO-LI HUANG,
4ANDJAMES I. MULLINS
1*
Department of Microbiology, University of Washington School of Medicine, Seattle, Washington 98195-7740
1;
Departments of Molecular Microbiology and Immunology
2and of Epidemiology
3, Johns Hopkins School of
Hygiene and Public Health, Baltimore, Maryland 21205; and Department of Infectious Diseases
and Microbiology, University of Pittsburgh School of Medicine and Graduate School of
Public Health, Pittsburgh, Pennsylvania 15213
4Received 2 December 1998/Accepted 4 September 1999
To understand the high variability of the asymptomatic interval between primary human immunodeficiency
virus type 1 (HIV-1) infection and the development of AIDS, we studied the evolution of the C2-V5 region of
the HIV-1
env
gene and of T-cell subsets in nine men with a moderate or slow rate of disease progression. They
were monitored from the time of seroconversion for a period of 6 to 12 years until the development of advanced
disease in seven men. Based on the analysis of viral divergence from the founder strain, viral population
diversity within sequential time points, and the outgrowth of viruses capable of utilizing the CXCR4 receptor
(X4 viruses), the existence of three distinct phases within the asymptomatic interval is suggested: an early
phase of variable duration during which linear increases (
⬃
1% per year) in both divergence and diversity were
observed; an intermediate phase lasting an average of 1.8 years, characterized by a continued increase in
divergence but with stabilization or decline in diversity; and a late phase characterized by a slowdown or
stabilization of divergence and continued stability or decline in diversity. X4 variants emerged around the time
of the early- to intermediate-phase transition and then achieved peak representation and began a decline
around the transition between the intermediate and late phases. The late-phase transition was also associated
with failure of T-cell homeostasis (defined by a downward inflection in CD3
ⴙT cells) and decline of CD4
ⴙT
cells to
<
200 cells/
l. The strength of these temporal associations between viral divergence and diversity, viral
coreceptor specificity, and T-cell homeostasis and subset composition supports the concept that the phases
described represent a consistent pattern of viral evolution during the course of HIV-1 infection in moderate
progressors. Recognition of this pattern may help explain previous conflicting data on the relationship between
viral evolution and disease progression and may provide a useful framework for evaluating immune damage
and recovery in untreated and treated HIV-1 infections.
Human immunodeficiency virus type 1 (HIV-1) infection is
characterized by an asymptomatic period of highly variable
length between acute infection and AIDS (32, 38, 42, 53–55,
72). Among the viral factors that may affect the rate of HIV
disease progression, HIV strains with a syncytium-inducing
(SI) phenotype on MT-2 cells (now referred to as X4 or R5/X4
for viruses with dualtropism that includes CXCR4 [3]) have
long been associated with faster disease progression, although
the mechanism of this effect is unclear (7, 13, 22, 36, 64, 70, 78).
Also unclear is the role of viral evolutionary change in affecting
the duration of the asymptomatic period. While several studies
have found an inverse relationship between the rate of viral
diversification and disease progression (15, 16, 23, 45, 46, 73,
82, 83), others have not (26, 49, 52); one study found instances
of both inverse and direct relationships (51).
To understand more clearly the relationship of viral
evolu-tionary changes, the emergence of X4 viral phenotypes, and
the rate of progression over the course of HIV-1 disease, we
studied the evolution of the C2-V5 region of the HIV-1
env
gene in nine homosexual men enrolled in the Multicenter
AIDS Cohort Study (MACS) (34). These nine men constituted
a subset of individuals previously selected for a study of
changes in plasma viremia, T-cell subsets, and cytotoxic
mem-ory T-cell responses in MACS participants who had a
down-ward inflection in CD3
⫹T-cell numbers (65). A high
preva-lence (75%) of such inflections has been found in MACS
participants who have developed AIDS, occurring a median of
1.7 years prior to the onset of AIDS (24). The C2-V5 region of
env
was chosen for the analysis of viral changes because it
encodes an important target for immune responses,
deter-mines coreceptor specificity, and exhibits a high degree of
phylogenetically informative variability (41, 42). An average of
12 time points per person were studied, covering 6 to 12 years
of infection.
As the present study is one of the most comprehensive
longitudinal studies of HIV-1 evolution in vivo to date, it
provides unique insights into the patterns of viral change over
time, as well as the emergence and representation of X4
vi-ruses and changes in T-cell subsets associated with disease
progression. The observed patterns and associations may
ex-plain inconsistencies among previous reports relating HIV-1
sequence evolution to disease progression and enhance our
understanding of the factors that lead to progression.
MATERIALS AND METHODS
Study participants and clinical specimens.The MACS is an ongoing prospec-tive cohort study, with over 5,000 homosexual men participating, whose study
* Corresponding author. Mailing address: Department of
Microbi-ology, University of Washington School of Medicine, Room K451,
Seattle, WA 98195-7740. Phone: (206) 616-1851. Fax: (206) 616-1575.
E-mail: [email protected].
10489
on November 9, 2019 by guest
http://jvi.asm.org/
design has been described in detail (34). At semiannual visits, participants pro-vide responses to structured, interviewer-administered questionnaires (including detailed information about therapies taken since the last visit) and provide blood specimens that are stored at⫺70°C (serum and plasma) or⫺135°C (peripheral blood mononuclear cells [PBMCs]) at a central repository. T-cell subsets were determined by flow cytometry by previously described methods (25, 68), with antibodies obtained from Becton Dickinson Immunocytometry Systems (San Jose, Calif.) and an ELITE flow cytometer (Coulter Electronics, Hialeah, Fla.). The selection of participants for the present study has been described else-where (65). Briefly, 306 seroconverters, enrolled between 1983 and 1984 with less than 8 months between their last seronegative and first seropositive visits, were ranked for their decline in longitudinal CD3⫹cell counts with data gathered
through 1994. Individuals were required to develop and maintain low CD3⫹cell
levels for at least two visits and to have frozen plasma and PBMCs available at most or all semiannual visits. Six of the nine men (all except participants 8, 9, and 11) selected for this study were among those with the most well-defined inflec-tions in CD3⫹lymphocyte counts. One man (participant 8) had a less
well-defined inflection of CD3⫹lymphocytes but progressed to a CD4⫹lymphocyte
count of⬍200 cells/l. Two men (participants 9 and 11) were initially selected to be part of a comparison group with stable lymphocyte counts but exhibited signs of progression with subsequent follow-up. Clinical and/or immunologic AIDS (11) was observed in seven men, and five men had died by the end of 1998. Seven men received antiretroviral treatment (primarily zidovudine) (see Fig. 2d) during the course of study, and participant 8 reported the use of potent antiretroviral therapy at the last study time point. Subject 11, the slowest progressor studied, did not take any antiretroviral therapy or prophylactic antibiotics during the time period analyzed in this study.
PCR amplification, cloning, and sequencing.Ficoll-Hypaque-purified PBMCs were lysed by the addition of quick lysis buffer (10 mM Tris [pH 8.3], 50 mM KCl, 2.5 mM MgCl2, 0.45% Nonidet P-40, 0.45% Tween 20) and digested with 100g of proteinase K per ml at 56°C for 1 h. Lysates from PBMCs were treated with GeneReleaser (BioVentures, Murfreesboro, Tenn.) according to the manufac-turer’s protocol and used for PCR. Nested PCR with hot start (19) was used on serial dilutions of the lysate, with amplification of the entire gp160 in the first round followed by amplification of the C2-V5 region in the second round. Template quantitation was done by measuring the frequency of positive and negative reactions at different dilutions (66). Primer sequences for ED3, ED12, ED31, DR7, and DR8 have been described previously (14, 17, 45); primer Nef3 is 9028-5⬘-TAAGTCATTGGTCTTAAAGGTACC, where the number corre-sponds to the position in the NL4-3 genome (GenBank accession no. M19921) of the 5⬘ nucleotide. First-round primers, ED3 and Nef3, were used with the following cycling conditions: 94°C for 2 min; 3 cycles of 94°C for 30 s, 55°C for 30 s, and 72°C for 3 min; 36 cycles of 94°C for 30 s, 58°C for 30 s, and 72°C for 3 min; and a final incubation at 72°C for 10 min. The second-round PCR included a 1:20 dilution of the first-round products in fresh reaction buffer plus primers DR7 and DR8 with the following cycling conditions: 94°C for 2 min; 36 cycles at 94°C for 30 s, 55°C for 30 s, and 72°C for 1 min; and a final incubation at 72°C for 10 min. Plasma samples were processed for RNA extraction and cDNA synthesis as previously described (45). cDNA was amplified first with primers ED12 and ED31, followed by a second round as for the PBMC samples.
All PCR amplifications were done with procedural safeguards, including the aliquoting of all reagents and the physical separation of sample processing and post-PCR handling steps. Replicate control amplifications with no template were included in every PCR experiment to test for carryover contamination. Ampli-fications with 10 genome equivalents of 8E5 cell (21) DNA were also performed as an internal control to monitor the efficiency of the PCR. To avoid template resampling (44), we pooled first-round PCR products from an average of 50 viral templates and reamplified the pool in a second round for derivation and se-quence analysis of an average of 13 clones per time point. Sese-quences were also derived from participant 7 by selecting a single clone per PCR for sequencing. The PCR products were cloned into a TA vector (Invitrogen, Carlsbad, Calif.) and sequenced on an ABI 370 or 377 sequencer (Foster City, Calif.) by dye-primer and dye-terminator protocols.
Sequence analysis.Sequences bearing open reading frames (⬃90% of all sequences determined) were first aligned with the Pileup program in the GCG suite (Genetics Computer Group, Madison, Wis.) and then manually edited. Pairwise evolutionary nucleotide distances (excluding gaps in the pairwise align-ment) were estimated with the Kimura two-parameter model of evolution (35) with a transition/transversion ratio of 2 as implemented in MEGA (40) or PHYLIP, version 3.5 (20). DNA distances were also estimated with a general time-reversible model with site-to-site variation in substitution rates (discrete approximation of a␥distribution with a shape parameter,␣ ⫽0.5 with four bins [77]). Identical trends were seen with either method, although as expected, the Kimura two-parameter method tended to underestimate DNA distances at higher divergence levels. This comparison is available online (71a).
Analysis of viral divergence and diversity.Both viral divergence from the founder strain and viral diversity were estimated at each time point. To estimate viral diversity at a given time point, we determined the mean and standard deviation for pairwise nucleic acid distances between all sequences obtained at that time point. To estimate viral divergence at a given time point, a founder sequence was approximated as the sequences found at the initial virus-positive time point. Nearly identical values for viral divergence were observed when these
distances were estimated with a single consensus sequence from the first time point. The mean and standard deviation for all pairwise comparisons between sequences from the first positive time point and subsequent time points were then calculated. The rate of substitution was measured by estimating the ex-pected number of substitutions that accumulated along the branch from an ancestral sequence (77) as described below.
At timet⫽t0, we estimated the rate of substitution by estimating the expected
number of substitutions that accumulate along the branch from an ancestral sequence to a sequence sampled at timet⫽t1and dividing by the elapsed time,
i.e.,
⫽E关d共sa0,s1兲兴
⌬共t兲 (1)
whereis the rate of substitution per site per unit time,⌬(t)⫽t1⫺t0, and E[d(sa0,s1)] is the expected number of substitutions per site between a sequence
att1,s1and the ancestral sequence att0,sa0. However, with a small sample of
sequences taken from a much larger population, it is unlikely that we have sampled the ancestral sequencesa0. Therefore, to reexpress equation 1 so that
the expectation containingsa0is removed, we can use the fact that, under an
additive model of sequence evolution,d(sa0,s1)⫽d(s0,s1)⫺d(sa0,s0), wheres0
is a sequence sampled att0. Therefore, we can rewrite the numerator of equation
1 asE[d(s0,s1)]⫺E[d(sa0,s0)]. Under a neutral model of evolution,sa0is one
randomly selected sequence, andE[d(sa0,s1)]⫽E[d(s0x,s0y)] where the right-hand
term is the expected distance between any pair of sequences sampled randomly from the population att0. If selection is operating, thenE[d(sa0,s0)]⫽E[d(s0x, s0y)]⫹ε. Using this, we can show that
E关d共s0,s1兲兴 ⫺E关d共s0x,s0y兲兴 ⫽ ⌬共t兲 ⫹ε (2)
Since the viral population at the first time point is effectively homogeneous, let
E[d(s0x,s0y)] ⬇0.E[d(s0,s1)] can then be estimated by the average pairwise
distances between all sequences fromt1andt0, and equation 2 allows us to solve
forby linear regression.
Mantel’s generalized regression permutation procedure (47, 62, 74, 80) was used to test the hypothesis that the average pairwise differences between all possible pairs of sequences within a time point were significantly smaller than average pairwise differences between all possible pairs of sequences between time points. Two matrices were constructed. The first was a matrix,E, of pair-wise evolutionary distances constructed using the Kimura two-parameter model (35). The second matrix,M, with elementsM(i,j)⫽Px(i)⫺y(j)Pifx⫽yand M(i,j)⫽0 otherwise, corresponds to the elements ofErepresenting the pairwise distance between sequenceiandj, wherex(i) andy(j) are the ordinal values associated with each time point from which sequencesiandjwere obtained. This form of theMmatrix imposes a temporal structure on the genetic diversity ofenv
sequences, such that sequences separated by a longer sampling interval have greater evolutionary distances. The statistic of interest isr2, the square of the
Pearson correlation coefficient, calculated between all pairs of elements ofEand Mexcluding the diagonal. The null distribution ofr2was obtained by randomly
permuting the row and column labels ofM1,000 times and calculating the value ofr2betweenEand the permutedM. For all individuals, the estimated value of r2was never exceeded by any value generated by the permutation procedure
(P⬍0.001; data not shown). These results imply that sequences from each time point are most similar to those from the same time point. Furthermore, the imposition of a temporally ordered null matrix suggests that sequences from each time point are most similar to those from closer versus more distant time points. In evaluating the evolutionary patterns over time, it was apparent that after a period of linear increase there was a time point at which the mean genetic diversity plateaued or decreased, and another time point at which the mean genetic divergence appeared to slow down or to stabilize in some individuals. It was of interest to evaluate the association of these evolutionary time points with time points of disease markers (i.e., estimated time of CD3⫹T-cell inflection and
the time at which CD4⫹T-cell counts decreased to 200/l) and the times of
emergence and peak representation of X4 viruses. To accomplish this, times of peak diversity and divergence stabilization were estimated relative to the time of seroconversion (seroconversion being defined by the midpoint between the last seronegative and the first seropositive visits) by manual review of the data. Peak diversity and divergence stabilization were taken as the point at which the mean distance between sequences from a given time point (diversity) or from the founder sequence (divergence) either was at its maximum or slowed its rate of increase. The changes in diversity trajectory were substantiated by statistically significant (P⬍0.01) quadratic trends over time. The same point of divergence stabilization or slowdown was evident when comparing sample divergences from time points other than the founder population (data not shown). However, the stabilization of divergence could not be statistically substantiated by quadratic regression analysis, and in two cases (participants 7 and 8) was suggested by only a single data point. The times of CD3⫹inflection points were initially chosen by
manual review, and were within 1 year of those predicted by a subsequently developed automated algorithm (24). The association of the timing of different events was evaluated by linear regression. The time between events was evalu-ated by analyzing the paired (within-individual) differences of event times witht
tests and Wilcoxon’s signed-rank tests.
10490
SHANKARAPPA ET AL.
J. V
IROL.
on November 9, 2019 by guest
http://jvi.asm.org/
Coreceptor usage and SI phenotype prediction and determination.The oc-currence of viruses utilizing the CCR5 and CXCR4 coreceptors was determined by one or more of three different assays. (i) Virus isolates derived from fresh or frozen viable PBMCs were tested for syncytium induction on MT-2 cells (31). (ii) The phenotypic use of coreceptors was determined by the growth of viral isolates cultured with cells expressing CD4 and coreceptors (cells graciously provided by D. Littman, Skirball Institute of Biomolecular Medicine, New York, N.Y.) (65). (iii) The X4 phenotype was predicted from viral sequence data, based on de-duced basic amino acid substitutions at positions 306, 319, and 320 of the mature gp120 protein (3, 4, 7, 13, 22, 36, 64, 70, 78). None of these methods distinguished between X4 viruses and dualtropic R5/X4 viruses. For simplicity, viruses pre-dicted (via sequence analysis) or observed (via phenotypic culture) to use the CXCR4 coreceptor are referred to as X4.
Nucleotide sequence accession numbers.All sequences described were depos-ited in the GenBank database under accession no. AF137629 to AF138163, AF138166 to AF138263, and AF138305 to AF138703.
RESULTS
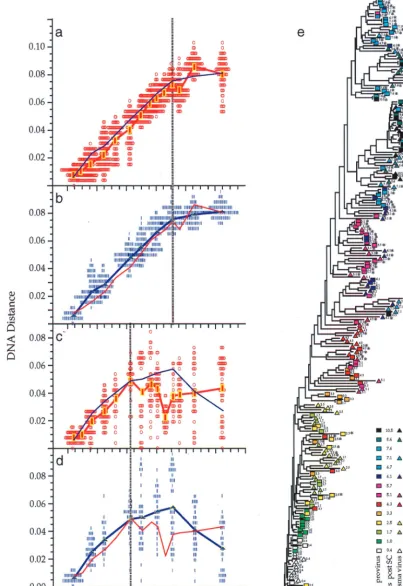
Consistent trends in viral evolution.
A total of 1,300
se-quences bearing an open reading frame were obtained from
the nine men at a total of 106 time points, for an average of
12.3 sequences from each time point. Paired PBMC and
plasma samples were examined at 25 time points. Figure 1
shows sequence comparisons for two participants, illustrating
three features of
env
gene evolution that were observed among
all participants (for complete data sets, see reference 71a).
First, the changes in viral divergence (from an approximated
founder strain; see Materials and Methods) were essentially
the same in both cell-associated viral DNA (Fig. 1a) and
plasma RNA (Fig. 1b). The patterns of increase in viral
diver-sity (the breadth of population at a given time point) were also
similar in the viral DNA and RNA populations (Fig. 1c and d),
although at later times they appeared to diverge in participant
2, perhaps due to the unavailability of RNA sequences from
the two populations at all time points. Thus, divergence and
diversity measurements were not affected by the different
half-lives of cells versus virions, in agreement with another recent
report (2). For simplicity, therefore, we combined DNA and
RNA data for the analyses shown in subsequent figures.
Sec-ond, divergence increased linearly for several years after
sero-conversion but then appeared to slow or stabilize late in
infec-tion, again at approximately the same times in DNA and RNA
(Fig. 1a, b, and f). Third, the breadth of viral population
di-versity at a given time point increased in parallel with
diver-gence for a few years after seroconversion before reaching a
peak and then leveling off or decreasing prior to the point of
divergence stabilization. Figures 1a to d, f, and g also illustrate
the variability in pairwise comparisons of divergence and
di-versity around mean values. The data were distributed
approx-imately symmetrically around the means with some evidence of
a multimodal distribution in diversity measures at later time
points. The evolutionary relationships between all of these
sequences showed a significantly time-ordered, progressive
evolutionary trend away from the founder strain (P
⬍
0.001)
(Fig. 1e and h).
Figure 2a shows corresponding data from all participants,
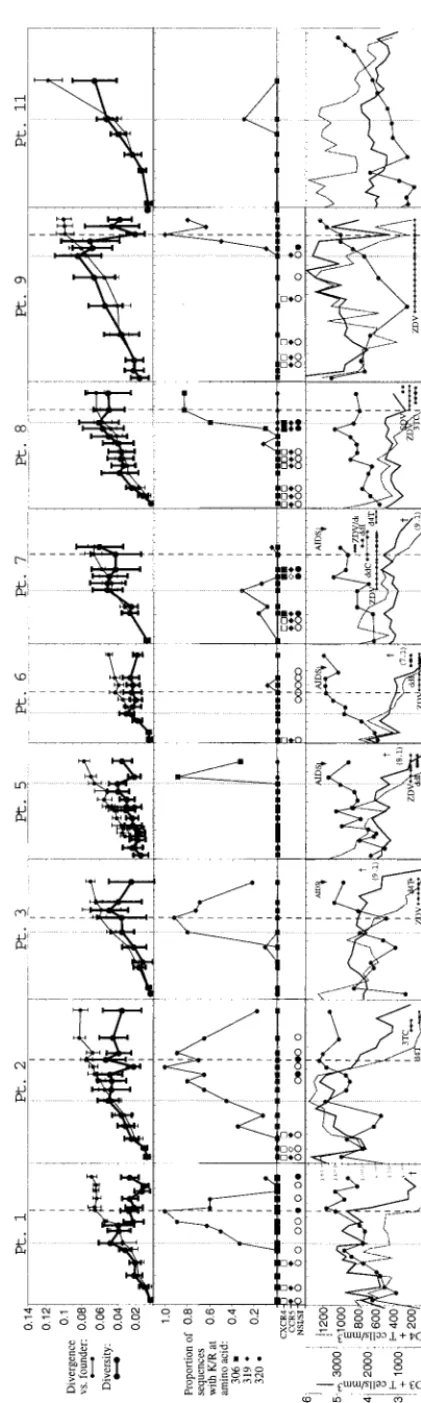
summarized with points and vertical bars reflecting the mean
and standard deviation at each point. Two highly consistent
patterns were evident in comparing trends across individuals
(Fig. 3). First, viral population diversity increased and then
stabilized or declined in all participants (Fig. 2a and 3a and b).
Before reaching their peak, the increases in virus population
diversity for each individual were highly linear (mean slope
⫽
0.92%
⫾
0.27% per year) and consistent (mean
r
2⫽
0.62).
After the peak in diversity, the patterns declined on average,
with a slope of
⫺
0.35%
⫾
0.69% per year, and exhibited more
variability (mean
r
2⫽
0.09; range,
⫺
0.01 to 0.26).
Second, the pattern of population divergence from the
founder strain was remarkably linear and consistent across
subjects (Fig. 2a). The increase (mean
⫾
standard deviation) in
divergence was 0.91%
⫾
0.14% per year when all data were
used (Fig. 3a). However, in most subjects divergence appeared
to slow or stabilize late in infection (in participants 7 and 8,
stabilization was suggested by only a single data point, and it
was not detected in participants 5 and 11, the latter a possible
late progressor). The mean increase in divergence was 1.02%
⫾
0.14% per year before stabilization—almost the same as the
increase in diversity—and 0.15%
⫾
0.25% after stabilization
(Fig. 3d). The linear correlation was also much greater for data
before stabilization (mean
r
2⫽
0.82; range, 0.75 to 0.92) than
afterwards (mean
r
2⫽
0.08; range, 0.00 to 0.30).
Although the phenomenon of divergence stabilization was
not as well defined as peak diversity, there was a close temporal
relationship between the times of peak diversity and
diver-gence stabilization (for those participants in whom the latter
could be estimated) (Fig. 3e). Linear regression of these two
times yielded a high
r
2(0.87) and a slope (0.90
⫾
0.16) that was
statistically indistinguishable from unity (P
⫽
0.54), supporting
the interpretation that these events were strongly linked. The
mean time between peak diversity and divergence stabilization
was 1.76 years (95% confidence interval [CI], 1.06 to 2.46).
Association of viral evolutionary change and X4 viruses.
Mutations predictive of the X4 viral phenotype (basic amino
acid substitutions at positions 306, 319, and 320 of the mature
gp120 protein) were detected at one or more time points in all
nine individuals (Fig. 2b). Individual participant data, plotted
in Fig. 2b, demonstrated a pattern in which X4 viruses were
initially absent, rose to constitute
⬎
80% of the viral population
in six cases, and then declined. To determine if these patterns
of X4 virus prevalence were related to times of seroconversion,
peak diversity, and divergence stabilization, data from all
in-dividuals were plotted relative to those events. Relative to
seroconversion (Fig. 4a), the times of X4 emergence were
spread out over the course of infection. However, X4
emer-gence appeared to be closely associated with, and usually just
prior to, the time of peak diversity (Fig. 4b) (mean
⫽ ⫺
0.32
years; 95% CI,
⫺
1.26 to 0.63). Moreover, the peak prevalence
of X4 viruses appeared to be closely associated with and just
prior to the time of divergence stabilization (Fig. 4c) (mean
⫽
⫺
0.35 years; 95% CI,
⫺
1.26 to 0.56). The strength of these
associations is quantified by the correlations between the time
of emergence of X4 viruses and the time to peak diversity (Fig.
4g) (r
2⫽
0.67) and the time of peak X4 with the time to
divergence stabilization (Fig. 4h) (r
2⫽
0.79).
In general, the predictions based on mutation analysis
agreed with the determined phenotype (Fig. 2c and Table 1).
Of a total of 38 virus isolates whose phenotype was determined
on MT-2 cells, 27 were concordant. Seven others were
non-syncytium-inducing (NSI) following virus isolation despite the
abundant detection of a basic substitution at position 320 in the
starting PBMC population (participants 1 and 2), and one
isolate was NSI when the position 319 mutation was detected
in a single clone (participant 6). Of 38 CCR5 and CXCR4
coreceptor tropism determinations, 31 were concordant with
expectations (Table 1), including 4 of the 5 CXCR4
⫹isolates
that were dually positive for CCR5 and CXCR4 (2 in
partici-pant 7 [V9 and V15] and 2 in participartici-pant 8 [V19 and V20]).
One isolate from participant 2 was unexplainably dually
neg-ative on CCR5 and CXCR4 (as well as CCR3 and CCR2b)
(data not shown) when the genotype of the PBMC viral DNA
suggested an absence of CXCR4 usage. Participant 7 had two
virus isolates that were both SI and CXCR4 positive (one was
also CCR5 negative) following a period of detection of a low
level of viruses with the position 320 substitution.
on November 9, 2019 by guest
http://jvi.asm.org/
FIG. 1. Viral population analyses for participants 2 and 9. Analyses of sequences from participant 2 (a to e) and participant 9 (f to h) are shown. Genetic distances between all possible pairs of nucleotide sequences for viral DNA in PBMC (a, c, f, and g) and viral RNA in plasma populations (b and d) are shown (means at each time point indicated by symbols connected by thick lines) as a function of time since seroconversion. Parallel estimates with sequences sampled from plasma are shown with a thin blue line (a and c) and those from PBMC as a thin red line (b and d). Divergence from the founder strain (i.e., the first virus-positive time point; see Materials and Methods) is shown (a, b, and f). Viral population diversity (i.e., distances between all pairs of sequences within each time point; see Materials and Methods) is shown (c, d, and g). Dotted vertical lines correspond to a peak or a slowdown in the rate of change of each measure. Neighbor-joining phylograms (e and h) are shown for participants 2 and 9, respectively, derived from maximum-likelihood distances between all the sequences in each patient with PHYLIP (20). Sequences are represented by a square for PBMC sequences or a triangle for plasma sequences, with an arbitrary color gradient corresponding to the time of sampling following seroconversion, as indicated in the key. An asterisk (ⴱ) indicates sequences with a basic amino acid substitution in the V3 loop specifying the X4 genotype.
on November 9, 2019 by guest
http://jvi.asm.org/
FIG. 1—Continued.
on November 9, 2019 by guest
http://jvi.asm.org/
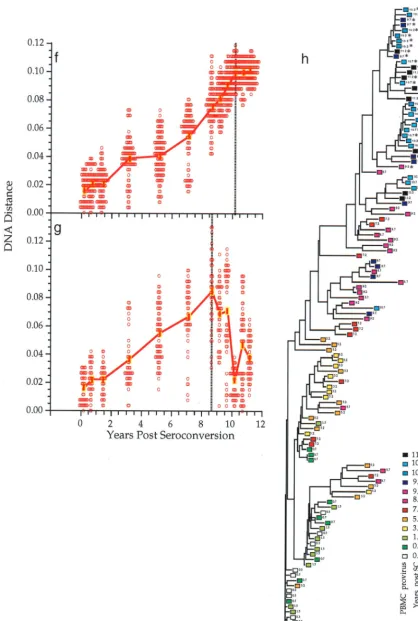
FIG. 2. Summary of sequences, viral phenotypes, and T-cell measures. Participant identifiers above each panel are from a previous study (65); partici pants 4 and 10 were excluded from the current study due to a lack of available specimens. The horizontal axis of each panel indicates the time relative to seroconversion. (a) Genetic distances of the combined populat ion of viral DNA and RNA sequences relative to the founder strain (divergence, thin lines) and within individual time points (diversity, thick lines). The left (dotted) vertical line for each participant (and the single dotted line for participants 5 and 11) indicates the time of peak viral diversity, at which a significant stabilization or decrease in the slope of population diversity growth was observed as defined in the text. The final time point from particip ant 7 had an increase in overall viral diversity due to the appearance of unique divergent virus populations in the plasma versus the those in the PBMCs, although these populations taken individually had much lower levels of diver sity (see appendix at reference 71a). The right (dashed) vertical line for each participant (except participants 5 and 11) indicates the time at which the divergence from the founder strain began to slow down or stabilize (div ergence stabilization). (b) Viral genotype analysis. Each panel shows the proportions of deduced amino acid sequences containing mutations predictive of the X4 phenotype, based on encoding a basic amino acid (lysine or argi nine, indicated by K/R in the figure) at residues 306, 319, or 320 within the envelope glycoprotein. For participant 7, mutations at both position 319 and position 320 (open symbol) were found at one time point. (c) Viral phe notype and coreceptor usage analysis. Data taken from Rinaldo et al. (65). The squares indicate CXCR4 coreceptor usage, and the diamonds indicate CCR5 coreceptor usage by virus isolates derived from the indicated time point s. Open symbols indicate no growth, and filled symbols indicate growth on cells expressing the specified coreceptor plus CD4 (see Materials and Methods). The filled circles indicate syncytium formation (SI phenotype), an d the open circles indicate a lack of syncytium formation (NSI phenotype) when the virus isolates were added to MT-2 cells. (d) Clinical progression. Data was taken from Rinaldo et al. (65). CD4 ⫹T-cell levels are shown with a dotted line. Patient 2 had exceptionally high CD4 ⫹ T-cell levels early in infection which are plotted with a dif ferent scale as indicated in the panel. CD3 ⫹T-cell numbers are shown with the thick line, whereas plasma RNA levels are shown with the filled circles connected by a thin line. Antiretroviral treatment, AIDS diagnosis by development of opportunistic infections (AIDS), and survival time are also indicated. Participants’ visits, at which time the antiretroviral drugs were prescribed, are indicated (ZDV, zidovudine; d4T, stavudine; 3TC, lamivudine; ddI, didanosine; SQV, saquinavir). Five participants died after the period of analysis shown, and this time (in yea rs) is indicated in parentheses below the dagger (†).
on November 9, 2019 by guest
http://jvi.asm.org/
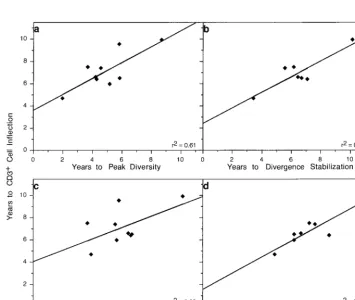
[image:6.612.134.345.46.749.2]FIG. 3. Trends of viral diversification across individuals. Data from the nine participants shown in Fig. 2 are replotted to show the similarities of vi ral population intra-time-point diversity (a and b) and divergence from founder strains (c and d) across individuals. Participant 1 is shown with a black line, 2 with red, 3 with orange, 5 with gray, 6 with gree n, 7 with cyan, 8 with blue, 9 with magenta, and 11 with purple. (a and b) Viral population intra-time-point diversity plotted relative to the time of seroconversion (a) or the time of peak or stabilization of diversity (vertical dotted lines) (b). (c) For each participant, all of the sequences from the first virus-positive visit (the founder strain) were compared to all sequences sampled at each subsequent time point. Sim ilar slopes were also generated when mean values at each time point were used to calculate a combined slope (data not shown). (d) Viral population divergence from the founder strain as shown in panel c but plotted relative to the estimated time of divergence stabilization (vertical dotted line). Participants 5 and 11, who had no evident stabilization, are omitted. (e) Relationship between the times from seroconversion to peak viral diversity and to divergence stabilization.
on November 9, 2019 by guest
http://jvi.asm.org/
[image:7.612.119.485.86.709.2]FIG.
4.
Trends
of
X4
genotype
representation
and
CD4
⫹T-cell
numbers
across
individuals.
Data
from
all
nine
participants
shown
in
Fig.
2
are
replotted
with
the
proportion
of
the
virus
population
with
an
X4
genotype
(a
to
c)
or
levels
of
circulating
CD4
⫹T
cells
(d
to
f),
relative
to
the
time
of
seroconversion
(a
and
d),
time
of
peak
viral
population
diversity
(b
and
e),
and
time
of
divergence
stabilizatio
n
(c
and
f).
Participant
color-coding
is
the
same
as
described
in
the
legend
to
Fig.
3.
The
dotted
vertical
lines
indicate
the
times
of
peak
diversity
(b
and
e)
or
divergence
stabilization
(c
and
f).
The
horizontal
line
across
the
lower
panels
indicates
a
CD4
⫹
lymphocyte
level
of
200
cells/
l.
(g
to
i)
Relationships
between
the
times
from
seroconversion
to
the
times
of
the
indicated
viral
population
events.
Slope
⫽
0.94
⫾
0.25
(g),
0.96
⫾
0.22
(h),
and
0.91
⫾
0.19
(i).
on November 9, 2019 by guest
http://jvi.asm.org/
Relationship of disease progression with viral evolutionary
changes and X4 viruses.
Across all participants, consistent
relationships were noted between times of the viral events
described earlier (i.e., peak diversity, divergence stabilization,
and emergence and peak representation of X4 viruses) and
changes in T-cell populations. The participants experienced
different rates of decline of CD4
⫹T cells over time (Fig. 4d).
However, seven of nine subjects (all except participants 9 and
11) transitioned to
ⱕ
200 CD4
⫹T cells/
l within 2 years
fol-lowing the point of divergence stabilization, with these two
events highly associated in time (r
2⫽
0.83; mean interval
⫽
0.97 years; 95% CI, 0.18 to 1.76) (Fig. 4i). The CD4
⫹T cells in
subject 9 dropped to 202 cells/
l 1 year following the point of
divergence stabilization (included in Fig. 4i), at which time he
began highly active antiretroviral therapy (HAART). Subject
11 experienced the most protracted decline in CD4
⫹T cells
and did not reach a level of 200 CD4
⫹T cells or a point of
divergence stabilization as of the last time point studied.
Consistent relationships were also noted among subjects
be-tween each of the above measures (times of peak viral
diver-sity, divergence stabilization, transition to
ⱕ
200 CD4
⫹T cells
per
l, peak representation of X4 viruses, and the failure of
T-cell homeostasis [represented by an inflection in CD3
⫹cells]
[65]), as shown in Fig. 5. Relative to failure of T-cell
homeosta-sis, peak viral diversity occurred a mean of 2.2 years earlier
(95% CI, 1.32 to 3.13 years earlier;
P
⫽
0.0005) (Fig. 5a), while
peak X4 representation occurred a mean of 1.08 years earlier
(95% CI,
⫺
0.20 to 2.36 years earlier;
P
⫽
0.087) (Fig. 5c) and
divergence stabilization occurred a mean of 0.46 years earlier
(95% CI,
⫺
0.44 to 1.36;
P
⫽
0.25) (Fig. 5b). CD4
⫹T cells
transitioned to the
ⱕ
200 cells/
l threshold a mean of 0.48
years after the CD3
⫹T-cell inflection (95% CI,
⫺
0.23 to 1.19;
P
⫽
0.16) (Fig. 5d).
Evolutionary patterns in late progressors.
Two participants
initially selected as nonprogressors experienced evidence of
disease progression with further follow-up. One of those
(par-ticipant 9) was studied in more detail after this progression
occurred. After a period of 8 years of stable CD3
⫹and CD4
⫹ [image:9.612.53.292.93.174.2]T-cell counts and a 4-year period of increasing viral load, he
experienced a rapid decline in CD4
⫹T cells to 202 cells/
l at
FIG. 5. Relationships between times from seroconversion to CD3⫹T-cell inflection and times to viral evolutionary changes and CD4⫹T-cell numbers. The time
of the CD3⫹cell inflection point is plotted relative to the time of peak viral diversity, slope⫽0.71⫾0.22 (a); divergence stabilization, slope⫽0.70⫾0.17 (b); peak
[image:9.612.125.480.401.700.2]representation of X4 viral genotypes, slope⫽0.51⫾0.28 (C); and transition of the CD4⫹T-cell levels toⱕ200/l, slope⫽0.72⫾0.14 (d).
TABLE 1. Virus phenotypes predicted from changes in V3 loop
sequences compared to phenotypes observed in virus culture
aPredicted virus phenotype
No. of isolates with phenotype
NSI SI CCR5⫺ CCR5⫹ CXCR4⫺ CXCR4⫹
R5 20 3 2 15 14 3
X4 8 7 0 2 0 2
Pvalue for
association 0.030 1.00 0.058
aFor each HIV isolate tested, the predicted phenotype based on the absence (R5) or presence (X4) of basic amino acid substitutions at positions 306, 319, or 320 of gp120 is compared to the results of tissue culture evaluations of viral growth on MT-2 cells (columns 1 and 2), CD4 and CCR5 cells (columns 3 and 4), and CD4 and CXCR4 cells (columns 5 and 6). ThePvalues (from Fisher’s exact test) measure the association of viral phenotypes predicted from changes in V3 loop sequences and phenotypes observed in virus cultures. The table shows that the V3 loop phenotype was associated with the SI culture phenotype (P⫽ 0.030) and marginally associated with the CXCR4 culture phenotype (P⫽0.058) but not associated with the CCR5 culture phenotype (P⫽1.00).
on November 9, 2019 by guest
http://jvi.asm.org/
the last time point available before receiving HAART.
Preced-ing the decrease in CD4
⫹T cells, a peak in viral diversity and
an outgrowth of X4 viruses were observed. Participant 11 had
stable T-cell counts and low viral loads for 7 years and
re-mained asymptomatic through 1998 without drug therapy.
However, attenuation in viral diversity and a minor outgrowth
of X4 viruses were noted at 6 years after infection. These were
followed by a decline in CD4
⫹and CD3
⫹T cells, indicating
that he was experiencing disease progression.
DISCUSSION
Our results suggest that in the individuals studied, the time
between primary HIV-1 infection and AIDS could be
subdi-vided into three phases based on patterns of viral evolution
over the C2-V5 region of
env. The phases were defined by
changes in viral divergence from the founder strain and
intra-time point diversity; these definitions in turn were reinforced
by observed changes in the prevalence of X4 viruses (probably
including dualtropic X4/R5 viruses). In the first phase, both
viral population divergence and diversity increased linearly,
with diversification essentially keeping pace with divergence at
a rate of about 1% per year. The beginning of the second phase
was signaled by a leveling off, or decrease, in diversity. In this
phase, the viral population continued to diverge from the
founder strain at the same rate, while diversity continued to
plateau or constrict. Finally, the increase in divergence also
slowed or stabilized, marking the beginning of the third phase,
the latter being characterized by a decline in diversity.
The peaking of diversity was strongly supported by statistical
analysis. Although similar support for the point of divergence
stabilization was not found, the validity of this concept, as well
as the general framework put forward here, is strongly
sup-ported by the consistency of the patterns described among
participants and by the close linkages observed between the
three defined phases and the patterns of X4 virus prevalence
and T-cell subset landmarks. Thus, the second phase was
strongly associated with X4 viruses, which in most participants
first appeared very close to the beginning of this phase and
peaked in prevalence very close to the end of it. The third
phase in turn was closely associated in time with the decline of
CD4
⫹T cells to
⬍
200/
l and with the failure of T-cell
ho-meostasis and a loss of phenotypically naive (CD45RA
⫹RO
⫺)
CD4
⫹T cells (48a). The proposed framework is also generally
consistent with previous sporadic reports of constriction of
HIV diversity (15, 51, 58) and similar rates of divergence from
the founder strain (39, 43, 45, 46, 82–84). Here, we have
ex-tended these previous reports by systematically documenting
the consistency of these patterns and rates.
Other arguments support the idea that the proposed
frame-work, though derived from a small number of participants, may
have broad applicability. (i) Participants were studied in
sub-stantial depth from seroconversion to advanced disease in
those developing disease progression. (ii) The findings were
quite consistent. (iii) Participants were representative of most
HIV-1-infected people in terms of the rate of disease
progres-sion (median survival time
⫽
9.1 years after seroconversion
compared to 10.2 years among the MACS participants as a
whole [56]) and occurrence of T-cell homeostasis failure
be-fore AIDS (seen in
⬃
75% of MACS participants who develop
AIDS [24, 34, 48]). (iv) The patterns were seen even in two
participants who were initially selected for lack of progression
of HIV disease but exhibited evidence of progression as
fol-low-up advanced.
Taken together, a summary sequence of events can be
in-ferred (Fig. 6) that describes the virological and T-cell changes
that occur in the asymptomatic period of HIV infection. It
should be stressed that these phases constitute general trends
found in the six individuals we studied who developed AIDS
during the period of analysis, although all nine experienced the
initial events we described. The sequence begins with the
de-tection of X4 viruses and the attainment of peak viral diversity
at a variable time after seroconversion (4 to 9 years in these
participants). If the time of X4 virus appearance is taken as
time zero, then peak diversity occurs an average of 0.3 years
later, followed by X4 peak representation at 1.5 years,
diver-gence stabilization at 2.2 years, T-cell homeostasis failure at 2.5
years, and CD4
⫹cell transition through 200 cells/
l at 2.9
years. Based on a study of 212 seroconverters and 1,129
sero-prevalant infections within the MACS cohort, the occurrence
of clinical AIDS-defining conditions follows T-cell homeostasis
failure by 1.7 years (24, 48), or approximately 4.2 years from
the emergence of X4 viruses.
Several caveats should be noted. It is not clear whether the
patterns and sequence of events observed can be generalized
to people with other rates (i.e., very rapid or very slow) of
disease progression or over shorter observation periods (23,
45, 46, 67, 76). Seven of the participants we studied were
typical progressors, whereas two (participants 9 and 11), were
initially chosen as examples of nonprogressors but
subse-quently did progress. Second, the length of the intervals
be-tween the noted events is variable within the individuals we
studied; the durations estimated here are not meant to set
limits and are mentioned only as a frame of reference for the
evaluation of additional HIV-infected individuals. Third, we
drew our inferences about viral evolutionary patterns on only
650 bp of
env; other genes and gene regions evolve more slowly
and may not exhibit the same patterns.
Despite these concerns, recognition of the aforementioned
patterns of HIV-1 evolution suggests a way to reconcile
con-flicting reports about the relationship between the rate of
HIV-1 disease progression and the degree and rate of increase
in viral diversity (15, 16, 23, 26, 27, 44–46, 49, 51, 52, 60, 73, 82,
83). Because only extensive sampling can detect the complex
pattern of viral evolution we describe, viral diversification
could appear spuriously slow if viral populations are assessed
infrequently, e.g., only early and late in infection (thereby
missing the point of peak diversity) or in people with highly
atypical disease pathogenesis (e.g., the slowest and the most
rapid progressors). A previous study of
env
sequences by
Shan-karappa et al. (71) suggested the existence of a diversity peak
with continuing divergence from the founder strain, although
sampling was less frequent and potentially compromised by
resampling (44).
In this study, X4 viruses were detected in the blood of all
nine participants and grew to predominance in six. This
rep-resents a significantly higher frequency of detection of X4
viruses than in approximately 50% of the individuals observed
in previous studies of people progressing to AIDS (36, 70, 78).
Previous studies have used phenotypic assays to detect X4
viruses, as opposed to the genotypic analysis done here. Both
methodologies can miss detection of X4 viruses on occasion.
However, we also noted that the representation of X4 viruses
peaked and then diminished over time, which could lead to
falsely low estimates of the proportion of people who have
circulating X4 viruses if they were sampled subsequent to such
a decline. Our higher detection rate by sequence analysis could
also reflect the fact that PBMC DNA harbors defective and
latent proviruses for extended periods (12, 61, 63, 69) and thus
may provide a record of past transient replication of X4
vi-ruses. Evidence for the transience of X4 viruses has also been
seen in previous studies (30, 51). We have also detected
tran-10498
SHANKARAPPA ET AL.
J. V
IROL.
on November 9, 2019 by guest
http://jvi.asm.org/
FIG. 6. Schematic illustration of proposed consistent patterns in development of HIV disease in moderate progressors. (a) Clinical phases of HIV infection as well as typical patterns of CD4⫹and CD3⫹T cells and plasma viral RNA loads. The initial transient increase in viral RNA is estimated from the literature, whereas the
later RNA increase and the CD3⫹and CD4⫹T-cell declines are based on the data from this study and that of Rinaldo et al. (65). (b) Patterns of viral sequence evolution
within the asymptomatic period of infection identified in this study. Circle diameters represent the mean viral population diversities at increasing intervals following seroconversion. Vertical displacement of the circles represents the extent of viral population divergence from the founder strain. Shading represents the proportion of the viral population comprised of viruses with an X4 genotype. Dotted vertical lines represent (from left) the end of acute infection, peak viral diversity, stabilization of divergence from the founder strain, and the development of AIDS. (c) Characteristic changes in viral evolution in the three periods of the asymptomatic phase identified in this study (1, increasing;2, decreasing;7, stable).
on November 9, 2019 by guest
http://jvi.asm.org/
sient representation of X4 viruses as well as a similar pattern of
viral evolutionary dynamics in the two other patients we have
studied throughout infection: a gay man with rapidly
progress-ing disease (43, 45) and a perinatally infected child (40a).
Overall, our results support the view that X4 viruses are likely
to occur in significantly more than 50% of people who develop
AIDS. It should be noted that X4 viruses have often been
linked to AIDS in HIV-1 subtype A, B, D, and E infections (18,
37, 59), have been found with significant frequency in early
HIV-1 subtype C infections (79), but are seen at low frequency
in cases of late-stage subtype C infections (59). Thus, it has not
been established that our findings apply to infections with all
HIV-1 subtypes.
Interestingly, the timing of evolution and rapidity of
out-growth of X4 viruses relative to the point of peak viral diversity
appeared to differ by mutation. X4 viruses with a mutation at
position 306 (participants 5 and 8) increased rapidly, reaching
a peak level shortly after initial detection. In contrast, viruses
with a mutation at position 320 (participants 1, 2, and 3)
reached peak levels more gradually, and the appearance of the
position 319 mutation was most variable and tended to be
found at low levels (participants 3, 6, 7, and 8 but not 9) and in
individuals with other X4-specific mutations. Thus, although
these data are preliminary, the specific X4 mutation may be
important to viral growth properties and in disease
progres-sion.
These observations suggest an important role for X4 viruses
in T-cell destruction late in the progression of HIV-1 infection
in the participants studied. This is plausible in view of the
preferential expression of CXCR4 on naive T cells (9) and on
thymocytes (50), which are needed to replenish memory T cells
(6). Among other recent findings suggesting a differential
im-pact of R5 and X4 viruses on T-cell populations (5, 8, 29, 33,
75, 81) is the mediation of apoptosis of CD8
⫹cells by X4 Env
(29), a mechanism that may apply to CXCR4-expressing naive
CD4
⫹cells as well.
Our data also suggest that the degree and rapidity of
im-mune reconstitution (1) that occurs under HAART may differ
according to the phase at which HAART is initiated, with
greater reconstitution possible prior to some of the milestones
we described. For example, it may be that people treated with
HAART before X4 viruses are detected will be able to restore
lost immunological functioning more effectively than those
whose treatment is begun later. In addition, given the serious
long-term side effects of HAART (10, 28), the ability to predict
AIDS onset
⬃
4 years in advance based on detection of X4
viruses (57) may help refine therapeutic strategies.
ACKNOWLEDGMENTS
We thank Lisa M. Frenkel, Patricia d’Souza, and Thera Mulvania
for helpful discussions; Dan Littman for cell lines; Elvia Ramirez,
LuAnn Borowski, Cindy Kleeberger, and Ming Ding for assistance;
David Swofford for permission to use the computer program PAUP*,
version 4.0d59, to estimate evolutionary distances under the general
time-reversible model; and MACS participants for their dedication to
the cohort study.
This work was supported by Public Health Service awards AI37984,
AI32885, AI34783, AI35042, RR00772, AI35039, AI35040, AI35041,
and AI27757, the latter while R.S. was supported by a New
Investiga-tor award from the University of Washington Center for AIDS
Re-search.
REFERENCES
1.Autran, B., G. Carcelain, T. S. Li, C. Blanc, D. Mathez, R. Tubiana, C. Katlama, P. Debre´, and J. Leibowitch.1997. Positive effects of combined antiretroviral therapy on CD4⫹T cell homeostasis and function in advanced HIV disease. Science277:112–116.
2.Bagnarelli, P., F. Mazzola, S. Menzo, M. Montroni, L. Butini, and M. Clementi.1999. Host-specific modulation of the selective constraints driving human immunodeficiency virus type 1envgene evolution. J. Virol.73:3764– 3777.
3.Berger, E., R. Doms, E. Fenyo, B. Korber, D. Littman, J. Moore, Q. Satten-tau, H. Schuitemaker, J. Sodroski, and R. Weiss.1998. A new classification for HIV-1. Nature391:240.
4.Berger, E. A.1997. HIV entry and tropism: the chemokine receptor connec-tion. AIDS11(Suppl. A):S3–S16.
5.Berkowitz, R. D., S. Alexander, C. Bare, V. Linquist-Steppes, M. Bogan, M. E. Moreno, L. Gibson, E. Wieder, J. Kosek, C. Stoddart, and J. M. McCune.1998. CCR5- and CXCR4-utilizing strains of human immunodefi-ciency virus type 1 exhibit differential tropism and pathogenesis in vitro. J. Virol.72:10108–10117.
6.Berkowitz, R. D., K. P. Beckerman, T. J. Schall, and J. M. McCune.1998. CXCR4 and CCR5 expression delineates targets for HIV-1 disruption of T cell differentiation. J. Immunol.161:3702–3710.
7.Bjorndal, A., H. Deng, M. Jansson, J. R. Fiore, C. Colognesi, A. Karlsson, J. Albert, G. Scarlatti, D. R. Littman, and E. M. Fenyo.1997. Coreceptor usage of primary human immunodeficiency virus type 1 isolates varies according to biological phenotype. J. Virol.71:7478–7487.
8.Bleul, C. C., M. Farzan, H. Choe, C. Parolin, I. Clark-Lewis, J. Sodroski, and T. A. Springer.1996. The lymphocyte chemoattractant SDF-1 is a ligand for LESTR/fusin and blocks HIV-1 entry. Nature382:829–832.
9.Bleul, C. C., L. Wu, J. A. Hoxie, T. A. Springer, and C. R. Mackay.1997. The HIV coreceptors CXCR4 and CCR5 are differentially expressed and regu-lated on human T lymphocytes. Proc. Natl. Acad. Sci. USA94:1925–1930. 10. Carr, A., K. Samaras, D. J. Chisholm, and D. A. Cooper.1998. Pathogenesis
of HIV-1-protease inhibitor-associated peripheral lipodystrophy, hyperlip-idaemia, and insulin resistance. Lancet351:1881–1883.
11. Centers for Disease Control and Prevention.1992. 1993 revised classification system for HIV infection and expanded surveillance case definition for AIDS among adolescents and adults. Morbid. Mortal. Weekly Rep.41:1–19. 12. Chun, T.-W., D. Finzi, J. Margolick, K. Chadwick, D. Schwartz, and R. F.
Siliciano.1995. In vivo fate of HIV-1-infected T cells: quantitative analysis of the transition to stable latency. Nat. Med.1:1284–1290.
13. de Jong, J. J., A. de Ronde, W. Keulen, M. Tersmette, and J. Goudsmit.1992. Minimal requirements for the human immunodeficiency virus type 1 V3 domain to support the syncytium-inducing phenotype: analysis by single amino acid substitution. J. Virol.66:6777–6780.
14. Delwart, E. L., M. P. Busch, M. L. Kalish, J. W. Mosley, and J. I. Mullins. 1995. Rapid molecular epidemiology of HIV transmission. AIDS Res. Hum. Retrovir.11:1181–1193.
15. Delwart, E. L., H. Pan, H. W. Sheppard, D. Wolpert, A. U. Neumann, B. Korber, and J. I. Mullins.1997. Slower evolution of human immunodefi-ciency virus type 1 quasispecies during progression to AIDS. J. Virol.71: 7498–7508.
16. Delwart, E. L., H. W. Sheppard, B. D. Walker, J. Goudsmit, and J. I. Mullins. 1994. Human immunodeficiency virus type 1 evolution in vivo tracked by DNA heteroduplex mobility assays. J. Virol.68:6672–6683. 17. Delwart, E. L., E. G. Shpaer, F. E. McCutchan, J. Louwagie, M. Grez, H.
Ru¨bsamen-Waigmann, and J. I. Mullins.1993. Genetic relationships deter-mined by a DNA heteroduplex mobility assay: analysis of HIV-1envgenes. Science262:1257–1261.
18. De Wolf, F., E. Hogervorst, J. Goudsmit, E. M. Fenyo, H. Rubsamen-Waig-mann, H. Holmes, B. Galvao-Castro, E. Karita, C. Wasi, S. D. K. Sempala, E. Baan, F. Zorgdrager, V. Lukashov, S. Osmanov, C. Kuiken, M. Cornel-issen, and WHO Network for HIV Isolation and Characterization.1994. Syncytium-inducing and non-syncytium-inducing capacity of HIV-1 subtypes other than B: phenotypic and genotypic characteristics. AIDS Res. Hum. Retrovir.10:1387–1401.
19. Erlich, H. A., D. Gelfand, and J. J. Sninsky.1991. Recent advances in the polymerase chain reaction. Science252:1643–1651.
20. Felsenstein, J.1989. PHYLIP—Phylogeny inference package, version 3.2. Cladistics5:164–166.
21. Folks, T. M., D. Powell, M. Lightfoote, S. Koenig, A. S. Fauci, S. Benn, A. Rabson, D. Daugherty, H. E. Gendelman, M. D. Hoggan, et al.1986. Bio-logical and biochemical characterization of a cloned Leu-3⫺cell surviving infection with the acquired immune deficiency syndrome retrovirus. J. Exp. Med.164:280–290.
22. Fouchier, R. A. M., M. Groenink, N. A. Kootstra, M. Tersmette, H. G. Huisman, F. Miedema, and H. Schuitemaker.1992. Phenotype-associated sequence variation in the third variable domain (V3) of the human immu-nodeficiency virus type 1 gp120 molecule. J. Virol.66:3183–3187. 23. Ganeshan, S., R. E. Dickover, B. T. Korber, Y. J. Bryson, and S. M.
Wolin-sky.1997. Human immunodeficiency virus type 1 genetic evolution in chil-dren with different rates of development of disease. J. Virol.71:663–677. 24. Gange, S. J., A. Mun˜oz, J. S. Chmiel, A. D. Donnenberg, L. M. Kirstein, R.
Detels, and J. B. Margolick.1998. Identification of inflections in T-cell counts among HIV-1-infected individuals and relationship with progression to clinical AIDS. Proc. Natl. Acad. Sci. USA95:10848–10853.
25. Giorgi, J. V., H. L. Cheng, J. B. Margolick, K. D. Bauer, J. Ferbas, M.
10500
SHANKARAPPA ET AL.
J. V
IROL.
on November 9, 2019 by guest
http://jvi.asm.org/
Waxdal, I. Schmid, L. E. Hultin, A. L. Jackson, L. Park, et al.1990. Quality control in the flow cytometric measurement of T-lymphocyte subsets: the Multicenter AIDS Cohort Study experience. The Multicenter AIDS Cohort Study Group. Clin. Immunol. Immunopathol.55:173–186.
26.Goodenow, M., T. Huet, W. Saurin, S. Kwok, J. Sninsky, and S. Wain-Hobson.1989. HIV-1 isolates are rapidly evolving quasispecies: evidence for viral mixtures and preferred nucleotide substitutions. J. Acquir. Immun. Defic. Syndr.2:344–352.
27.Haynes, B. F., G. Pantaleo, and A. S. Fauci.1996. Toward an understanding of the correlates of protective immunity to HIV infection. Science271:324– 328.
28.Henry, K., H. Melroe, J. Huebsch, J. Hermundson, C. Levine, L. Swensen, and J. Daley.1998. Severe premature coronary artery disease with protease inhibitors. Lancet351:1328. (Letter.)
29.Herbein, G., U. Mahlknecht, F. Batliwalla, P. Gregersen, T. Pappas, J. Butler, W. A. O’Brien, and E. Verdin.1998. Apoptosis of CD8⫹T cells is mediated by macrophages through interaction of HIV gp120 with chemokine receptor CXCR4. Nature395:189–194.
30.Ida, S., H. Gatanaga, T. Shioda, Y. Nagai, N. Kobayashi, K. Shimada, S. Kimura, A. Iwamoto, and S. Oka.1997. HIV type 1 V3 variation dynamics
in vivo: long-term persistence of non-syncytium-inducing genotypes and tran-sient presence of syncytium-inducing genotypes during the course of pro-gressive AIDS. AIDS Res. Hum. Retrovir.13:1597–1609.
31. Japour, A. J., S. A. Fiscus, J. M. Arduino, D. L. Mayers, P. S. Reichelderfer, and D. R. Kurizkes.1994. Standardized microtiter assay for determination of syncytium-inducing phenotypes of clinical human immunodeficiency virus type 1 isolates. J. Clin. Microbiol.32:2291–2294.
32. Jurriaans, S., B. Van Gemen, G. J. Weverling, D. Van Strijp, P. Nara, R. Coutinho, M. Koot, H. Schuitemaker, and J. Goudsmit.1994. The natural history of HIV-1 infection: virus load and virus phenotype independent determinants of clinical course? Virology204:223–233.
33. Kaneshima, H., L. Su, M. L. Bonyhadi, R. I. Connor, D. D. Ho, and J. M. McCune.1994. Rapid-high, syncytium-inducing isolates of human immuno-deficiency virus type 1 induce cytopathicity in the human thymus of the SCID-hu mouse. J. Virol.68:8188–8192.
34. Kaslow, R. A., D. G. Ostrow, R. Detels, J. P. Phair, B. F. Polk, and C. R. Rinaldo, Jr.1987. The Multicenter AIDS Cohort Study: rationale, organi-zation, and selected characteristics of the participants. Am. J. Epidemiol. 126:310–318.
35. Kimura, M.1980. A simple method for estimating evolutionary rates of base substitutions through comparative studies of nucleotide sequences. J. Mol. Evol.16:111–120.
36. Koot, M., I. Keet, A. Vos, R. deGoede, M. Roos, R. Coutinho, F. Miedema, P. Schellekens, and M. Tersmette.1993. Prognostic value of HIV-1 syncyti-um-inducing phenotype for rate of CD4⫹cell depletion and progression to AIDS. Ann. Intern. Med.118:681–688.
37. Korber, B., M. Hoelscher, F. McCutchan, C. Williamson, F. von Sonnen-burg, J. Mullins, M. Pletschette, J. Weber, G. van der Groen, S. Osmanov, and Workshop Report from the European Commission and the Joint United Nations Programme on HIV/AIDS.1997. HIV-1 subtypes: impli-cations for epidemiology, pathogenicity, vaccines and diagnostics. AIDS 11:UNAIDS17–UNAIDS36.
38. Koup, R. A., J. T. Safrit, Y. Cao, C. A. Andrews, G. McLeod, W. Borkowsky, C. Farthing, and D. D. Ho.1994. Temporal association of cellular immune responses with the initial control of viremia in primary human immunode-ficiency virus type 1 syndrome. J. Virol.68:4650–4655.
39. Kuiken, C. L., and B. Korber.1994. Epidemiological significance of intra-and inter-person variation of HIV-1. AIDS8:S73–S83.
40. Kumar, S., K. Tamura, and M. Nei.1994. MEGA: Molecular Evolutionary Genetics Analysis software for microcomputers. Comput. Appl. Biosci.10: 189–191.
40a.Laco, G., et al.Unpublished data.
41. Leitner, T., S. Kumar, and J. Albert.1997. Tempo and mode of nucleotide substitutions ingagandenvgene fragments in human immunodeficiency virus type 1 populations with a known transmission history. J. Virol.71:4761– 4770.
42. Levy, J. A.1993. Pathogenesis of human immunodeficiency virus infection. Microbiol. Rev.57:183–289.
43. Liu, S.-L., T. Mulvania, A. Rodrigo, B. Kosloff, X. He, D. Shriner, L. Corey, and J. I. Mullins.Emergence, evolutionary dynamics and selective advan-tage of human immunodeficiency virus type-1 chimeras in vivo. Submitted for publication.
44. Liu, S.-L., A. G. Rodrigo, R. Shankarappa, G. H. Learn, L. Hsu, O. Davidov, L. P. Zhao, and J. I. Mullins.1996. HIV quasispecies and resampling. Science273:415–416.
45. Liu, S. L., T. Schacker, L. Musey, D. Shriner, M. J. McElrath, L. Corey, and J. I. Mullins.1997. Divergent patterns of progression to AIDS after infection from the same source: human immunodeficiency virus type 1 evolution and antiviral responses. J. Virol.71:4284–4295.
46. Lukashov, V. V., C. L. Kuiken, and J. Goudsmit.1995. Intrahost human immunodeficiency virus type 1 evolution is related to length of the immu-nocompetent period. J. Virol.69:6911–6916.
47. Mantel, N.1967. The detection of disease clustering and a generalized regression approach. Cancer Res.27:209–220.
48. Margolick, J. B., A. Mun˜oz, A. D. Donnenberg, L. P. Park, N. Galai, J. V. Giorgi, R. G. O’Gorman, and J. Ferbas, for the Multicenter AIDS Cohort Study.1995. Failure of T-cell homeostasis preceding AIDS in HIV-1 infec-tion. Nat. Med.1:674–680.
49. Markham, R. B., W. C. Wang, A. E. Weisstein, Z. Wang, A. Munoz, A. Templeton, J. Margolick, D. Vlahov, T. Quinn, H. Farzadegan, and X. F. Yu. 1998. Patterns of HIV-1 evolution in individuals with differing rates of CD4 T cell decline. Proc. Natl. Acad. Sci. USA95:12568–12573.
50. McCune, J. M., R. Loftus, D. K. Schmidt, P. Carroll, D. Webster, Y.-L. B. Swor, I. R. Francis, B. H. Gross, and R. M. Grant.1998. High prevalence of thymic tissue in adults with human immunodeficiency virus-1 infection. J. Clin. Investig.101:2301–2308.
51. McDonald, R. A., D. L. Mayers, R. C.-Y. Chung, K. F. Wagner, S. Ratto-Kim, D. L. Birx, and N. L. Michael.1997. Evolution of human immunodeficiency virus type 1envsequence variation in patients with diverse rates of disease progression and T-cell function. J. Virol.71:1871–1879.
52. McNearney, T., Z. Hornickova, R. Markham, A. Birdwell, M. Arens, A. Saah, and L. Ratner.1992. Relationship of human immunodeficiency virus type 1 sequence heterogeneity to stage of disease. Proc. Natl. Acad. Sci. USA 89:10247–10251.
53. Mellors, J. W., L. A. Kingsley, C. R. J. Rinaldo, J. A. Todd, B. S. Hoo, R. P. Kokka, and P. Gupta.1995. Quantitation of HIV-1 RNA in plasma predicts outcome after seroconversion. Ann. Intern. Med.122:573–579.
54. Mellors, J. W., A. Mun˜oz, J. V. Giorgi, J. B. Margolick, C. J. Tassoni, P. Gupta, L. A. Kingsley, J. A. Todd, A. J. Saah, R. Detels, J. P. Phair, and C. R. Rinaldo, Jr.1997. Plasma viral load and CD4⫹lymphocytes as prognostic markers of HIV-1 infection. Ann. Intern. Med.126:946–954.
55. Mellors, J. W., C. R. Rinaldo, Jr., P. Gupta, R. M. White, J. A. Todd, and L. A. Kingsley.1996. Prognosis in HIV-1 infection predicted by the quantity of virus in plasma. Science272:1167–1170.
56. Mun˜oz, A., C. A. Sabin, and A. N. Phillips.1997. The incubation period of AIDS. AIDS11:S69–S76.
57. Nelson, J. A. E., S. A. Fiscus, and R. Swanstrom.1997. Evolutionary variants of the human immunodeficiency virus type 1 V3 region characterized by using a heteroduplex tracking assay. J. Virol.71:8750–8758.
58. Nowak, M. A., R. M. Anderson, A. R. McLean, T. F. Wolfs, J. Goudsmit, and R. M. May.1991. Antigenic diversity thresholds and the development of AIDS. Science254:963–969.
59. Peeters, M., R. Vincent, J. L. Perret, M. Lasky, D. Patrel, F. Liegeois, V. Courgnaud, R. Seng, T. Matton, S. Molinier, and E. Delaporte.1999. Evi-dence for differences in MT2 cell tropism according to genetic subtypes of HIV-1: syncytium-inducing variants seem rare among subtype C HIV-1 vi-ruses. J. Acquir. Immune Defic. Syndr. Hum. Retrovirol.20:115–121. 60. Pelletier, E., and S. Wain-Hobson.1996. AIDS is not caused by the extreme
genetic variability of HIV. J. NIH Res.8:45–48.
61. Perelson, A. S., P. Essunger, Y. Cao, M. Vesanen, A. Hurley, K. Saksela, M. Markowitz, and D. D. Ho.1997. Decay characteristics of HIV-1-infected compartments during combination therapy. Nature387:188–191. 62. Poss, M., A. G. Rodrigo, J. J. Gosink, G. H. Learn, D. de Vange Panteleeff,
H. L. Martin, Jr., J. Bwayo, J. K. Kreiss, and J. Overbaugh.1998. Evolution of envelope sequences from the genital tract and peripheral blood of women infected with clade A human immunodeficiency virus type 1. J. Virol.72: 8240–8251.
63. Psallidopoulos, M. C., S. M. Schnittman, L. M. Thompson III, M. Baseler, A. S. Fauci, H. C. Lane, and N. P. Salzman.1989. Integrated proviral human immunodeficiency virus type 1 is present in CD4⫹peripheral blood lym-phocytes in healthy seropositive individuals. J. Virol.63:4626–4631. 64. Richman, D. D., and S. A. Bozzette.1994. The impact of the
syncytium-inducing phenotype of human immunodeficiency virus on disease progres-sion. J. Infect. Dis.169:968–974.
65. Rinaldo, C. R., Jr., P. Gupta, X. Huang, Z. Fan, J. I. Mullins, S. Gange, H. Farzadegan, R. Shankarappa, A. Mun˜oz, and J. B. Margolick.1998. Anti-HIV-1 memory cytotoxic T lymphocyte responses associated with changes in CD4⫹T cell numbers in the progression of HIV-1 infection. AIDS Res. Hum. Retrovir.14:1423–1433.
66. Rodrigo, A. G., P. C. Goracke, K. Rowhanian, and J. I. Mullins.1997. Quantitation of target molecules from polymerase chain reaction-based lim-iting dilution assays. AIDS Res. Hum. Retrovir.13:737–742.
67. Salvatori, F., S. Masiero, C. Giaquinto, C. M. Wade, A. J. Leigh Brown, L. Chieco-Bianchi, and A. De Rossi.1997. Evolution of human immunodefi-ciency virus type 1 in perinatally infected infants with rapid and slow pro-gression to disease. J. Virol.71:4694–4706.
68. Schenker, E. L., L. E. Hultin, K. D. Bauer, J. Ferbas, J. B. Margolick, and J. V. Giorgi.1993. Evaluation of a dual-color flow cytometry immunophe-notyping panel in a multicenter quality assurance program. Cytometry14: 307–317.
69. Schnittman, S. M., M. C. Psallidopoulos, H. C. Lane, L. Thompson, M. Baseler, F. Massari, C. H. Fox, N. P. Salzman, and A. S. Fauci.1989. The reservoir for HIV-1 in human peripheral blood is a T cell that maintains
on November 9, 2019 by guest
http://jvi.asm.org/
expression of CD4. Science245:305–308. (Erratum,245:before 694, 1989.) 70. Schuitemaker, H., M. Koot, N. A. Kootstra, M. W. Dercksen, R. E. de Goede, R. P. van Steenwijk, J. M. Lange, J. K. Schattenkerk, F. Miedema, and M. Tersmette.1992. Biological phenotype of human immunodeficiency virus type 1 clones at different stages of infection: progression of disease is asso-ciated with a shift from monocytotropic to T-cell-tropic virus population. J. Virol.66:1354–1360.
71. Shankarappa, R., P. Gupta, G. H. Learn, A. G. Rodrigo, C. R. Rinaldo, M. C. Gorry, J. I. Mullins, P. L. Nara, and G. D. Ehrlich.1998. Evolution of human immunodeficiency virus type 1 envelope sequences in infected individuals with differing disease progression profiles. Virology241:251–259. 71a.Shankarappa, R., A. G. Rodrigo, D. Upchurch, G. H. Learn, and J. I.
Mullins.20 September 1999, posting date. Mullins Molecular Retrovirology Lab. [Online.] http://ubik.microbiol.washington.edu/HIV/evolution1/. [15 October 1999, last date accessed.]
72. Shearer, W. T., T. C. Quinn, P. LaRussa, J. F. Lew, L. Mofenson, S. Almy, K. Rich, E. Handelsman, C. Diaz, M. Pagano, V. Smeriglio, L. A. Kalish, and the Women and Infants Transmission Study Group.1997. Viral load and disease progression in infants infected with human immunodeficiency virus type 1. New Engl. J. Med.336:1337–1342.
73. Shioda, T., S. Oka, X. Xin, H. Liu, R. Harukuni, A. K