ESTIMATION OF TENOFOVIR BY REVERSE PHASE
LIQUID CHROMATOGRAPHY
Dissertation submitted in partial fulfillment of the
Dissertation submitted in partial fulfillment of the
Dissertation submitted in partial fulfillment of the
Dissertation submitted in partial fulfillment of the
requirement for the award of the degree of
requirement for the award of the degree of
requirement for the award of the degree of
requirement for the award of the degree of
MASTER OF PHARMACY
Of
THE TAMILNADU Dr.M.G.R MEDICAL UNIVERSITY, CHENNAI.
DEPARTMENT OF PHARMACEUTICAL ANALYSIS
K.M.COLLEGE OF PHARMACY
Uthangudi, Madurai – 625107
Completing a task is never a one man effort. It is often a result of invaluable
contributions of a number of individuals in a direct or indirect manner. This suitably
applies to my dissertation work.
First and foremost I thank the Almighty God and my parents
Almighty God and my parents
Almighty God and my parents
Almighty God and my parents
Rayapati.
Sankar rao and Nageswari seetharavamma
for all the blessings bestowed upon
me, which enabled me to successfully complete my project.
It is my pleasant duty to express my extreme sense of gratitude and indebtedness
to my guide Dr. M. Sundarapandian., M. Pharm., Ph.D.,
Dr. M. Sundarapandian., M. Pharm., Ph.D.,
Dr. M. Sundarapandian., M. Pharm., Ph.D., Asst.Professor, Department
Dr. M. Sundarapandian., M. Pharm., Ph.D.,
of Pharmaceutical Analysis for his proficient and valuable guidance and suggestions.
With due respect, I express my profound indulge and praise to my most
Honorable Chairman, Prof. M. Nagarajan., M. Pharm., MBA., DMS(IM).,
Prof. M. Nagarajan., M. Pharm., MBA., DMS(IM).,
Prof. M. Nagarajan., M. Pharm., MBA., DMS(IM).,
Prof. M. Nagarajan., M. Pharm., MBA., DMS(IM).,
DMS(BM).,
DMS(BM).,
DMS(BM).,
DMS(BM)., and Honorable Principal, Dr. S. Jayaprakash., M. Pharm., Ph.D.,
Dr. S. Jayaprakash., M. Pharm., Ph.D.,
Dr. S. Jayaprakash., M. Pharm., Ph.D., K. M.
Dr. S. Jayaprakash., M. Pharm., Ph.D.,
College of Pharmacy, Madurai for their incentive co-operation and encouragement.
My heartiest acknowledgement to Dr.S.Meena,M. Pharm., Ph.D.,
Dr.S.Meena,M. Pharm., Ph.D.,
Dr.S.Meena,M. Pharm., Ph.D.,
Dr.S.Meena,M. Pharm., Ph.D., Head of the
Dpartmaent, Department of Pharmaceutical Analysis and Prof. M. S. Prakash., M.
Prof. M. S. Prakash., M.
Prof. M. S. Prakash., M.
Prof. M. S. Prakash., M.
Pharm.,
Pharm.,
Pharm.,
Pharm., Professor, Department of Pharmaceutical Analysis, K. M. College of
Pharmacy, Madurai for their proficient and valuable guidance and suggestions
.
I’m deeply indebted to my friends Dr. Gorantla.K.Dileep Chowdary, Mr.
Dr. Gorantla.K.Dileep Chowdary, Mr.
Dr. Gorantla.K.Dileep Chowdary, Mr.
Dr. Gorantla.K.Dileep Chowdary, Mr.
A.Rama Krishna., M. Pharm., Dr. Raya. Kotinagi Reddy, Mr.Gannina. Bargav
A.Rama Krishna., M. Pharm., Dr. Raya. Kotinagi Reddy, Mr.Gannina. Bargav
A.Rama Krishna., M. Pharm., Dr. Raya. Kotinagi Reddy, Mr.Gannina. Bargav
A.Rama Krishna., M. Pharm., Dr. Raya. Kotinagi Reddy, Mr.Gannina. Bargav
Chowdary.,M.s
Chowdary.,M.s
Chowdary.,M.s
Chowdary.,M.s. who have been the source of strength throughout my life.
support.
I am especially thankful to the Librarian Mrs. Shanthi
Mrs. Shanthi
Mrs. Shanthi and Lab assistants Mrs.
Mrs. Shanthi
Mrs.
Mrs.
Mrs.
S. Kalpana Devi and
S. Kalpana Devi and
S. Kalpana Devi and
S. Kalpana Devi and Mrs.
Mrs.
Mrs. J. Sridevi,
Mrs.
J. Sridevi,
J. Sridevi,
J. Sridevi, Department of Pharmaceutical Analysis, K. M.
College of Pharmacy, Madurai for their timely assistance.
I also take this opportunity to thank our colleagues for their complementary
ideas for the Implementation of the Project.
Last but not least I wish to avail myself of this opportunity, express a sense of
gratitude and love to my friends and my beloved parents for their manual support,
strength, help and for everything.
With This I Remain,
With This I Remain,
With This I Remain,
With This I Remain,
Naresh Rayapati
Naresh Rayapati
Naresh Rayapati
Naresh Rayapati
(Reg. no.
(Reg. no.
(Reg. no.
This is to certify that the project entitled “METHOD DEVELOPMENT AND
VALIDATION FOR THE ESTIMATION OF TENOFOVIR BY REVERSE
PHASE LIQUID CHROMATOGRAPHY” by NARESH RAYAPATI (Reg. No. 26093126) in partial fulfillment of the degree of Master of Pharmacy in Pharmaceutical Analysis under Tamil Nadu Dr. M. G. R Medical University, Chennai, done at K. M.
COLLEGE OF PHARMACY, MADURAI-625107, is a bonafide work carried out by
him under my guidance and supervision during the academic year
SEPTEMBER-2010-2011. The dissertation partially or fully has not been submitted for any other degree or
diploma of this university or other universities.
GUIDE
HOD
Dr. M. Sundarapandian., M. Pharm., Ph.D., Dr.
S. MEENA.,
M. Pharm., Ph.D.,
Asst.Professor,
Professor,
Dept. of Pharmaceutical Analysis, Dept. of Pharmaceutical Analysis,
K.M. College of Pharmacy, K. M. College of Pharmacy,
Madurai- 625107. (T.N.) Madurai- 625107. (T.N.)
PRINCIPAL
Dr. S. JAYAPRAKASH.,
M. Pharm., Ph.D.,
Professor,
Dept. of Pharmaceutics,
ACN - Acetonitrile
BP - Boiling point
LOD - Limit of detection
LOQ - Limit of quantification
cm - Centimeter
Conc - Concentration
GC-MS - Gas chromatography- mass spectroscopy
gm - Grams
HPLC - High performance liquid chromatography
HPTLC - High performance thin layer chromatography
ICP-MS - Inductive coupled plasma- mass spectroscopy
IS - Internal standard
LC-MS - Liquid chromatography- mass spectroscopy
LOD - Limit of detection
LDL - Low-density lipoprotein
LOQ - Limit of quantitation
mg - Milligrams
min - Minutes
ml - Millilitre
mM - Millimolar
mm - Millimeter
MW - Molecular weight
µg - microgram
µl - microlitre
µm - micrometer
ng - Nanogram
NLT - Not less than
NMT - Not more than
pH - Negative logarithm of hydrogen ion
pKa - Dissociation constant
psi - per square inch
RI - Refractive index
RP-HPLC - Reverse phase high performance liquid chromatography
RSD - Relative standard deviation
SD - Standard deviation
Sl. No - Serial number
Std - Standard
THF - Tetrahydrofuran
TLC - Thin layer chromatography
UV - Ultra-violet
USP - United states pharmacopoeia
Vs - Versus
v/v - volume/volume
λ - Lambda
ºC - degree centigrade
S.No. CONTENTS Page No.
1 INTRODUCTION 1-22
2 DRUG PROFILE 23-24
3 REVIEW OF LITERATURE 25-29
4 AIM AND PLAN OF THE
STUDY
30
5 METHODOLOGY 31-50
6 RESULTS AND DISCUSSION 51-52
7 CONCLUSION 53
1. INTRODUCTION
HIGH PERFORMANCE LIQUID CHROMATOGRAPHY
INTRODUCTION (1)
HPLC was introduced commercially in 1969 and since then it has undergone extensive
modifications and innovation, which lead to its emergence as the foremost analytical tool for
quantitative analysis. HPLC is a type of liquid chromatography that employs a liquid mobile
phase and a very finely divided stationary phase. In order to obtain a satisfactory flow rate liquid
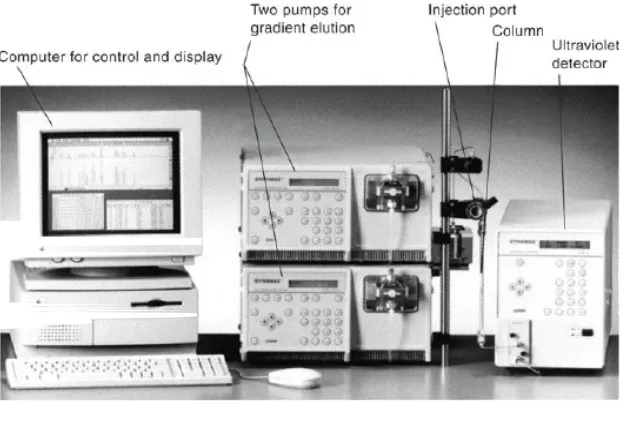
[image:9.612.147.459.282.495.2]must be pressurized to a few thousands of pounds per square inch.
Fig.1 HPLC System.
The rate of distribution of drugs between stationary and mobile phase is controlled by
diffusion process. If diffusion is minimized, a faster and effective separation can be achieved.
The technique of HPLC is so called because of its improved performance when compared to
classical column chromatography. Advances in column technology, high-pressure pumping
system and sensitive detectors have transformed liquid column chromatography into high speed,
The HPLC is the method of choice in the field of analytical chemistry, since this method
is specific, robust, linear, precise and accurate and the limit of detection is low and also it offers
the following advantages,
• Speed (many analysis can be accomplished in 20 min or less)
• Greater sensitivity (various detectors can be employed)
• Improved Resolution (wide variety of stationary phases)
• Reusable columns
• Ideal for the substances of low volatility
• Easy sample recovery, handling and maintenance
• Instrumentation leads itself to automation and quantization
• Precise and Reproducible
• Calculations are done by integrator itself
TYPES OF HPLC TECHNIQUES:
Based on modes of chromatography:
• Reverse phase chromatography
• Normal phase chromatography
Based on principle of separation:
• Adsorption chromatography
• Ion exchange chromatography
• Size exclusion chromatography
• Affinity chromatography
• Chiral phase chromatography
Based on elution technique:
• Isocratic separation
Based on the scale of operation:
• Analytical HPLC
• Preparative HPLC
Reversed phase chromatography
In 1960s, chromatographers started modifying the polar nature of the silanol group by
chemically reacting silicon with organic silanes.
The object was to make silica less polar or non-polar so that polar solvents can be used to
separate water-soluble polar compounds. Since the ionic nature of the chemically modified silica
in now reversed i.e., it is non-polar or the nature of the phase is reversed, the chromatographic
separation carried out with such silica is referred to as reversed-phase chromatography.
A large number of chemically bonded silica based stationary phases are available
commercially. Silica based stationary phases are still more popular in reversed phase
chromatography; however other adsorbents based on polymer (styrene divinyl benzene
copolymer) are slowly gaining ground.
The less water-soluble compounds are better retained by the reversed phase surface. The
retention time decreases in the following order: Aliphatic > induced dipoles (E.g. CCl4) >
permanent dipoles (E.g. CHCl3) > weak Lewis bases (Ethers, aldehydes, ketones) > strong Lewis
bases (amines) > weak Lewis acids (alcohols, phenols) > strong Lewis acids (carboxylic acids).
Also the retention increases as the number of carbon atoms increases.
As a general rule, the retention increases with an increase in the contact area between
sample molecule and stationary phase i.e., with an increase in the number of water molecules,
which are released during the adsorption of a compound. Branched chain compounds are eluted
more rapidly than their corresponding normal isomers.
In reversed phase system the strong attractive forces between water molecules arising
from the 3-dimensional intermolecular hydrogen bonded network present in the structure of
Only higher polar or ionic solutes can interact with the water structure. Now polar solutes
are squeezed out of the mobile phase and are relatively insoluble in it, but with the hydrogen
carbon moieties of the stationary phase.
Chemically bonded octadecyl silane (ODS) and alkane with 18 carbon atoms is the most
popular stationary phase used in pharmaceutical industry. Since most pharmaceutical compounds
are polar and water soluble, the majority of HPLC methods used for quality assurance,
decomposition studies, quantitative analysis of both bulk drugs and their formulations use ODS
HPLC columns. The solvent strength in reverse phase chromatography is reversed from that of
adsorption chromatography (silica gel) as stated earlier. Water interacts strongly and highly with
silanol groups, so that adsorption of sample molecules become highly restricted and they are
rapidly eluted as a result. Exactly opposite applies in reversed phase system; water cannot wet
the non-polar (hydrophobic) alkyl group such as C18 of ODS phase and therefore does not
interact with the bonded moiety. Hence water is the weakest solvent of all and gives slowest
elution rate. The elution time (retention time) in reversed phase chromatography increases with
increasing amount of water in the mobile phase.
Adsorption chromatography / normal phase chromatography
In normal phase chromatography, the stationary phase is polar adsorbent. The mobile
phase is generally a mixture of non-aqueous solvents. The silica structure is saturated with
silanol group at the end in normal phase separations. These OH groups are statistically
distributed over the whole of the surface. The silanol groups represent the active sites (very
polar) in the stationary phase.
This forms a weak bond with many molecules in the vicinity when any of the following
interactions are present. Dipole-induced dipole, dipole-dipole, hydrogen bonding, -complex
bonding. These situations arise when the molecule has one or several atoms with lone pair
electrons or a double bond. The adsorption strengths and hence ‘K’ value (elution series) increase
in the following order. Saturated hydrocarbon < olefins < aromatic < organic < halogen
compounds < sulphides < ethers < esters < aldehydes and ketones < amines < sulphones <
groups in the sample molecule but also on stearic factors. If a molecule has several functional
groups, then the most polar one determines the reaction properties.
Chemically modified silica, such as aminopropyl, cyanopropyl and diol phases are the
stationary phases alternative to silica gel in normal phase chromatography.
The aminopropyl and cyanopropyl phases provide opportunities for specific interactions
between the analyte and the stationary phase and thus offer additional options for the
optimizations of separations. Other advantages of bonded phases lie in the increased
homogeneity of the stationary phase surface.
Polar modifiers such as acetic acid or triethylamine (TEA) are added to the mobile phase,
to deactivate the more polar adsorption sites on the surface of stationary phase, which in turn will
improve peak shape as well as the reproducibility of the retention times.
Ion-exchange Chromatography
Separation is based on the charge-bearing functional groups, anion exchange for sample
negative ion, or cation exchange - for sample positive ion. Gradient elution by pH is common.
Size Exclusion Chromatography
Also known as gel permeation or filtration, separation is based on the molecular size or
hydrodynamic volume of the components. Molecules that are too large for the pores of the
porous packing material on the column elute first, small molecules that enter the pores elute last
and the elution rates of the rest depend on their relative sizes.
Affinity/ Ion-pair Chromatography
Separation is based on a chemical interaction specific to the target species. The more
popular reversed phase mode uses a buffer and an added counter-ion of opposite charge to the
sample with separation being influenced by pH, ionic strength, temperature, concentration of and
type of organic co-solvent(s). Affinity chromatography, common for macromolecules, employs a
its homologous antigen (analyte) as a reversible complex that can be eluted by changing buffer
conditions.
Chiral Chromatography:
Separation of the enantiomers can be achieved on chiral stationary phases by formation
of diastereomers via derivatizing agents or mobile phase additives on chiral stationary phases.
When used as an impurity test method, the sensitivity is enhanced if the enantiomeric impurity
elutes before the enantiomeric drug.
Isocratic Separation:
In this technique, the same mobile phase combination is used throughout the process of
separation. The same polarity or elution strength is maintained the process.
Gradient Separation:
In this technique, a mobile phase combination of lower polarity or elution strength is used
followed by gradually increasing the polarity or elution strength.
Analytical HPLC:
In this only analysis of the samples are done. Recovery of the samples for reusing is
normally not done, since the samples used are very low.
Preparative HPLC:
Where analysis of the individual fractions of pure compounds can be collected using
fraction collector. The collected samples are reused.
INSTRUMENTATION
PUMPS (2)
The HPLC pump is considered to be one of the most important components in a liquid
the HPLC injector, column and detector. Pumps are constructed with materials such as stainless
steel, Teflon, Glass.
Standard HPLC Pump requirements are
Flow Rate Range : 0.01 – 10 ml/min
Pressure Range : 1 – 5,000 psi
Pressure Pulsations : Less than 1% for Normal and Reverse phase HPLC
Less than 0.2%. for Size Exclusion Mode.
The two basic classifications are Constant Pressure Pump and Constant Flow Pump. The
first is used for column packing and the second type is most widely used in all common HPLC
applications.
Constant Pressure pump can deliver a constant flow rate if the pump operates against a
constant column backpressure and if the viscosity of the mobile phase remaining constant.
Constant pressure pump may be simple gas displacement pump or pneumatic amplifier pump.
Simple gas displacement pump is a reservoir such as coil of tubing to which pressure is applied
from a gas cylinder. The disadvantage of this pump is limited solvent capacity. Pneumatic
amplifier pump is a modification of simple gas displacement pump. The gas pressure is applied
to a large piston, which is connected to a small diameter piston, which is in contact with mobile
phase when all the mobile phase is used up, the piston returns quickly by pneumatic means, thus
refilling the chamber. The advantage of this is pulse less flow and unlimited solvent capacity.
POSITIVE DISPLACEMENT (SYRINGE) PUMP
Syringe pump is a single stroke displacement pump which has to be refilled after it
displaces the whole syringe volume. On the other hand, a syringe pump does not have any flow
and pressure pulsations compared to the reciprocating pump. A screw fed drive connected to a
stepping motor actuates the piston inside the chamber. For the micro-HPLC applications a
syringe pump allows for the maintaining of a constant flow at the micro liter per minute flow rate
Mixing unit is used to mix solvents in different proportions and pass through the column. The
two primary methods of blending the mobile phase components are Low Pressure Mixing and
High Pressure Mixing.
In an isocratic separation, mobile phase is prepared by using pure solvent or mixture of
solvents, i.e., solvent of same eluting power or polarity is used. But in gradient elution technique,
the polarity of the solvent is gradually increased and hence the solvent composition has to be
changed. Hence a gradient controller is used when two or more solvent pumps are used.
INJECTORS
Injectors for liquid chromatographic systems should provide the possibility of injecting
the liquid sample within the range of 0.1 to 100 ml of volume with high reproducibility and
under high pressure (up to the 4000 psi). They should also produce minimum band broadening
and minimize possible flow disturbances. Generally, the most useful and widely used sampling
device for modern LC is the micro sampling injector valve.
RHEODYNE INJECTOR
Because of their superior characteristics, valves are now used almost to the exclusion of
syringe injection. With these sampling valves, samples can be introduced reproducibly into
pressurized columns without significant interruption of flow, even at elevated temperature.
AUTOMATIC INJECTORS
With commercially available automatic sampling devices, large number of samples can
be routinely analyzed by LC without operator intervention. Such equipment is popular for the
analysis of routine samples (e.g., quality control of drugs), particularly when coupled with
automatic data-handling systems. Automatic injectors are indispensable in unattended searching
(e.g., overnight) for chromatographic parameters such as solvent selectivity, flow rate, and
temperature optimization. Most of the auto samplers have a piston metering syringe type pump
to suck the reestablished sample volume into a line and then transfer it to the relatively large loop
pressurization caps. A special plunger with a needle, push the cap down to the vial and displace
the sample through the needle into the valve loop. Most of the auto samplers are microprocessor
controlled and can serve as a master controller for the whole instrument.
COLUMNS
HPLC column are made up of stainless steel or glass, which differs in length and inside
diameter depending on the application. The two types of columns are Analytical column and
Preparative column. Standard analytical columns are 4-5 mm in internal diameter and 10-30 cm
in length. The particle size used ranges from 5-10 pm. Preparative columns are 20-50 mm in
internal diameter and 20-100 cm in length. The particle size used ranges from 37-50 m.
PRE COLUMN FILTERS: (Guard Column)
Prevents the contamination of the expensive analytical columns with fine particles that
can eventually clog the mobile phase flow. Made up of Porous stainless Frit (0.5 – 2 m) or a
little piece of sacrificial column.
Functional group present in stationary phase depends on the type of chromatographic
separation. In normal phase mode it contains the silanol groups (OH group), in reverse phase
mode it contains Octyl Decyl Silane (ODS) column, Octyl column, Butyl column, Nitrile
column, Amino column, Base deactivated silane (BDS) column etc., for other modes of
chromatography, ion exchange, gel columns, and chiral columns are available.
DETECTORS
The function of the detector in HPLC is to monitor the mobile phase as it emerges from
the column. Generally, there are two types of HPLC detectors, bulk property detectors and solute
a) Bulk property detectors:
These detectors are based on differential measurement of a property, which is common to
both the sample and the mobile phase. Examples of such detectors are refractive index,
conductivity and dielectric constant detectors.
b) Solute property detectors:
Solute property detectors respond to a physical property of the solute, which is not
exhibited by the pure mobile phase. These detectors measure a property, which is specific to the
sample, either with or without the removal of the mobile phase before the detection. Solute
property detectors which do not require the removal of the mobile phase before detection include
spectrophotometric (UV or UV-Visible) detector, fluorescence detectors, polarographic,
electro-chemical and radio activity detectors, where flame ionization detector and electron capture
detector both require removal of the mobile phase before detection.
RECORDERS AND INTEGRATORS
Recorders are used to record the responses obtained from detectors after amplification, if
necessary. They record the baseline and all the peaks obtained, with respect to time. Retention
time for all the peaks obtained, with respect to time. Retention time for all the peaks can be
found out from such recordings, but the area of individual peaks cannot be known.
Integrators are improved version of recorders with some data processing capabilities.
They can record the individual peaks with retention time, height and width of peaks, peak area,
percentage of area, etc. integrators provide more information on peaks than recorders. Nowadays
computers and printers are used for recording and processing the obtained data and for
controlling several operations.
APPLICATIONS IN PHARMACEUTICAL ANALYSIS
The sample or solute is analyzed quantitatively in HPLC by either peak height or Peak
area measurements. Peak areas are proportional to the amount of constant rate. Peak heights are
affected by the sample injection techniques. Once the peak height or the peak areas are
measured, there are five principle evaluation methods for quantifying the solute.
Calibration by Standards
Calibration curves for each component are prepared from pure standards, using identical
injection volumes and operating conditions for standards and samples. The concentration of
solute is read from its curve if the curve is linear.
Concentration of solute = Proportionality Constant (k) x Area
In this evaluation method only the area of the peaks of interest is measured. Relative
response factors must be considered when converting areas to volume and when the response of
a given detector differs for each molecule type of compounds.
Internal Standard Method
In this technique a known quantity of the internal standard is chromatographed and area
Vs concentration is ascertained. Then a quantity of the internal standard is added to the raw
sample prior to any sample pretreatment or separation operations.
The peak area of the standard in the sample run is compared with the peak area of the
standard run separately. This ratio serves as a correction factor for variation in sample size, for
losses in any preliminary pretreatment operations or for incomplete elution of the sample. The
material selected for the internal standard must be completely resolved from adjacent sample
components must not interfere with the sample components and must never be present in
samples.
Standard Addition Method
If only few samples are to be chromatographed, it is possible to employ the method of
standard addition(s). The chromatogram of the unknown is recorded, then a known amount of
analyte(s) is added and the chromatogram is recorded using same reagents, instruments and other
conditions. From the increase in the peak area (or peak height), the original concentration can be
The detector response must be a linear function of analyte concentration and yield no
signal at zero concentration of the analyte. Sufficient time must elapse between addition of the
standard and actual analysis to allow equilibrium of added standard with any matrix interfering.
A correction for dilution must be made if the amount of standard added changes the total
sample volume significantly. It is always advisable to check the result by adding at least one
other standard.
External Standard Method
It employs a separate injection of a fixed volume of sample and standard solution. The
peaks are integrated and concentration is calculated.
The selection of suitable chromatographic (HPLC) system for a given mixtures of solutes
cannot be made with certainty and must be confirmed by experiment. If the chemical nature of
the sample components is known, then the phase system can be selected from the literature
references. If nothing is known about the chemical nature of sample, then the sample solubility
will give some indication as to which chromatographic method to employ.
Best column, best mobile phase, best detection wavelength, efforts in their selection can
make a world of difference while developing HPLC method for routine analysis. Determining
the ideal combination of these factors assures faster delivery of desired results and validated
method for separation.
INTRODUCTION TO METHOD DEVELOPMENT(3)
HPLC method development for the analysis of mixtures of substances is a task that
usually requires much expertise. It is also extremely time-consuming. In spite of advances in
chromatographic theory, HPLC method development is still based mainly on “trial and error”.
The development of any new or improved method usually tailors existing approaches and
instrumentation to the current analyte, as well as to the final needs or requirements of the
method. Method development in Liquid chromatography usually requires selecting the method
decisions regarding choice of column, mobile phase, detectors, and method of quantitation must
be addressed.
The following are the reasons for developing new methods of analysis:
• The method may not be suitable for particular analyte.
• Existing method may be too error or contamination prone or they may be unreliable.
• Existing method may be too expensive, time consuming or energy intensive, or they may
not be easily automated.
• Existing method may not provide adequate sensitivity or analyte selectivity in samples of
interest.
• Newer instrumentation and techniques may have evolved that provide opportunities for
improved methods, including improved analyte identification or detection limits, greater
accuracy or precision or better return on investment.
• There may be a need for an alternative method to confirm, for legal or scientific reasons,
analytical data originally obtained by existing methods.
The goals of the method are necessary to translate into a method development design. Goals for
new or improved analytical methods might include the following.
• Qualitative identification of the specific analyte(s) of interest providing some structural
information to confirm "general behavior"(e.g. retention time, colour change, pH etc.,
• Quantitative determination, at trace levels when necessary that is accurate, precise, and
reproducible in any laboratory setting when performed according to established procedures.
• Ease of use, ability to be automated, high sample throughput, and rapid sample turn
around time.
• Decreased cost per analysis from using simple quality assurance and quality control
procedures.
• Preparation of samples that minimize time, effort, materials, and volume in of sample
consumed.
The first step in the method development process is to decide which chromatographic
method will be used. Choices may be as diverse as GC, LC or superficial-fluid chromatography
(IEC) or ion-pairing chromatography (IPC). Within RPLC, silica modified with octadecyl, Octyl
or short alkyl chains or with phenyl, amino or Cyano groups may form the stationary phase. This
shows that there is a 'selection tree' for chromatographic systems. For each stationary phase there
may still be a number of different mobile phases from which to select the most promising
starting conditions (or the best 'first guess').
Steps involved in HPLC Method Development:
Step-1:
Method Selection: The first step in developing an HPLC method is to always consult the
literature to ascertain whether the separation has been previously performed and if so, under
what conditions-this will save time, doing unnecessary experimental work. The information from
literature should contain.
• Solubility profile – which provides the information about the solubility of drug
substances in different solvents and at different pH conditions.
• Analytical profile – which provides the information about the analytical profile of the
drug substance, impurities and degradation products.
• Stability profile – which provides the information about the stability profile of the drug
substance with respect to storage conditions.
Step-2
Retention Optimization: This step determines the optimum conditions to adequately retain all
analytes that ensures no analyte has a capacity factor limits not less than 0.5 and not greater than
10-15.
• Poor retention could result in peak overlapping.
• Excessive retention leads to long analysis time and broad peaks with poor detection.
Step-3
Selectivity Optimization: The mobile phase and stationary phase compositions need to be taken
into account to achieve adequate selectivity (peak spacing). To minimize the number of trail
chromatograms involved, only the parameters that are likely to have a significant effect on
be considered. It is much easier to optimize mobile phase parameters than to optimize stationary
phase.
Step-4
System Optimization: This is used to find the desired balance between resolution and analysis
time after satisfactory selectivity has been achieved. The parameters involved include column
dimensions, column packing, particle size and flow rate. These parameters may be changed
without affecting capacity factors or selectivity.
Step-5
Method Validation: Proper validation of analytical methods is important for pharmaceutical
analysis when ensuring of the continuing efficacy and safety of each batch manufactured relies
solely in the determination of quality. Method Validation is generally a one-time process
performed after the method has been developed to demonstrate that the method is scientifically
sound and that serves the intended analytical purpose.
METHOD VALIDATION PARAMETERS (4)
ICH for registration of pharmaceuticals has developed consensus text on validation of
analytical procedures which include,
Specificity
It is the ability to asses’ unequivocally the analyte in the presence of components which
may be expected to present. Lack of specificity of an individual analytical procedure may be
compensated by other supporting analytical procedures.
Procedures used to demonstrate specificity will depend on the intended objective of the
analytical procedures.
It is not always possible to demonstrate that analytical procedures is specific for a
particular analyte (complete discrimination).In this case a continuation of two or more analytical
Accuracy
Accuracy of an analytical procedure expresses the closeness of agreement between the
value which is accepted either as conventional true value or on an accepted reference value and
the value found.
Assay
Active substance
Several methods of determining accuracy are available
a. Application of analytical procedures to an analyte of known purity (Eg.Reference
material).
b. Comparison of the results of the proposed analytical procedures with those of a second
well-characterized procedure, the accuracy of which is stated and /or defined.
c. Accuracy may be inferred once precision linearity and specificity has been established.
Medicinal products - methods include
a. Application of analytical procedure to synthetic mixtures of product components to
which known quantities of substance to be analyzed have been added.
b. In case where it is impossible to obtain samples of all product components, it may be
acceptable either to add known quantities of the analyte to the product or to compare
the result obtained from a second well characterized procedure, the accuracy of
which is stated and defined.
Impurity (Quantification)(5)
Accuracy should be assessed on sample (substance/products) spiked with known amount
Precision
The precision of analytical procedure express the closeness of agreement between a series
of measurement obtained from multiple sampling of the same homogeneous sample under
prescribed conditions. Precision of an analytical procedure is usually expressed at the variance,
standard deviation or coefficient of variation of series of measurements.
Repeatability
Express the precision under the same operating conditions over a short interval of time.
Repeatability is also termed as intra assay precision.
It should be assessed using a minimum of nine determinations covering the specified
range for the procedure (Eg. three concentration /three replicates each) or a minimum of
determination at 100% of the test concentration.
Intermediate precision
The extent to which intermediate precision should be established depends on the
circumstances under which the procedure is intended to be used. Typical variations to be studied
include days, analysts, equipments etc.
It is not necessary to study these effects individually. The use of experimental design
(matrix) is encouraged.
Reproducibility
Reproducibility is assessed by means of an interlaboratory trial. Reproducibility should be
considered in case of the standardization of an analytical procedure, for instance of procedures in
pharmacopoeias.
Linearity &Calibration Curve
Linearity of an analytical produce is its ability (within a given range) to obtain test results
Linearity should be evaluated by visual inspection of a plot of signals as a function of
analyte concentration or content. If there is a linear relationship test results should be evaluated
by appropriate statistical methods for example, by calculation of a regression line by the method
of least squares. Therefore data from regression line itself may be helpful to provide
mathematical estimates of the degree of linearity. For linear ranges the deviations should be
equally distributed between positive and negative values.
Range
Range of an analytical procedure is the interval between the upper and lower
concentration (amounts) of analyte in the sample including these concentrations for which it has
been demonstrated that the analytical procedure has a suitable level of precision accuracy and
linearity.
The following minimum specified ranges should be considered.
For the assay of an active substance or a finished product – 80 – 120% of the test
concentration.
For the content uniformity – 70 – 130% of test. For dissolution testing, 20% over specified range.
Eg. If the specifications for the controlled released product cover a region from 20% after
the 90% after 24hrs, the validated range – 0-110% of label claim.
For the determination of an impurity.
Reporting level of impurity to 12% of specifications.
Limit of Detection
Several approaches depending on whether the procedure is a non-instrumental or
instrumental are available.
Based on visual Evaluation
The detection limit is determined by the analysis of samples with known concentration of
Based on signal to noise ratio
This approach can only be applied to analytical procedure which exhibit base line noise.
Determination of signal to noise ratio is performed by comparing measured signals from samples
with known low concentrations of analyte with those of blank samples and establishing the
minimum concentration at which the analyte can be detected.
Based on the standard deviation of the response and the slope:
Detection Limit (DL) = 3.3 σ/s
Where σ = the standard deviation of the response
S = the slope of the calibration curve
S is calculated from calibration curve of analyte
Based on standard deviation of Blank
Measurement of the magnitude of analytical background response is performed by
analyzing an appropriate number of blank samples and calculating the standard deviation of
these responses.
Based on calculation curve
A specific calibration curve should be studied using samples containing an analyte in the
range of DL and QL. The residual standard deviation of a regression line or the standard
deviation of y-intercept of regression line may be used as the standard deviation
Recommended Data
The detection limit and the method used for determining the detection limit should be
presented.
In case of calculation or extrapolation method, it must be subsequently validated by
independent analysis of suitable number of samples known to be near or prepared at the
detection limit.
Limit of Quantification
Several approaches are there based on whether the procedure is instrumental / non
instrumental approaches other than are also acceptable.
Based on Visual Evaluation
Visual evaluation may be used for non-instrumental methods but may also be used with
instrumental methods. The detection limit is determined by the analysis of samples with known
concentrations of analyte and be establishing the minimum level at which the analyte can be
reliable detected. The quantitation limit is generally determined by the analysis if samples with
known concentrations of analyte and by establishing the minimum level at which the analyte can
be quantified with acceptable accuracy and precision.
Based on signal to noise ratio
This approach can only be applied to analytical procedures, which exhibit baseline noise.
Determination of the signal-to-noise ratio is performed by comparing measured signals from
samples with known low concentrations of analyte with those of blank samples and establishing
the minimum concentrations at which the analyte can be reliably detected and quantified. A
signal-to-noise ratio between 3 or 2:1 is generally considered acceptable for estimating the
detection limit and a ratio of 10:1 for quantitation.
A typical to noise ratio is 10:1.
Based on the standard deviation of the response and the slope
Where σ = the standard deviation of the response
S = slope is obtained from calibration curve
The estimate may be curried out by various methods
Based on the Standard Deviation of the Blank
Measurement of the magnitude of analytical background response is performed by
analyzing an appropriate number of blank samples and calculating the standard deviation of
these responses.
Based on the calibration curve
A specific calibration curve should be studied using samples containing an analyte in the
range of DL and QL. The residual standard deviation of a regression line or the standard
deviation of y-intercepts of regression lines may be used as the standard deviation.
Robustness
It is depends on the type of procedure under study. It should show the reliability of an
analysis with respect to deliberate variations in method parameters.
Examples of typical variations are
Stability of analytical solutions
Extraction time
In case of liquid chromatography, examples of typical are
Influence of variation in mobile phase composition Different columns
Temperatures Flow rate
In case of gas chromatography
Different columns Temperature Flow rate
Ruggedness
Degree of reproducibility of test results obtained by analyzing the same sample under variety
of normal test conditions. Such as different
Analysts Instruments
Days
Reagents
Column TLC plates
Comparison of reproducibility of test results to be precision of assay is the direct measure of
2. DRUG PROFILE
TENOFOVIR
2.1 Chemical properties:
IUPAC name: ({[(2R)-1-(6-amino-9H-purin-9-yl)propan-2-yl]oxy}methyl)phosphoric acid
Molecular Weight: 287.213 g/mol
Molecular Formula: C9H14N5O4P
STRUCTURE:
2.2 Physical Properties:
Tenofovir is a white to off-white crystalline
powder with a solubility of 13.4 mg/mL in distilled water
at 25 °C. It has an octanol/phosphate buffer (pH 6.5)
partition coefficient (log p) of 1.25 at 25 °C.
2.3 Pharmacokinetic data:
Absorption: The oral bioavailability in fasted patients is approximately 25%.
Administration of food (high fat meal containing 40 to 50% fat) increases the
oral bioavailability, with an increase in the AUC of approximately 40%.
Protein binding: < 0.7% to human plasma proteins and < 7.2% to serum proteins.
Half-life: Approximately 17 hours.
Excretion: Excreted renally by glomerular filtration and active tubular secretion
2.4 Metabolism:
Tenofovir inhibits the activity of HIV reverse transcriptase by competing with the
natural substrate deoxyadenosine 5’-triphosphate and after incorporation into DNA by DNA
deoxynucleotides needed to synthesize the viral DNA and they compete with the natural
deoxynucleotides for incorporation into the growing viral DNA chain. However, unlike the
natural deoxynucleotides substrates, NRTIs and NtRTIs (nucleoside/tide reverse transcriptase
inhibitors) lack a 3'-hydroxyl group on the deoxyribose moiety. As a result, the next incoming
deoxynucleotide cannot form the next 5'-3' phosphodiester bond needed to extend the DNA
chain. Thus, when an NRTI or NtRTI is incorporated, viral DNA synthesis is halted, a process
known as chain termination. All NRTIs and NtRTIs are classified as competitive substrate
inhibitors.
2.5 Uses:
Tenofovir is used with other medications to help control HIV infection, thereby improving
quality of life. It helps to decrease the amount of HIV in body so immune system can work
better. It also lowers risk of getting HIV disease complications (such as new infections,
cancer). Tenofovir belongs to a class of drugs known as nucleotide reverse transcriptase
inhibitors (NRTIs).Tenofovir is not a cure for HIV and it does not prevent the spread of HIV
to others through sexual contact or blood contamination (such as sharing used needles).
Tenofovir is also used to treat a certain type of liver infection called chronic hepatitis B
infection. It helps to decrease the amount of hepatitis B virus in body by interfering with
3. REVIEW OF LITERATURE
Kandagal P.B et al[6]
, 2008 reported A simple reverse-phase high-performance liquid
chromatographic method for the determination of tenofovir disoproxil fumarate (TDF) in
pharmaceutical formulations and human plasma samples. Piroxicam (PRX) was used as an
internal standard. The assay of the drug was performed on a CLC C18 (5 µ, 25 cm x 4.6 mm
i.d.) with UV detection at 259 nm. The mobile phase consisted of acetonitrile-water mixture
in the ratio of 75:25 and a flow rate of 1 ml/min was maintained. The standard curve was
linear over the range of 0.2-10 µg/ml (r2
= 0.9966). Analytic parameters have been evaluated.
Within-day and between day precision as expressed by relative standard deviation was found
to be less than 2%. The method has been applied successfully for the determination of TDF in
spiked human plasma samples and pharmaceutical formulations.
Rezk NL et al[7]
,2005 described an accurate, sensitive and simple reverse-phase (RP)
high-performance liquid chromatography (HPLC) method for the simultaneous quantitative
determination of emtricitabine and tenofovir in human blood plasma is described. Using 200
µl of plasma and BOND ELUT-C18 Varian columns, the solid phase extraction (SPE) method
results in a clean baseline and high extraction efficiencies (100% for emtricitabine and 98.6%
for tenofovir). An Atlantis trade mark dC18 analytical column was used along with an 18 min
linear gradient elution of phosphate buffer (pH 5.7) and methanol to provide sharp peaks for
emtricitabine at 280 nm, tenofovir at 259 nm and for the internal standard 2',3'didoxyuridine
(DDU) at 262 nm. The method was validated over the range of 10-10,000 ng/ml for both
analytes, and was accurate (average accuracies of three different concentrations ranged from
98 to 105% for emtricitabine and 97 to 103% for tenofovir) and precise (within- and
between-day precision ranged from 1.7 to 3.7% and 3.7 to 5.2%, respectively). This method
could be suitable for use in clinical pharmacokinetic studies and is nimble enough for
therapeutic drug monitoring.
El Barkil M et al [8]
, 2003 developed a sensitive high-performance liquid chromatography
method coupled to UV and single mass spectrometry (MS) detection for the determination of
tenofovir in human plasma. A solid phase extraction procedure (Bond-Elut C18 Varian
cartridges) provided high extraction efficiency (91% for tenofovir and 68.8% for the internal
standard, 3-methylcytidine). An atlantis-dC18 analytical column was used with an isocratic
mode elution of a mixture (pH 2.5) of ammonium acetate/methanol (98.5:1.5, v/v). Detection
were validated over the range of 10-1000 ng/ml and were found to be linear, accurate and
precise. At the lowest limit of quantification, 10 ng/ml for UV and 5 ng/ ml for MS, the
average coefficient of variation was 6.9 and 3.9%, respectively. The potential of this validated
method for clinical studies was investigated by analysing more than 170 samples from
HIV-infected adult patients. A good correlation was observed between the results obtained with
both detectors. However, in several cases discordant results were observed between UV and
MS detections. Therefore, tenofovir could suffered from interferences using either UV or
single MS detection. They concluded that the double detection allowed to obtain a more
specific quantification of tenofovir. The present assay was sound and could be used for
therapeutic drug monitoring allowing a higher reliability of the results which are transmitted
to the medical team.
Jullien V et al, 2003[9]
developed a sensitive high-performance liquid chromatography
method with spectrofluorimetric detection for the determination of tenofovir in human
plasma. After precipitation of 200 µl of plasma samples by methanol and evaporation of the
supernatant, fluorescent derivatized compounds were obtained by a 40-min incubation at
80ºC with chloroacetaldehyde 0.34% at pH 4.5. The assay was performed isocratically using
5 mM Na2HPO4 (pH 6), containing tetrabutylammonium (TBA) chloride 5 mM, and
acetonitrile (85:15, v/v) as mobile phase and a Cluzeau C8 plus satisfaction column
maintained at 35ºC. Detection was performed at excitation and emission wavelengths set at
236 and 420 nm, respectively. In these conditions, tenofovir could be separated from
adefovir, the internal standard and endogenous substances. The method was found to be
linear and had been validated over a concentration range of 5-1000 µg/ml. The average
coefficient of the limit of quantification (5 µg/ml ) was 5.38% and at this concentration, a
signal-to-noise ratio of 500 was measured.
Sentenac S et al, 2006[10]
reported a new high-performance liquid chromatography assay for
the determination of tenofovir, a nucleotide analogue, in plasma. A solid-liquid extraction
procedure was coupled with a reversed-phase HPLC system. The mobile phase consisted
of Na2HPO4 buffer, tetrabutyl ammonium hydrogen sulfate and acetonitrile for different
elution through a C18 column with UV detection. This method proved to be accurate, precise
and linear between 10 and 4000 ng/ml. This method was applied to determine trough levels
of tenofovir in 11 HIV-infected patients with virologic failure under multiple antiretroviral
Delahunty T et al, 2005[11]
developed and validated an LC/MS/MS method for the
determination of tenofovir (TNF) with the beta anti coagulated human plasma matrix.
Heparin-treated plasma and serum matrices were also validated. After addition of adefovir as
an internal standard, trifluoroacetic acid was used to produce a protein-free extract.
Chromatographic separation was achieved with a Polar-RP Synergi, 2.0 mm x 150 mm,
reversed-phase analytical column. The mobile phase was 3% acetonitrile/1% acetic acid, aq.
Detection of TNF and the internal standard was achieved by ESI MS/MS in the positive ion
mode using 288/176 and 274/162 transitions, respectively. This method was linear from 10 to
750 ng/ml with a minimum quantifiable limit of 10 ng/ml when 250 microl aliquots were
analyzed. The usefulness of this LC/MS/MS method to routinely monitor plasma
concentrations of TNF was demonstrated along with its ability to assist in the performance of
pharmacokinetic studies.
Colombo S et al, 2006[12]
reported an HPLC method for the determination of the novel
non-peptidic HIV protease inhibitor tipranavir (TPV) in human plasma by off-line solid-phase
extraction (SPE) followed by HPLC coupled with UV-diode array detection (DAD). After
viral inactivation by heat, the plasma was diluted with phosphate buffer (pH 7) and subjected
to a SPE on a C18 cartridge. Matrix components were eliminated with a solution of 0.1%
H3PO4 solution neutralised to pH 7 and TPV was eluted with MeOH. The resulting eluate was
evaporated and reconstituted in 100 µl MeOH/H2O 50/50. A 40 µl volume was injected onto
a Nucleosil C18 AB column and TPV was analysed by UV detection at 201 nm using a
gradient elution program constituted of MeCN and phosphate buffer adjusted to pH 5.12 and
containing 0.02% sodium heptanesulfonate. The calibration curves were linear up to 75
µg/ml, with a lower limit of quantification of 0.125 microg/ml. The mean absolute recovery
of TPV is 77.1+/-4.0%. This method was precise with mean inter-day coefficient of variations
(CVs) within 2.2-3.4%, and accurate (range of inter-day deviations from 0.7 to 1.2%). This
method had been validated and is currently applied to the monitoring of TPV plasma levels in
HIV patients.
King T et al, 2007[13]
developed a LC -MS-MS method to facilitate the evaluation of drug
safety, virologic activity and pharmacokinetics. An anion exchange isolation of
tenofovir-diphosphate (TFV-DP) from human peripheral blood mononuclear cells (hPBMCs), coupled
with dephosphorylation, desaltation and detection was reported . hPBMCs were harvested
from whole blood, lysed and a suspension of intracellular tenofovir moieties was produced.
dephosphorylated with acid phosphatase to form TFV and then desalted and concentrated.
The lower limit of quantitation (LLOQ) of the method is 10 fmol per million cells with 5
million hPBMCs used.
Bennetto-Hood Cet al, 2009[14] repoted a sensitive and specific method for the quantitation
of tenofovir (TFV) in human plasma by liquid chromatography/electrospray ionization mass
spectrometry. Plasma samples were prepared by solid-phase extraction performed on Waters
Oasis cation-exchange cartridges (30 mg). Chromatographic separation was performed
isocratically on a reversed-phase Waters Atlantis dC18 column (2.0x100 mm, 3 mm). The
mobile phase consisted of a hydroxylamine/acetic acid buffer (pH 6.75) and methanol (93:7,
v/v). The acquisition was performed in selected ion monitoring mode for the protonated
molecular ions [M+H]+ of m/z 288.2 for TFV and 212.2 for the internal standard, zalcitibine.
This method was fully validated to determine its specificity, recovery, linearity and
sensitivity, accuracy and precision. The analytical range was set at 1-750 ng/ml using a 200
µl plasma sample with a mean coefficient of determination (r2) of 0.9969. The mean
accuracies for the calibration standards ranged from -5.0 to 4.3%, while the precisions were
within 1.2 and 6.4%. Intra-assay and inter-assay mean accuracies for three quality control
concentrations (2, 60, and 600 ng/ml) ranged from -6.1 to 10.7%, while the precisions were
within 1.3 and 9.1%. TFV was shown to be stable under normal storage and assay conditions;
no degradation was seen when stored at -20 degrees C or -80 degrees C for up to 6 months,
and after 16 h at room temperature in the injection matrix. The present method provided an
accurate, precise, and sensitive tool for TFV quantitation and was successfully applied to an
external proficiency-testing program and pharmacokinetic analysis.
Yadav M et al,2009[15]
developed a simple, specific, and high throughput liquid
chromatography tandem mass spectrometry method for the determination of tenofovir in
human plasma using adefovir as internal standard. Plasma samples were prepared by
solid-phase extraction of the analyte and internal standard using Waters Oasis MCX cartridges (1
cc, 30 mg). The chromatographic separation was achieved on a reversed-phase Chromolith,
C18 analytical column (100 mmx4.6 mm, 5 µm) under isocratic conditions. The mobile phase
consisted of 0.5% formic acid in water and acetonitrile (90:10, v/v) to give a run time of 1.8
min. The protonated precursor-->product ion transitions for tenofovir and IS were monitored
on a triple quadrupole mass spectrometer operating in the multiple reaction monitoring and
ng/ml was established using 0.2 ml plasma sample. The method was fully validated for its
sensitivity, selectivity, accuracy, precision, matrix effect, recovery, stability and dilution
integrity. It was applied to a bioequivalence study in 43 human subjects after oral
administration of 300 mg tablet formulation under fasting conditions.
Ahmed Z et al,2009[16]
developed and validated a simple, selective, linear, accurate and precise
RP-HPLC method for routine analysis of tenofovir disoproxil in bulk and in pharmaceutical
formulation. Isocratic elution at a flow rate of 1.0 mL/min was employed on a Thermo Hypersil
HIGH PURITY C18 reversed-phase column (150 mm x 2.1 mm i.d., 5 mu m) at ambient temperature.
The mobile phase consisted of acetonitrile and 0.05 M phosphate buffer pH 6.0 (50: 50, v/v). The UV
detection wavelength was 260 nm and 20 µl of sample was injected. The retention time for tenofovir
disoproxil was 4.45 min. The sensitivity, accuracy, precision, robustness, stability, specificity,
selectivity and system suitability parameters were validated for this method.
Guo J et al,2002[17]
reported a simple, specific, sensitive LC/MS/MS method for the
quantitation of tenofovir (TFV) in monkey plasma. After the addition of adefovir as an
internal standard (IS), methanol was used to produce a protein-free extract. Isocratic
chromatographic separation was performed on a reverse-phase Discovery C(18) column
(4.6×250 mm, 5 µm). The mobile phase consisted of methanol-water-formic acid (20 : 80 :
0.5, v/v/v). Detection of TFV and the IS was achieved with electrospray ionization
(ESI)-MS/MS in the positive ion mode using 288/176 and 274/162 transitions respectively. The
analytical range was set at 0.005-1.250 µg/ml using a 200 µl plasma sample. The intra- and
inter-day precision values were less than 11.4% and accuracy ranged from 0.4 to 2.9% in all
quality control samples. This method was fully validated for its sensitivity, selectivity,
accuracy, precision, matrix effect, recovery and stability. Due to the high polarity of TFV, the
major challenge was to circumvent ion suppression when quantitating the plasma
concentration of TFV using the LC/MS/MS method. Moreover, it was found that the
reconstitution solvents of the dried residue had a significant impact on LC peak shapes. This
validated method was successfully applied to a bioequivalence study in 6 monkeys after the
oral administration of two ester prodrugs of TFV (equivalent to TFV 20 mg/kg). This method
permitted laboratory scientists with access to the appropriate instrumentation to perform rapid
4. AIM AND PLAN OF THE STUDY
4.1 AIM AND SCOPE:
Tenofovir is relatively a newer antiretroviral drug and used in the treatment of HIV.
For quantification of Tenofovir in tablet formulation, very few HPLC methods were
available.
Hence the aim of present work is to develop simple and validated RPHPLC method
by isocratic mode for the quantification of Tenofovir in bulk and it’s formulation.
4.2 PLAN OF WORK:
The plan of present work is as follows:
Method Development
Selection of wavelength
Selection of initial separation conditions
Selection of mobile phase (pH, peak modifier, solvent strength, ratio
and flow rate)
Nature of the stationary phase
Selection of separation method and agent
Validation of the developed method
The developed method has to be validated by using the various validation
parameters such as,
Accuracy
Precision
Linearity and of detection (LOD) / Limit of quantitation (LOQ) Selectivity / Specify
5. METHODOLOGY
5.1 MATERIALS AND INSTRUMENTS USED
a) Drug samples:
Tenofovir pure drug sample was obtained from Hetero labs, Hyderabad and tablet
dosage form belongs to Ranbaxy pharma(Tentide - 300 mg).
b) Chemicals and Solvents used:
S. No Name Grade
1. Methanol Merck (HPLC Grade)
2. KH2PO4 HPLC Grade
3. Acetonitrile Merck (HPLC Grade)
4. Tetrahydrofuron AR grade
c) Instruments used:
S. No Name Model
1. HPLC Peak 7000
2. Digisun pH meter 2001
3. Eletronic balance ELB 300
4. UV Spectrophotometer 2201 UV-VIS
5.2 OPTIMIZATION OF CHROMATOGRAPHIC CONDITIONS FOR THE
ESTIMATION OF TENOFOVIR
The present work is for the development of the RP-HPLC method for the Tenofovir
and its validation.
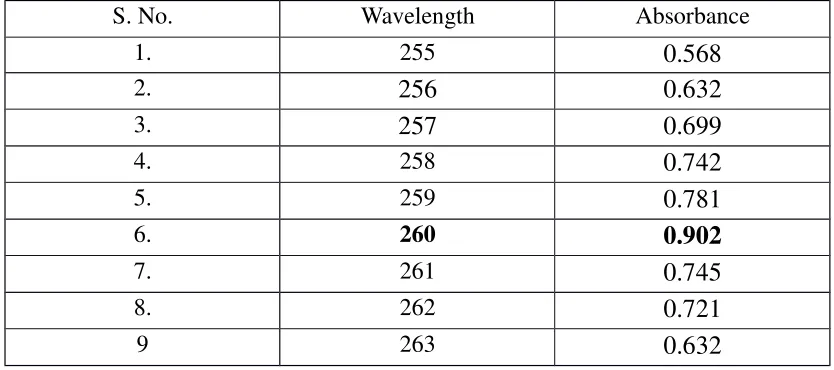
5.2.1 Selection of wavelength
An UV spectrum of 100µg/ml Tenofovir in methanol was recorded by scanning in the
range of 240 nm to 270 nm. From the absorbance data 260 nm was selected . At this
254 255 256 257 258 259 260 261 262 263 264 0 0.1 0.2 0.3 0.4 0.5 0.6 0.7 0.8 0.9 1
Fig 2: UV Absorbance graph.
Table 1: Data of Absorbance
S. No. Wavelength Absorbance
1. 255
0.568
2.
256
0.632
3.
257
0.699
4. 258
0.742
5. 259
0.781
6. 260
0.902
7. 261
0.745
8. 262
0.721
9 263
0.632
5.2.2 Selection of chromatographic method
Proper selection of the method depends upon the nature of the sample
(ionic,ionisable,neutral molecule), its molecular weight and solubility. The drug selected in
the present study is polar in nature and hence reverse phase or ion-pair or ion–exchange
chromatography method may be used. The reverse phase HPLC was selected for the initial
separations because of its simplicity and suitability.
Initial separation conditions
[image:40.595.89.506.367.552.2]Equipment
System : PEAK7000 isocratic HPLC
Pump : PEAK 7000 delivery system
Detector : Diode array detector
Injector : Rheodyne 7725i with 20 µl loop
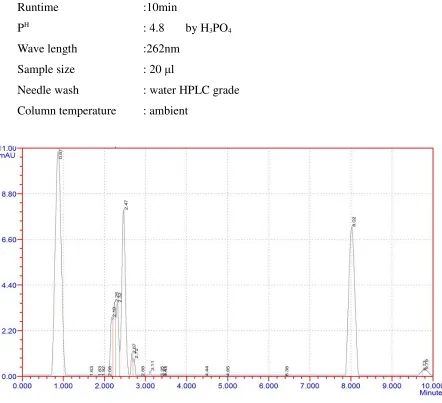
Trail 1:
Chromatographic conditions:
Mobile phase
:Methanol: Acetonitrile (50+50)Column :C18 250 x 4.6mm
Flow rate :1.0ml/min
Runtime :10min
PH
: 4.8 by H3PO4
Wave length :262nm
Sample size : 20 µl
Needle wash : water HPLC grade
[image:41.595.76.518.281.684.2]Column temperature : ambient
Fig 3: trail 1
Observation: There was no proper separation and merging of peaks was appeared.
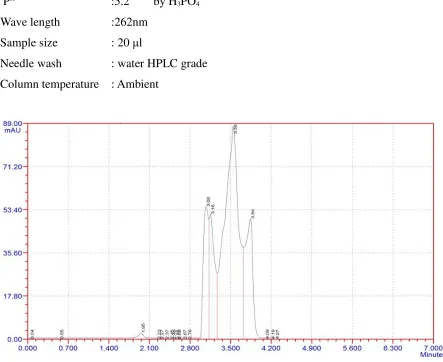
Trial 2:
Mobile phase :Methanol: Water (90+10)
Column :C18 250 x 4.6mm
Flow rate :1.0ml/min
Runtime :10min
PH
:5.2 by H3PO4
Wave length :262nm
Sample size : 20 µl
Needle wash : water HPLC grade
[image:42.595.72.515.161.523.2]Column temperature : Ambient
Fig 4: trail 2
Observation: merging and no symmetry of peaks.
Trial 3:
Chromatographic conditions:
Mobile phase : Methanol: KH2Po4 (0.01M) (50+50)
Column : C18 250 x 4.6mm
Flow rate : 1.0ml/min
Runtime : 7min
PH
: 5.6 by H3PO4
Needle wash : water HPLC grade
[image:43.595.75.518.137.396.2]Column temperature : ambient
Fig 5: trail 3
Observation: merging of peaks and no proper peak
Trial 4:
Chromatographic conditions:
Mobile phase :Methanol: KH2Po4 (0.01M): Acetonitrile (50+25+25)
Column :C18 250 x 4.6mm
Flow rate :1.0ml/min
Runtime :6 min
PH
:4.9 by H3PO4
Wave length :260nm
Sample size : 20 µl
Needle wash : water HPLC grade
Fig 6: trail 4
Observation: Symmetrical Peak was not observed.
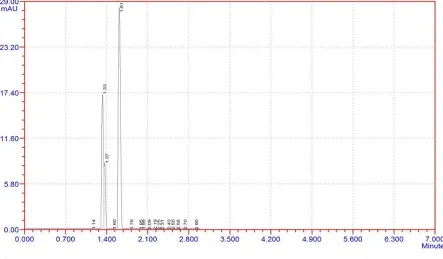
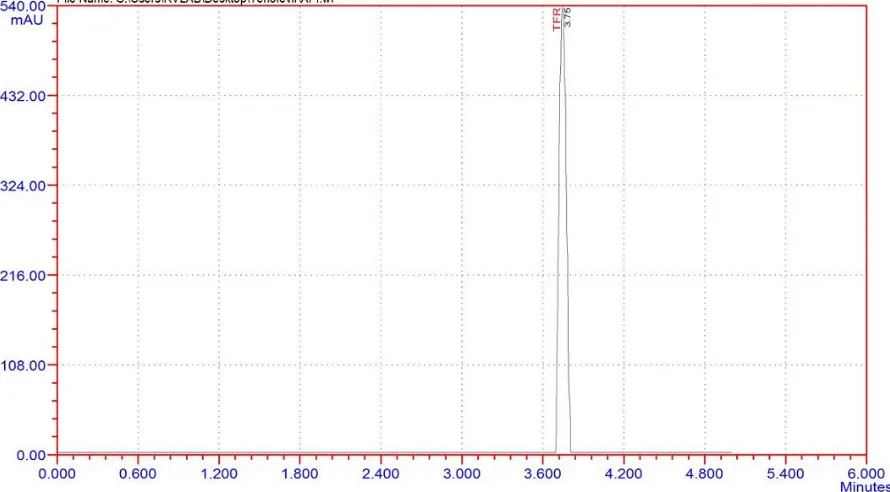
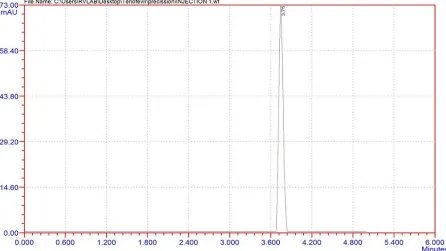
OPTIMIZED METHOD
Fixed chromatographic condition:
Detection: 260 nm
Mobile phase: Methanol: kH2PO4 (0.01M):THF: Acetonitrile (55+10+5+30)
Stationary phase: C18 250 x 4.6mm
Flow rate: 1.2ml/min
Runtime: 10min
Retention time: 3.7 min
PH
: 5.5 by H3PO4
Sample size: 20 µl
Needle wash : water HPLC grade
Fig 7: Fixed Chromatographic Condition
Observation:
Peak shape was good, theoretical plates were good and asymmetry was within the limit.
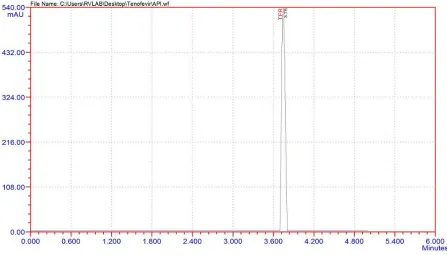
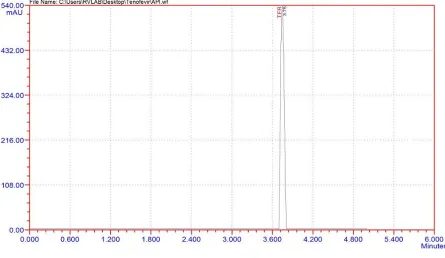
5.3 QUANTIFICATION STUDY
Preparation of Standard Solution:
1 gram of TENOFEVIR A.P.I. (pure drug form) was taken and dissolved in methanol
and finally made the volume to 100ml in volumetric flask with methanol. Then it was
suitably diluted with methanol to produce final drug concentration of 100µg/ml.
Preparation of Sample Solution:
The formulation tablets of Tenofevir (Tentide - 300 mg) were crushed to give finely
powdered material. Then tablet powder equivalent to 100 mg of tenofovir was transferred
into 100 ml flask and volume was made up with mobile phase and filtered through Ultipor
N66 Nylon 6, 6 membrane sample filter paper. Filtrate was suitably