CLINICOSOCIAL PROFILE OF PATIENTS WITH LEPROSY ACCESSING A TERTIARY CARE HOSPITAL IN THE ERA OF
ELIMINATION
Clinicosocial profile of patients with leprosy accessing a tertiary care hospital in the era of elimination
A DISSERTATION SUBMITTED IN PARTIAL FULFILLMENT OF THE RULES AND REGULATIONS FOR THE MD BRANCH XII A, DERMATOLOGY, VENEREOLOGY AND LEPROSY EXAMINATION OF THE
CERTIFICATE
This is to certify that the dissertation titled 'Clinicosocial Profile of patients with leprosy accessing a tertiary care centre in the era of elimination' is the bonafide work of Dr. Renita, L. in fulfillment of rules and regulations for the M.D., Branch XII A, Dermatology, Venereology and Leprosy Examination of the Tamil Nadu Dr. M. G. R. University, to be held in 2007.
Dr. Susanne A Pulimood
Professor and Head Of Department
Department of Dermatology, Venereology and Leprosy, Christian Medical College,
Vellore – 632004.
ACKNOWLEDGEMENTS
I extend my gratitude to my guide, Dr Susanne A Pulimood for meticulously guiding me through this entire project.
I thank my co-guides, Dr Renu George, Dr Jayaprakash Muliyil, Dr K R John, Dr K S Jacob, and Dr Pushpa Eapen for their valuable inputs in this study.
I extend my sincere thanks to Mr. Solomon, my statistician and all my colleagues who helped with the translations.
I thank the patients for their participation and co operation.
INTRODUCTION
The recently published data on leprosy shows that the disease is in the final stages of elimination as a public health problem. The case load has fallen by around 90% in the past 2 decades;1,2 the number of countries with prevalence above elimination levels has fallen from 122 in the mid eighties to just 9 at the beginning of 2005.3 At the national level, the disability rate is low,2,4 the New Case Detection Rate (NCDR) is showing a declining trend 4-11 and most importantly, India joined the ranks of countries which have achieved a prevalence rate of less than 1/10,000 population in December 2005.12 Integration of leprosy services into the general health services has been completed,13 with the resultant availability of early and appropriate medical care by adequately qualified and sufficiently trained physicians, to all patients in need of it, at the first instance of approaching the health care system.
the patients not identified by the present health care system. The bacillary status of newly diagnosed patients, would give a rough idea of the levels of contagion in the community. The non economic burden of the disease has the following components – impairment, disability and handicap or participation restriction. The disability grade, Screening of Activity Limitation and Safety Awareness (SALSA) scale,14 Participation scale(P scale)15 and the General Health Questionnaire 12(GHQ 12) when considered together can be said to account for measurement of the non economic burden of disease.16 One published study is available on the SALSA,14 two on the P scale15,17 and several are in progress using both. We wanted to evaluate the suitability of these two new scales, when used in a clinic based setting, for the assessment of activity and participation limitation, parameters very relevant even in the era of elimination and integration.
This is an opportunity to study the experiences of patients with their disease and thus with the health care system in view of elimination and integration, and will give us insights that may help in the delivery of better care.
AIMS OF THE STUDY
1. To study the socio-demographic and the clinical profile of patients with leprosy, accessing a tertiary care centre and to assess their disability status.
2. To study the health care utilization pattern and its consequences. 3. To assess the following parameters:
(a) the level of activity limitation and safety awareness using the SALSA scale. (b) the level of participation restriction using the P scale.
LITERATURE REVIEW
Introduction:
Leprosy is a chronic infectious disease caused by Mycobacterium leprae; it usually affects the skin and the peripheral nerves, but has a wide range of clinical manifestations. M. leprae is spread from person to person, primarily as a droplet nasal infection. The incubation period is generally 5 – 7 years, the peak age at onset is young adulthood, usually 20 –30 years.1
History of leprosy:
The first recognizable report of leprosy was written in the middle of the second century, AD.18 Though the bacterium was discovered in 1873, potentially effective therapies came into being only in the 1920s. Dapsone was introduced in 1949, and the multi drug therapy as in current usage came into being in 1982.19 While humans are considered to be the major host and reservoir of M. leprae, other animal sources, like the armadillo have been incriminated as reservoirs of infection. There is no evidence to suggest an association between leprosy and HIV infection. BCG vaccination is known to have some protective value against leprosy.1
Figure 1: Prevalence of leprosy in India.
The Prevalence Rate 1.06 per ten thousand population
MB Proportion 45.83% of new case detected
Female Proportion 32.67% of new case detected
Child Proportion 10.19% of new cases detected
Epidemiology and current statistics:
As on the first of April 2005, the South-East Asia Region (SEAR) is the only region where the leprosy prevalence is above the elimination goal of one case per 10,000. Leprosy in the SEAR countries contributes to 69% of the global prevalence and 81% of the total newly detected cases. In the region, three countries were still having a prevalence rate (PR) above the elimination goal: India (PR: 1.34), Nepal (PR: 1.9), and Timor Leste (PR: 4.7). India alone represents 80% of prevalence and 88% of new detected cases in the SEAR.5 With India achieving elimination in December 200512, the SEAR is also expected to achieve elimination.3 The NCDR as of April 2005 was 2.34.4 The national statistics as of November 2005 are shown in Fig. 1. The prevalence rate is 1.06/10,000, 45.83% of the newly detected cases are multibacillary and children constitute 10.19% of new cases. Women form 32.67% of all cases. The proportion of patients with grade 2 disability is 1.69 % of new cases detected.5
Importance of the NCDR :
Vijayakumaran et al30 reported no change in NCDR. It remains to be seen whether this trend will be sustained.21
Many researchers have attributed the fall in prevalence to operational factors and policy definitions rather than to any breakthrough achievement in control of transmission .27 In a study from Chattisgarh, Pandey et al31 showed that not only had the NCDR remained static, but that a higher proportion of newly diagnosed cases were likely to be in the MB spectrum, with attendant higher risk of transmission. Also, there was a higher proportion of patients with grade 2 deformity.31 Similar results were seen in recent studies evaluating the proportion of MB cases among newly detected cases from TamilNadu,6,10 Andhra Pradesh8 and Orissa.7 This is suggestive of both ongoing transmission and delayed presentation.31
Integration:
Integration means active involvement of the general health services in leprosy control activities. The rationale behind this is that the general health services are widely distributed and have close and frequent contact with the local community, and involving them in leprosy control will improve case finding, case- holding and the awareness of the local community about the disease. In short, integration will improve efficiency and effectiveness, optimize the use of resources, promote greater equity, reduce stigma and discrimination and ensure long- term sustainability.1,2
process; in Colombia, it almost collapsed. There were difficulties in transit towards integration, especially when essential requirements were not in place.33 It has been found that in chronic diseases like leprosy and tuberculosis, adherence to therapy is poor.2,34 While MDT coverage is increasing, decentralization in the forms of accompanied MDT, though operationally simple, may prove detrimental to the patient in the long run.34 If programmes are allowed to slacken prematurely, there may be a resurgence of disease.35 In an analysis from Sri Lanka looking at the case detection profile after integration of leprosy care into general health services, it was found that minor public facilities were being bypassed , although, ideally, they should have been the starting point of health care.36 Though integration into primary heath care is beneficial and has been completed in India,13 leprosy surveillance and post elimination strategies should be in place, so that the individual leprosy patient is not sacrificed for the benefit of the many.37
Utilization profile:
Delays in presentation and treatment:
The WHO recognizes the importance of early detection and effective treatment as the keys to breaking the chain of transmission and eliminating leprosy.41,42 Delay in diagnosis and start of treatment is defined as the time taken from first being aware of the symptoms of the disease through to the start of effective treatment.26,41 It can be divided into physician or health care system related and patient related. It is good neither for the patient because of the risk of adverse consequences, nor for the community because of the risk of prolonged transmission.22,43,44 Available data suggests that the delay should not be longer than 6 months.26,
43
In a study from Brazil, it was found that 71% had a delay of 7 months or more and it was significantly associated with nerve function impairment.45 It has been found that under-diagnosis is more common among the borderline lepromatous or lepromatous group.22
10 months.53 This draws attention to the need for better and specific training, especially in the context of integration.2,53 Delay in referral was a very existent problem, with a range of 1- 12 months and this depends upon the knowledge and skills of the physician in the early diagnosis of leprosy. 54
Factors associated with risk of delay:
The best way to prevent impairments is with early case detection, implying lesser delays.38,43,44,54-56 In a study by P.G. Nicholls et al,41 from West Bengal and Bangladesh, repeated contacts with health services contributed to delay. They identified those at risk as individuals aged over 35 years and those continuing to rely on traditional or alternative treatments. Men aged 35 years and above had a mean delay of 24.2 months, while those aged below 35 years had a mean delay of 18.8 months in Bangladesh, while the corresponding figures from Purulia were 18 and 15 months respectively. The corresponding values for women were 35.5 and 16.1 from Bangladesh and 23 and 25 from Purulia respectively.41 Women had a longer delay(63.8 months) as compared to men(41.2 months) in a study from Maharashtra.48
months between onset of symptom to diagnosis.43 Illiteracy was associated with delay49 and patients with better literacy tended to seek consultation early.46
In a study by Kumar and Anbalagan,46 from Chingleput in 1980-81, it was found that 73.33% of the study population tended to change their medical agencies , an average of 2.6 times. This tendency to change was found to be related to the severity and duration of disease, and to the male sex.46 In a study from Nigeria, patients paid an average of 2.7 visits to the doctor before leprosy was diagnosed.53
Role of awareness in determining the utilization profile:
Education and improving awareness levels can go a long way toward improving adherence and prevention of disability.38,40,58,60,61
Importance of following up patients with impairments, active or treated:
The utilization pattern of leprosy patients needs to improve with regard to the disease and the primary and the secondary impairments, preferably at the first point of contact with the health services, because a delayed detection rate will only lead to increased deformities. Though the number of cases on the rolls may have come down with the introduction of MDT and now, fixed duration(FD) MDT, the work load may not decrease because many patients will need continued care, support and counselling.62,63 Croft et al64 found that patients with PB leprosy and no nerve function loss had a 1.3% risk of developing nerve function impairment(NFI) within 2 years of registration. Patients with PB leprosy with nerve function loss or MB leprosy without nerve function loss had a 16% risk. Patients with MB leprosy and nerve function loss at presentation had a 65% chance of developing new NFI within 2 years of registration. These groups were classified as low, intermediate and high risk, depending upon the possibility of developing a NFI. They suggested that follow up of patients after release from treatment be done as follows: patients in the low risk group need no follow up beyond the course of their chemotherapy, intermediate risk patients need to be followed up for 1 year, and the high risk group should have at least 2 years of surveillance for new NFI.64
Contacts:
improve the utilization profile of the cases detected from among contacts who constitute a significantly large group, considering that the proportion of patients who have known leprosy contacts may be as high as 45%.68
Impact of leprosy on the economic status of the patient:
The current leprosy elimination strategies focus almost exclusively on delivery of leprosy diagnostic services and MDT; however, the specific problems of people newly diagnosed with leprosy or cured with MDT primarily relate to nerve function impairment and to the social and the economic consequences of the diagnosis of leprosy.69 Leprosy related impairments and stigma may rapidly lead to unemployment, community dislocation and destitution. The percent of dehabilitation is equal to the degree of disability and intensity of social stigma.70-72
Loss of income and other indirect economic losses:
take a loan to meet the medical expenses. 45.78% of patients spent between Rs.100 to Rs.10000 for their treatment.
Employment issues:
When employers were questioned about their reservations regarding appointing leprosy patients, the prime reason for a negative attitude towards employing leprosy patients was functional- that "the candidate would be unable to do the job".76
In a study by Withington et al,69 it was found that the following factors were found to be associated with nerve function impairment: manual occupations, status as beggar or day labourer, presence of dependants, MB disease and paradoxically, higher income groups.
Cost measurement:
Costs of MDT:
The cost of MDT in 1985 was pegged at US $6.00 per paucibacillary patient and the cost of MBMDT at US $26.00 per year. 63 Revankar in 1986 calculated the cost of MDT . WHO MB (adult) was found to cost Rs.359.00 and WHO MB (child) Rs.179.50 per year. For PB MDT, the costs were Rs.28 for an adult and Rs.14 for PB (Child) per patient. This study compared the then existing regimes of antileprosy drugs: Isoprodian-R(German Leprosy relief association), Isoprodian – Rifampicin(Borstel), WHO- ILEP, and IAL(Indian association of Leprologists) and found the WHO ILEP regimen most cost effective.78 The costs due to drugs alone would account for 10 – 20 % of the overall expenditure of a leprosy control programme.78
Need for socioeconomic rehabilitation:
Provision of socio economic rehabilitation assistance is not inexpensive. Adding a socio economic dimension to leprosy services may undermine already stretched diagnostic and treatment services, whose staff, generally do not have the training, time or resources to consider such issues. However, if neglected, these issues can potentially increase costs in the long run. Potential benefits will include decreasing rates of re admission to hospital, decrease in disabilities, and the wider benefits of socio economic development for this very vulnerable group.69
Disability grading:
this rate was 5.96% for India, 6.4% for the SEAR, and 7.3% globally.79 Early detection of nerve function impairment is vital for prevention of disability.43,44,54,55,64
WHO disability grading:
The WHO has advocated a disability grading for use in leprosy since 1960 with one of the aims being to assess the disability burden attributable to leprosy in the community so as to plan necessary action. Suggestions for proper usage of this grading system have been put forth.79,81 In the International Classification of Impairments, Disability and Handicap, impairments are defined as problems in body function or structure such as significant deviation or loss.81,82 A deformity is a structural, usually visible, impairment. A defect could be either a structural or functional impairment. Disability is defined as any restriction or lack of ability to perform an activity in the manner considered normal.79-81 Although from the current definitions, it is evident that the WHO disability grading system grades impairments rather than the overall disability status of a patient,81,83 its strength lies in its widespread use and hence comparability.84
Prognostic factors for nerve function impairment:
population and the national prevalences.55,80,86 In a recent study at a tertiary care hospital , the JALMA, Agra, the disability rate was 40% and this included grade1(18%) and grade 2(22%).52 Pimentel et al45 from Brazil found a similar proportion of grade 2 disabilities, though 33.67% had a grade 1 disability. In this study, based in a tertiary care centre, multibacillary patients were followed up for a mean period of 65 months for nerve function impairment, and it was found that the grade 2 impairments, had decreased to 20.39% at the end of follow up. The occurrence of overt neuritis was seen in 34% of patients during treatment and 45% during follow up with relative risk for developing NFI of 1.76 and 1.80 respectively.45 Males have been found to have higher deformity rates compared to females(8.9% in males and 2% in females) in a study from JALMA.52
Disability assessment, activity limitation and its impact on the patient:
Chen Shumin et al88 assessed problems in self care, daily activity, productive activity and social participation. The patients were asked one question on each of the above domains with 3 possible responses corresponding to the level of difficulty. 3.2% had great difficulty in self care, and 5. 6% in daily activities. However, 22.7% had some problems in self care while 28.3% had some problems in daily activity. The rest had no problems. 88
SALSA:14
The SALSA was developed between 2000 and 2002 as a standardized tool to measure the activity limitation and the safety awareness encountered by people affected by leprosy, diabetes and peripheral neuropathy in both low income and developed areas. This instrument has been developed by experts in the field with special emphasis on cohorts of leprosy patients.
It can be administered in less than 10 minutes and can provide a standardized measure of activity limitation. It examines activity limitation directly- what respondents consider they can or cannot do, or can do with difficulty. It also indicates the degree of restriction of activities because of their awareness of risk of injury. Thus, it can be a tool for the health workers to make sure that the level of avoidance behavior exhibited by the patient is appropriate.
varied from 10 – 75 with a mean of 32 and a median of 27. There was an increase with age. The safety awareness score is calculated by counting all the 4s which are circled, as instructed in the user manual. The association of the SALSA score with the EHF impairment score was strong. Mean SALSA scores increased from 23 in the group without impairments to 44 in the group with the highest impairment scores.
The SALSA user manual recommends its use in combination with impairment and participation restriction assessments .
Handicap or participation limitation:
In some cases a mere diagnosis of leprosy is sufficient handicap for the affected person, even when there is no disability.20 The initial despair may lead to depression in some and aggression in the others.90 It is the perceptions that people have about leprosy rather than the disease itself that significantly influences their attitude towards leprosy and leprosy patients.20,49,71,72,91 Several studies have shown that patient awareness regarding leprosy is low, both in India and globally.49,57,59,92-94 This low level of awareness in patients leads to unnecessary restrictions.95 However, Pal and Girdhar present conflicting evidence, based on their study of 307 patients from among the out patients attending JALMA, Agra.96 A study from Delhi placed awareness at only 60 % in 2003, more than a decade after the arrival of MDT.91 However, another study done in 2003 was encouraging in that it showed a high level of acceptance of patients by their families; in fact patients felt that the community was not concerned as long as there was no ulcer or deformity due to leprosy.97 A study by Tsutsumi et al,98 opined that though society might appear to have come to accept leprosy patients, this acceptance was only superficial and patients still suffered from feelings of isolation.
In a study by Kopparty, 57 % of patients experienced their deformity as a handicap which caused social and economical problems while the rest did not. 82% of families accepted deformed patients who did not have any handicap. However, if patients were both deformed and handicapped only 64% of families accepted them. 99
The Participation Scale ( P scale):
better results are likely to be achieved in rehabilitation programmes if special attention is given to clients’ opinions and ideas, which are rarely included in the feedback.100,101
The P scale has been used in one study concerned with evaluating the effectiveness of intervention programmes to reduce participation limitation.17
Risk factors for participation limitation:
In a multi-centre study by PG Nicholls et al,102 risk factors for increased participation restriction included being hospitalized at diagnosis, stress at diagnosis, needing to practice self care at home, fearing abandonment, knowing that leprosy may be transmitted to others and suffering from another disease, while having family members previously affected by leprosy and knowing that leprosy is curable led to decreased participation restriction. Education was an important issue with individuals without any education experiencing more participation restriction than those with 6 or more years of education.102
Gender differences in participation and stigma:
treatment.95,104 Most of the health care workers being men , they considered the women inferior, in line with existent social norms.95
Role of health care variables:
Side effects of anti leprosy medication were perceived as triggers to exposure and increased people’s fear of stigmatisation, along with the fear of exposure. Visible symptoms, monthly visits to the health post, blister-pack with the medicines, and for some, their skin turning black due to clofazimine were all occurrences that they wanted to hide and were seen as triggers that could lead to exposure and thus endanger their social position within the family and the community.38 The attitude of the health care workers was an important issue.95,104 Jopling stresses that availability of MDT is the key to reduction of stigma.90 Brandsma et al105 claim that widespread use of MDT along with improved leprosy control measures have led to decrease in stigma and to the number of people presenting with grade 2 disabilities.
Interviews on awareness of their disease and its symptoms, can serve as a means of action in themselves and hence are to be considered a step in the right direction. Patients, given the opportunity to express their opinions, gain a sense of awareness that they have the ability or power to improve their status.101
Mental health status in leprosy:
that it categorizes personality disorders as impairment due to leprosy. This creates the impression that leprosy affects one’s mental function, a fact that is not supported by scientific evidence.20 Impairments are interpreted as negative perceptions by the patient. As a result, the patients develops negative expectations of himself with respect to life.89, 106 This is likely to create a variety of emotions including anxiety, fear and depression.57,107-109 Depression was the most common followed by anxiety neurosis.107 Denial of the disease is related to feelings of insecurity and can thus be a strong contributing factor to non adherence of treatment.38 Eventually, the patient loses self esteem and may beome withdrawn or adopt negative behavior.20,80 A variety of emotions are intensely experienced by patients with grief at the diagnosis appearing to be the strongest and the most general reaction.106 The diagnosis of leprosy came as a severe shock to the patients.101
As early as 1980, a study from this center found that the prevalence rate of psychiatric disturbance among leprosy patients was 99 per 1000, which was significantly higher than the prevalence in the general population.110 Prevalence of mental distress over the previous one month was studied by Leekassa et al.111 This study from Ethiopia found that mental distress was higher in patients with leprosy as compared to those without leprosy with an odds ratio of 7.14. Among leprosy patients, 18.5% had suicidal ideation over the previous 1 month as compared to 6.3% of non leprosy patients.111 The psychiatric morbidity was shown to increase with increasing disability grades in a study from Bangladesh.98
and 65% with a higher EHF score in a study from Ethiopia.111 Psychiatric disturbances were seen in 63.3% of deformed patients as compared to 36.7% of non deformed patients, in a study from Tamil Nadu.110
Studies confirm that corrective surgical procedures decrease psychiatric morbidity and recommend corrective surgery as part of rehabilitation.108,112 Also it was found that patients with increased emotional lability were more likely to default on treatment and in the days of dapsone monotherapy, this was presumed to be one of the causes for the development of dapsone resistance.113 It has been suggested that it is not only the patient, but also the family that needs psychological help. Mass education and psychiatric counseling should be offered in needy cases.57
The GHQ 12 [General Health Questionnaire 12] ( Goldberg 1972):
appetite loss(76.6%) were more in patients with leprosy , while somatic symptoms, suicidal ideas and attempts were more in psoriasis. 96.7% of leprosy and 100 % of psoriasis patients had depression. However, once psychiatrically morbid, patients with leprosy were more significantly ill than those with psoriasis.109 John et al114 used the ICD 10 criteria for validation of the Tamil version of the GHQ 12, and found that at a cut off of 2/3 the sensitivity was 97.0% and a specificity of 55.7%.
Psychiatric co-morbidity was found to be very common among displaced leprosy patients who faced rejection by their family and the community.107 The provision of appropriate mental care and a programme to decrease discriminative actions against leprosy patients are essential to improve their mental status.98
MATERIALS AND METHODS
Setting :
Department of Dermatology, Venereology and Leprosy, Christian Medical College, Vellore.
Study design:
Cross sectional descriptive study.
Duration of study:
January 2005 to June 2006.
Study population:
All patients with leprosy accessing the out patient clinic, Department of Dermatology, Venereology and Leprosy, Christian Medical College, were eligible for inclusion in the study.
Inclusion criteria:
Exclusion criteria:
♦ Patients who had been diagnosed and / or treated at Christian Medical College, earlier.
♦ Those unwilling to participate in the study.
The proforma included information on the demographic details of the patient, the diagnosis and the clinical features, past history, history of contact with leprosy and disability status.(Annexure 1A) The number of patches and nerves were considered, and the patient classified as multibacillary(MB) or paucibacillary(PB) as per NLEP guidelines.116 Though the diagnosis of leprosy and classification into active and treated cases were primarily clinical, all patients had their skin smears tested. In doubtful cases a skin or nerve biopsy was done to classify the disease.
WHO disability grading :81, 117
The WHO grading was done as follows:
GRADE DEGREE OF IMPAIRMENT Hands and feet
0 No anesthesia, no visible deformity or change.
1 Anesthesia present but no visible deformity or change. 2 Visible deformity or damage present.
Eyes
1 Eye problems due to leprosy present but vision not severely affected. 2 Severe visual impairment, vision <6 /60, not able to count fingers at 6 m.
The WHO disability grade was the highest grade seen in either eye, hand or feet assessment. The minimum score was 0 and the maximum, 2. Semmes-Weinstein filaments were used for detecting sensory loss over the palms and the soles and voluntary muscle testing was done using the Medical Research Council(MRC) scale as per recommended guidelines.81, 118
Informed consent was obtained from the patients (or their guardians in the case of patients aged 15 years or less) before assessment of the parameters detailed below.(Annexure 2) Patients aged 15 years or less, were excluded from assessment of activity and participation limitation and mental health status. Newly diagnosed patients were also excluded from the above assessments unless they were able to return after a period of 4 weeks from the time of diagnosis, for administration of the scales. Patients who were not conversant in at least one of the following languages, namely English, Tamil, Hindi or Bengali were not administered the above scales.
Utilization profile:
and treatment, were taken to account for physician or health care system based delay. The overall delay was the sum of the above two components. These details were traced as accurately as possible, subject to patient’s recall as follows. The contacts with the health care system were noted and the total number of physician patient contacts summed up. Any instance of seeking alternative medicine was also recorded. In patients who have been released from treatment(RFT), details of self medication, and any symptoms post RFT were recorded in the proforma.
Economic Burden:
The costs of medical care were traced and the cost incurred over the previous year was noted (to minimize recall bias).
Total cost = direct medical + direct non-medical + indirect cost.
Non medical costs = money spent in having to hire a helper, family care giving, cost of transport, stay, food for patient and helper.
Direct medical costs = doctor fees, medication costs, investigation and procedure charges Indirect costs = losses due to sick leave, change or loss of job.77
Details concerning the patient’s income, occupation and the type of housing were entered in the proforma.
P scale:15, 17
The P scale was also administered by the principal investigator in the out patient clinic in the patient's vernacular. The scores are interpreted as follows :
23 – 32 : Moderate restriction 33 – 52 : Severe restriction 53 – 90 : Extreme restriction (Annexure 3)
SALSA:14
The SALSA was administered by the principal investigator in the out patient clinic in the language they were most familiar with, and responses were marked in the SALSA scoring sheet and the total score summed up. The circled 4s were added up to give the safety awareness score(Annexure 4).
Mental health impairment:
The GHQ 12107, 109, 115 was used for screening for depression and the ICD 10 criteria were then applied to confirm a diagnosis of depression. These were administered on different days to avoid patient fatigue and repetition of similar questions. In patients who were unable to return for administration of the second scale, the details of the second scale was unavailable for analysis. The 4 responses of the GHQ 12 were marked as follows:0,0,1,1 respectively. For the ICD 10 criteria , both mandatory and at least 2 of the additional criteria were required to be met to diagnose a case of depression.119 (Annexure 5 & 6).
Translations of the P scale, the SALSA and the GHQ 12:
translation into the vernacular and the back translation was done by medical professionals familiar with the concepts considered in the scales, viz participation , disability, mental health status etc, and fluent in the languages into which the scales needed to be translated. A discussion between the translators and the back translators was held to ensure that the translation is satisfactory and to resolve differences to arrive at a final translation. The Tamil version of the GHQ 12 was obtained from Mental Health Centre, Christian Medical College, Vellore, and the Tamil version of the P scale from Scheiffelin Leprosy Research and Training Centre, Karigiri, Tamil Nadu. The Hindi version of the SALSA scale was obtained with permission from the SALSA Collaborative group through Dr. Johann Velema.
Sample size :
All the patients who sought care at Christian Medical College for leprosy for the first time, during the study period, were eligible for inclusion in the study. Consecutive patients who fulfilled the relevant inclusion criteria were included. Patients who gave informed consent to participate in the interview were chosen and the scales administered to them over 2 days to avoid patient fatigue. Patients who could not stay back for the interviews due to time constraints, were lost to inclusion.
Statistical methods:
variance, though Mann- Whitney test and Kruskal- Wallis tests were used when the required assumptions were not met.
Institutional Research Committee approval:
RESULTS
PROFILE OF THE CLINIC ATTENDEES:
The total number of all new patients registered at the Department of Dermatology, during the year 2005 was 7927, with 4773 males and 3154 females. The total number of patients with leprosy seen in Dermatology OPD during the study period was 198.
Socio demographic profile: Age and sex distribution:
Of these 198 patients, there were 162 (81.8%) males and 36 (18.2%) females. The youngest patient was 3 years old and the oldest 83, with a median age of 35 years. The mean age was 37.03 (± 14.353). The age and sex distribution of patients are shown in Fig. 2.
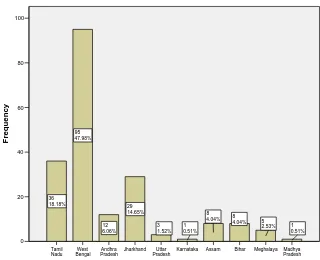
Distribution of patients according to state:
Figure 2: Age and sex distribution of the clinic attendees. 81-90 71- 80 61- 70 51-60 41-50 31-40 21- 30 11-20 0 - 10
Age in years
60 50 40 30 20 10 0 Frequency 1 0.51% 6 3.03% 6 3.03% 8 4.04% 9 4.55% 3 1.52% 3 1.52% 1 0.51% 2 1.01% 12 6.06% 14 7.07% 26 13.13% 44 22.22% 52 26.26% 10 5.05% 1 0.51% Female Male sex Figure 3: Distribution of the clinic attendees according to state.
[image:38.612.79.399.439.699.2]Disease characteristics: Duration since onset of illness:
The mean duration since onset of disease was 74.35 (± 97.257) months, with a
median of 36 months, maximum of 624 months and a minimum of 0. However, this maximum number represented a newly diagnosed patient who presented with an unrelated dermatological complaint, and excluding him, the range was 480 months and the mean duration was 71.50 (± 89.031) months.
Disease spectrum, diagnosis and presenting symptom:
Table 1: Diagnoses of the clinic attendees.
Diagnosis All patients n(%) Newly diagnosed cases n(%) Treated, could not be classified 36(18.2) 0
Tuberculoid 13(6.6) 0
Borderline tuberculoid 68(34.3) 16(45.7)
Borderline 5(2.5) 0
Borderline lepromatous 25(12.6) 3(8.6)
Lepromatous 34(17.2) 13(37.1)
Pure neuritic 17(8.6) 3(8.6)
Total 198(100) 35(100)
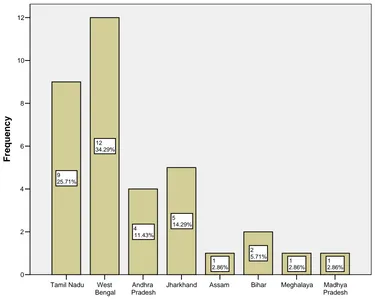
Figure 4: Distribution of the patients diagnosed newly at our centre according to state.
Presenting features at onset of illness:
Table 2 shows the presenting features at onset of illness in 189 out of 198 patients. 78(41.3%) patients had an anesthetic patch and 28(14.3%) had a deformity. 27(14.3%) had features of reaction.
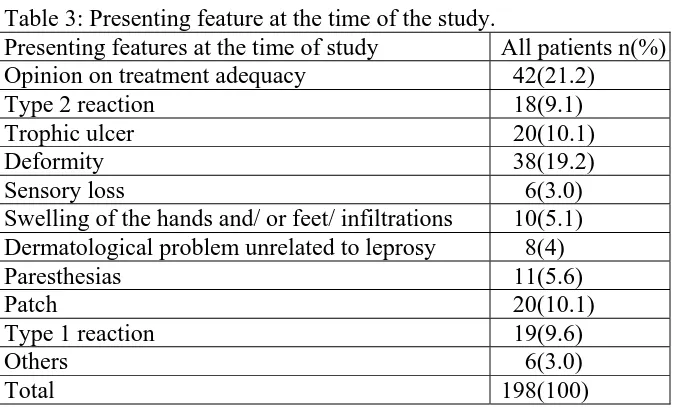
Presenting features at the time of study:
21.2% of consultations were for knowing the adequacy of treatment. 19.2% presented with a deformity and 10.1% complained of trophic ulcer. These details are shown in table 3.
Table 2: Presenting feature at onset of illness.
Symptom All patients
n(%)
Newly diagnosed n(%)
Anesthetic patch(es) 78(41.3) 11(31.4)
Deformity 28(14.3) 3(8.6)
Trophic ulcers 5(2.6) 1(2.9)
Erythematous patches suggestive of Type1 reaction 7(3.7) 3(8.6)
Erythema Nodosum Leprosum 13(6.9) 4(11.4)
Non anesthetic patches 15(7.9) 4(11.4)
Sensory loss without patches/ paresthesias 23(12.2) 3(8.6) Swelling of the hands / feet 4(2.1) 1(2.9)
Neuritis 7(3.7) 1(2.9)
Epistaxis 3(1.6) 1(2.9)
Infiltrations 4(2.1) 3(8.6)
Others 2(1.1) 0
[image:42.612.70.407.381.585.2]Total 189(100) 35(100)
Table 3: Presenting feature at the time of the study.
Presenting features at the time of study All patients n(%) Opinion on treatment adequacy 42(21.2)
Type 2 reaction 18(9.1)
Trophic ulcer 20(10.1)
Deformity 38(19.2)
Sensory loss 6(3.0)
Swelling of the hands and/ or feet/ infiltrations 10(5.1) Dermatological problem unrelated to leprosy 8(4)
Paresthesias 11(5.6)
Patch 20(10.1)
Type 1 reaction 19(9.6)
Others 6(3.0)
History of contact:
History of contact was available in 153 patients, of whom 30 patients(19.6%) gave history of contact with leprosy.
Bacillary(BI) and morphological indices(MI) :
Of the 198 patients, 16 patients did not get their skin smear test done. Among the rest(182), the smears were positive in 48 cases. The mean BI in these cases was 2.98+ (± 1.72) with a maximum of 6+. The mean MI in these cases was 0.26% (± 0.6) with a maximum of 2.5%. Skin smears were available in 32 out of 35 new cases. Of these, smears were positive in 15(46.88%) cases, the mean value in these cases was 4.25+ (±1.355) with a maximum of 6+. The mean MI among these cases was 0.75% (±0.865) with a maximum of 2.5%.
Disability scores:
Figure 5: The WHO disability grades of the clinic attendees.
41.03% 80
13.33% 26
45.64% 89
PROFILE OF THE STUDY POPULATION:
Out of a total of 198 patients, 81 consented for participation in interviews on utilization profile, activity limitation, participation restriction and mental health status.
Socio-demographic profile:
There were 67(82.7%) males and 14(17.3%) females. This group of 81, was representative of the above group of 198 with respect to age, sex, religion, state, MB/PB status and WHO disability grades, shown in table 4. Based on occupation, the largest groups were Government employees and students 12(14.8%) each, followed by housewives and shopkeepers 7(8.6%) each. 93.2 % of the study population was literate, of which 24(32.9%) were graduates.
Disease characteristics: Duration and disease spectrum:
Table 4: Socio demographic and clinical data of the clinic attendees and the study population.
Clinic attendees Study population Characteristics n(%) n(%) 0- 10 4(2.0) 3(3.7)
11- 20 13(6.6) 6(7.4)
21- 30 61(30.8) 26(32.1)
31- 40 52(26.3) 18(22.2)
41- 50 32(16.2) 15(18.5)
51- 60 20(10.1) 9(11.1) 61- 70 13(6.6) 2(2.5) 71- 80 2(1.0) 2(2.5) Age distribution
81- 90 1(0.5) 0
Male 162 (81.8) 67(82.7)
Sex
Female 36(18.2) 14(17.3)
Hindu 173(87.4) 70(86.4)
Muslim 22(11.1) 10(12.3) Religion
Christian 3(1.5) 1(1.2) Inactive disease 83(41.9) 27(33.3) Active/ inactive
disease Active disease 115(58.1) 54(66.7)
New diagnoses 35(17.7) 14(17.3)
Treated HD 36(18.2) 7(8.6)
TTHD 13(6.6) 5(6.2)
BTHD 68(34.3) 33(40.7)
BBHD 5(2.5) 3(3.8)
BLHD 25(12.6) 11(13.6)
LLHD 34(17.2) 15(18.5)
Diagnosis
Pure neuritic 17(8.6) 7(8.6)
PB 63(32.3) 28(35)
Bacillary status*
MB 132(67.7) 52(65)
0 89(45.64) 35(43.21)
1 26(13.33) 13(16.05)
WHO disability grades**
BI and MI:
22 out of the 81 patients had positive smears. The average BI among these cases was 2.65+(± 1.886), with a maximum of 5.75+. The average MI was 0.21%(± 0.569), with a maximum of 2%. Among the new cases, smears were positive in 5 out of 14. In these cases, the average BI was 4.01+(± 1.997), and the average MI was 0.72%(± 0.996).
Disability grades:
Table 5. Comparison of WHO grades and past history of reaction. Past history of reactions
No Yes Total p value
0 27 7 34
1 7 5 12 WHO
disability
grades 2 13 20 33
Total 47 32 79
[image:48.612.68.510.352.438.2]0.004
Table 6. Comparison of WHO grades and bacillary status. Bacillary status
PB MB Total p value
0 19 16 35
1 2 10 12
WHO disability
grades 2 7 26 33
Total 28 52 80
0.006
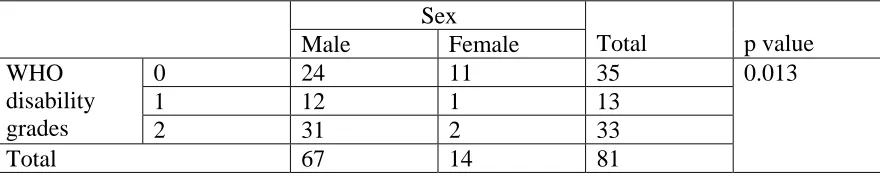
Table 7. Comparison of WHO grades and male sex. Sex
Male Female Total p value
0 24 11 35
1 12 1 13
WHO disability
grades 2 31 2 33
Total 67 14 81
[image:48.612.69.509.548.636.2]Disability at onset of illness:
64 out of 67 known cases were able to give details of disability at the onset of illness and any disabilities which developed thereafter. At the time of onset of illness, 41(64.1%) had no disability, 10(15.6%) had a grade 1 disability and 13(20.3%) had a grade 2 disability. Among the 41 patients who had no disability, 3 patients developed a grade 1 and 12 patients developed a grade 2 disability. Out of 10 patients who had a grade 1 disability at the onset of illness, 6 developed a grade 2 disability subsequently. Out of 13 patients who had a grade 2 disability, 1 patient acquired a new grade 1 disability and 3 patients, new grade 2 disabilities. At the time of presenting to our center, there were 48.4%(31/64)patients with grade 2 disability. Fig. 7 depicts the disabilities at presentation, and the disabilities acquired during or after treatment of these 64 patients.
32(40.5 %) had a past history of reactions. 21 out of the 32 had a resultant deformity and data on 1 patient was not available. Among those who were deformed, there was no statistical significance between those who had received steroids for their reaction and those who had not( p = 0.590). The results were the same, even when patients with history of neuritis alone were considered( p = 0.509).
Figure 6: WHO disability grades of the study population.
Figure 7: Disabilities at onset of illness and disabilities acquired thereafter. 33 40.74% 13 16.05% 35 43.21% 2 1 0
WHO disability grades
WHO grade 2 (n= 13) WHO grade 1 (n=10)
WHO grade 0 (n=41)
Disabilities present at the onset of illness
50 40 30 20 10 0 Disabil ities acqui re
d during or after
UTILIZATION PROFILE:
Delay:
64 out of 81 patients were able to recollect data regarding delay between onset of symptoms and starting any antileprosy treatment. Among these 29(45.3%) had a delay upto 6 months and 35(54.7%) had a delay equal to or more than 7 months. Complete data with regard to patient and health care system related delays were available in 58 out of the 64 patients. Among these, the patient with an outlier value of 624 months between presentation and treatment was excluded. In this group the distribution of delays are shown in table 9. The various correlates of delay are discussed below and shown in table 10.
♦ Age upto 35 years and more than 35 years:
The overall delay was longer in patients upto 35 years as compared to those above 35 years.
♦ Gender differences:
The average delay from onset of symptoms to presentation was 7.33 months in males and 10.32 months in females.
♦ Differences in delay between Tamil Nadu and West Bengal:
There was a longer health care system delay in patients from West Bengal.
♦ Disability:
The delays were longer in patients who did not have a disability as compared to those with disabilities.
♦ Pure Neuritic leprosy:
Table 8: Reason for seeking care at our centre.
Reason for seeking care at our centre n(%)
Second opinion 20(25)
Dissatisfaction with previous treatment 17(21.3)
Reputation 7(8.8)
Other medical/ surgical illness/ dermatological problem not related to leprosy
14(17.5)
New deformity 3(3.8)
Persistent reaction 2(2.5)
Primary care 4(5)
Trophic ulcers 5(6.3)
Correction of deformity 2(2.5)
Referral 6(7.5)
Total 80(100)
Table 9: Delay characteristics:
Delay in months Mean Median Range Std. deviation
From onset of symptoms to presentation (patient related delay)
7.9 3 48 10.46
From presentation to diagnosis 3.82 0 60 10.41 From diagnosis to starting treatment 1.61 0 72 9.60 From presentation to starting treatment
(health care system delay)
5.44 0 108 16.77
From onset of symptoms to starti treatment
♦ Bacillary status:
Paucibacillary patients had a longer health care system delay.
♦ Past history of reactions:
The overall delay was lesser among patients who had a past history of reaction.
♦ Use of alternative medicine:
17 of our patients had used alternative medicine and homeopathy was the most popular type. The health care system delay was longer in those who had taken alternative medicine.
♦ There was no correlation with levels of education (p= 0.553).
♦The number of doctors sought by the patients ranged from 1- 9. The factor of seeking more physicians was not associated with a longer delay(ρ = 0.082).
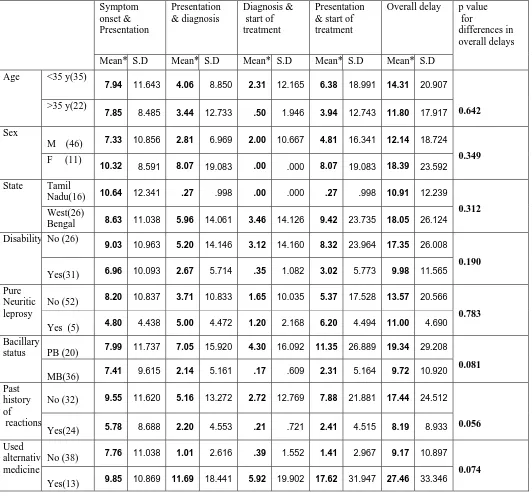
Table 10. Correlates of delay. Symptom onset & Presentation Presentation & diagnosis Diagnosis & start of treatment Presentation & start of treatment
Overall delay
Mean* S.D Mean* S.D Mean* S.D Mean* S.D Mean* S.D p value for
differences in overall delays
<35 y(35)
7.94 11.643 4.06 8.850 2.31 12.165 6.38 18.991 14.31 20.907 Age
>35 y(22)
7.85 8.485 3.44 12.733 .50 1.946 3.94 12.743 11.80 17.917 0.642
M (46) 7.33 10.856 2.81 6.969 2.00 10.667 4.81 16.341 12.14 18.724
Sex
F (11)
10.32 8.591 8.07 19.083 .00 .000 8.07 19.083 18.39 23.592
0.349
Tamil
Nadu(16) 10.64 12.341 .27 .998 .00 .000 .27 .998 10.91 12.239
State
West(26)
Bengal 8.63 11.038 5.96 14.061 3.46 14.126 9.42 23.735 18.05 26.124
0.312
No (26)
9.03 10.963 5.20 14.146 3.12 14.160 8.32 23.964 17.35 26.008 Disability
Yes(31) 6.96 10.093 2.67 5.714 .35 1.082 3.02 5.773 9.98 11.565
0.190
No (52) 8.20 10.837 3.71 10.833 1.65 10.035 5.37 17.528 13.57 20.566
Pure Neuritic leprosy
Yes (5) 4.80 4.438 5.00 4.472 1.20 2.168 6.20 4.494 11.00 4.690
0.783
PB (20) 7.99 11.737 7.05 15.920 4.30 16.092 11.35 26.889 19.34 29.208
Bacillary status
MB(36) 7.41 9.615 2.14 5.161 .17 .609 2.31 5.164 9.72 10.920
0.081
No (32) 9.55 11.620 5.16 13.272 2.72 12.769 7.88 21.881 17.44 24.512
Past history of reactions
Yes(24) 5.78 8.688 2.20 4.553 .21 .721 2.41 4.515 8.19 8.933 0.056
No (38) 7.76 11.038 1.01 2.616 .39 1.552 1.41 2.967 9.17 10.897
Used alternative medicine
Yes(13) 9.85 10.869 11.69 18.441 5.92 19.902 17.62 31.947 27.46 33.346
Number of physicians consulted:
76 patients were able to give the details of the number of physicians they consulted for treatment, before coming to our centre. The mean number of doctors consulted was 2.5(± 1.822), median was 2, mode, 1 and the maximum was 9. Among the 14 newly diagnosed patients, 6 patients presented to our centre for the first time after noticing the symptoms. In the other 8, the average number of visits before being diagnosed was 1.25. Only one of these 8 patients had used Government health care services. Of the 6 patients who presented first at our centre, 3(50%) were contacts of patients with leprosy and all three presented with a patch. Fig. 8 shows the number of physicians consulted. The number of doctors was more in patients with past history of reactions (p < 0.001), with multibacillary disease (p= 0.025) and with use of alternative medicine (p= 0.001). Among the states, patients from Tamil Nadu consulted an average of 1.32(± 0.885) physicians, those from West Bengal, an average of 2.71(± 1.707), and all other states put together, 3.26(± 2.207) were consulted. The differences were significant(p = 0.002). This is shown in Fig. 9. There were no significant differences between duration of disease and the number of physicians consulted (p = 0.384), or gender of the patient (p = 0.054).
Defaulting:
Figure 8: Number of physicians consulted by the patient.
Figure 9: Number of physicians - state wise.
4 3
2 1
0
Number of physicians consulted by the newly diagnosed patients 6 5 4 3 2 1 0 Freque ncy 1 7.14% 1 7.14% 2 14.29% 4 28.57% 6 42.86% 9 8 7 5 4 3 2 1 0
Number of doctors
20 15 10 5 0 Freque ncies 1 1.32% 1 1.32% 2 2.63% 4 5.26% 3 3.95% 4 5.26% 3 3.95% 1 1.32% 1 1.32% 1 1.32% 2 2.63% 5 6.58% 11 14.47% 10 13.16% 5 6.58% 3 3.95% 1 1.32% 5 6.58% 11 14.47% 2 2.63% Others West Bengal Tamil Nadu
Prior treatment:
59 patients had complete details of previous treatment. 1 had defaulted after coming to know of the diagnosis and was not on any treatment, 1 was diagnosed, but not treated and the rest of the patients could not recollect exact details. 35/ 59 had taken only WHO MDT, 15/ 59 had other regimens of antileprosy treatment and 9/ 59 had taken both, shown in Fig.10. The average duration of antileprosy treatment was 28.28 months, of which the average duration of MDT was 11.4 months and that of other antileprosy treatment regimens was 16.86 months.
Awareness about diagnosis:
Among the known cases, 7(10.6%) patients were not aware of their diagnosis, even though 5 of them had received MDT and 4 could definitely identify the blister packs. 59(89.4%) were aware of their diagnosis. 38(64.4%) out of 59 patients were able to identify blister packs.
Symptoms after release from treatment (RFT):
Figure 10: Treatment details.
Table 11: Reasons for seeking care after release from treatment
Reasons for seeking care (n) %
Persistent sensory loss 6 21.4
Persistent motor weakness 4 14.2
Reactions 5 17.9
Trophic ulcers/ callosities 5 17.9
New patches 1 3.6
Generalised malaise 1 3.6
Total 22 78.6
81 - Study population
67- Known cases of leprosy
14 - New cases
2 – Never started antileprosy drugs
6 - Unable to recollect details
59 - Treatment details available
35 – WHO MDT only
15 – Other regimens of antileprosytreatment only
Cost analysis:
Out of 81 patients the details of economic impact was available in 62. Of these, complete details regarding the direct and indirect costs were available in 60 patients and are shown in table 12.
Loss or change of job:
12(19.4 %) were forced to lose or change their jobs. Their productivity losses are shown under indirect costs, in table 12.
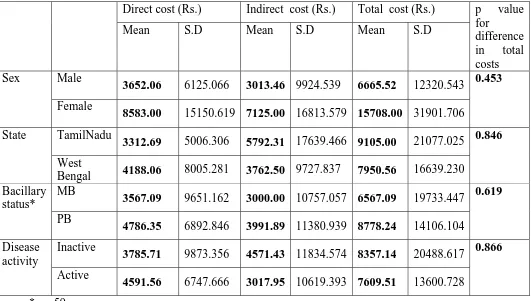
The differences in expenditure by gender, state, bacillary status, disease activity are shown in table 13.
Table 12: Costs over the past 1 year.
Cost In Rupees Direct cost Indirect cost Total cost
Mean 4309.52 4748.89 7871.18
Median 2112.50 0 2720.00
Std. deviation 7906.986 12491.536 16173.074
Minimum 0 0 0
Maximum 44400 63900 92400
Table 13: Comparisons of cost based on gender, states, bacillary status and activity. Direct cost (Rs.) Indirect cost (Rs.) Total cost (Rs.)
Mean S.D Mean S.D Mean S.D
p value for difference in total costs Male
3652.06 6125.066 3013.46 9924.539 6665.52 12320.543 Sex
Female
8583.00 15150.619 7125.00 16813.579 15708.00 31901.706
0.453
TamilNadu
3312.69 5006.306 5792.31 17639.466 9105.00 21077.025 State
West
Bengal 4188.06 8005.281 3762.50 9727.837 7950.56 16639.230
0.846
MB
3567.09 9651.162 3000.00 10757.057 6567.09 19733.447 Bacillary
status*
PB
4786.35 6892.846 3991.89 11380.939 8778.24 14106.104
0.619
Inactive
3785.71 9873.356 4571.43 11834.574 8357.14 20488.617 Disease
activity
Active
4591.56 6747.666 3017.95 10619.393 7609.51 13600.728
0.866
[image:60.612.43.574.295.596.2]Figure 11: Participation scale.
Moderate participation restriction Mild participation restriction
No significant participation restriction
Interpretation of the P scale
60
50
40
30
20
10
0
F
requency
2 3.28% 8
13.11% 51
ASSESSMENT OF PARTICIPATION RESTRICTION, ACTIVITY LIMITATION AND MENTAL HEALTH STATUS
P scale:
The P scale was performed on 61 patients. The mean score was 4.95(±6.46) and median was 3. The minimum score was 0 and maximum was 28. Using the P scale, 8 patients had a mild restriction of participation and 2 had a moderate restriction and 51 had no restriction, shown in Fig. 11.
The P scale score was higher in patients who had to change or lose their jobs(p=.012), and in patients who gave a history of suicidal tendencies ( p = 0.039).
SALSA:
The SALSA scale was done on 63 patients. The median score was 22, mean was 24.30(± 6.26), with a minimum of 19 and a maximum of 52. The safety awareness score ranged from 0 to 5, with a mean of 0.75 (± 1.307). The awareness score was not more among patients with a higher level of literacy (ρ = - 0.097) or longer duration of disease (ρ = - 0.015). SALSA scores were higher with higher grades on the WHO disability scales (p=0.008) using the Kruskal – Wallis test.
Mental health impairment: GHQ 12:
The GHQ 12 was applied to 55 patients. The median value was 3, mean was 3.45(± 3.63), the minimum score was 0 and the maximum 12. 4 patients scored 12. Using the GHQ 12, 28(50.9 %) cases were found to be depressed, shown in Fig. 12.
There were significant correlations between the GHQ 12 and a higher number of physician consultations (p = 0.012, r = 0.354). There were no significant correlations between the GHQ 12 and age (r = -0.093), sex (p = 0.406), present reactional state (p = 0.073), education (p = 0.250), loss or change of job (p = 0.123), socioeconomic status by housing (p = 0.082), knowledge of disease (p = 0.490) or with increasing disability (p =0.667).
ICD 10 primary care criteria for depression:
Using the ICD 10 criteria, 6 out of 50 patients (Fig. 13) were diagnosed to have depression, all of whom had depression on screening using the GHQ 12, shown in table 14. The correlation between the GHQ 12 and the ICD criteria was significant (r = 0.355). The ICD criteria showed no correlations with increasing disability. 22.2% of patients in our study had suicidal ideation or acts.
GHQ 12 & ICD 10:
Figure 12: Depression according to GHQ 12.
Figure 13: Cases of depression according to the ICD criteria.
Table 14: Comparison of GHQ 12 and ICD 10 criteria (p = 0.021) Depression by ICD 10 criteria
No Yes
Total
No 24 0 24
Depression
by GHQ 12 Yes 20 6 26
Total 44 6 50
28 50.91%
27 49.09%
YES NO
Depression as screened by the
GHQ 12
6 12.0%
44 88.0%
YES NO
Cases of depression as diagnosed by the
Correlations of the P scale, the SALSA, and the GHQ 12:
Out of 63 patients, 54 had complete details regarding the P scale, SALSA scale and the GHQ 12.
P scale and the GHQ 12:
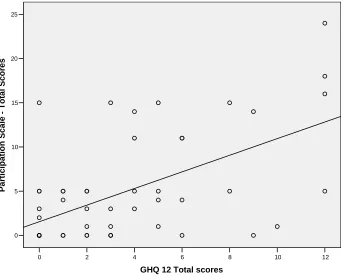
The P scale score had significant correlations with cases of depression as diagnosed by the GHQ 12, (r = 0.599, p < 0.001), shown in Fig.14.
P scale and the SALSA scale:
There is a linear correlation between the P and the SALSA scales, (r = 0.43, p = 0.003), shown in Fig. 15.
SALSA and GHQ 12:
Figure14: Correlations between the P scale and the GHQ 12.
Figure 15: Correlations between the P scale and the SALSA. 30 25 20 15 10 5 0 Parti c ip
ation Scale - Tota
l Scores 12 10 8 6 4 2 0
[image:68.612.120.463.106.383.2]DISCUSSION
Leprosy is on the decline according to national and international statistics. Leprosy services are fully operational under the general health care services and free and unrestricted access to medical care has been promised. However, the needs as felt by the patients may not always be captured by incidence or prevalence rates. In order to cater to the patients as best as possible, it is necessary to know the health care utilization of the patients and their needs and wants which influence that profile. In fulfilling the commitment towards early case detection and prompt treatment, we need to know the delays that come in the way of the above goals.
Socio demographic profile:
Disease characteristics:
Patches on the skin were the first noticed symptom in 42.8% of the cases newly diagnosed at our centre (anesthetic in 31.4%), and other common presentations of leprosy like trophic ulcers, deformity and ENL made up 22.9% . Overall, 65.7% of our new cases could have been easily picked up by a trained health worker at the primary health centre level. This prompts two conclusions – either the masses are not adequately aware of the local availability of leprosy services, in which case the component of awareness has to be strengthened , or cases are being missed at the primary level, which calls for better training and orientation programmes for all health workers.
Patches and nerve involvements are the only diagnostic criteria, recommended by the WHO.1 Skin smears are not routinely done. However, we found that among our newly diagnosed patients, 46.88% were smear positive, with an average bacillary index of 4.25 and a maximum of 6. The proportion of MB cases among the newly diagnosed was 71.4%, higher than the national average of 45.83%.5 Considering both the above factors, skin smear testing is necessary in identifying cases which may have atypical presentations, but which nevertheless disseminate infection.
Among the known cases of leprosy, the disability rates had risen from 20.3% to 48.4%, which was in stark contrast to a study from Brazil, in which the disability rates actually decreased through treatment and follow up.45 This probably reflects on the level of efficacy of prevention of disability measure available to patients. Males had more deformities compared to females(p = 0.013) in keeping with earlier studies.52, 64
Utilization profile:
delay was more in the latter group. This resulted in a longer overall delay disagreeing with available data,41 though the difference was not significant.
In our study the delay was greater in paucibacillary patients as compared to multibacillary cases, disagreeing with earlier studies.26, 52 The difference here was attributable primarily to the health care aspect of the delay in our study, i.e. failure to diagnose paucibacillary cases early.
Patients with disabilities had less delays than those without disabilities, differing from earlier studies.43 This finding is encouraging considering that early presentation is desirable, especially if patients already have a nerve function impairment. However, this could also mean that cases with subtle presentations are being missed.
We also found that the mean delays were longer in patients from West Bengal (18.05 months) as compared to those from Tamil Nadu (10.91 months). The difference in delay was attributed primarily to the health care component (9.42 months among West Bengal cases and only 0.27 from Tamil Nadu).
the problem is identified , resources can be preferentially diverted to solve it. Salvaging available resources is especially important in the context of integration.
The average number of physicians consulted was 2.5 (± 1.822), which was remarkably similar to a study done 25 years ago. However, there were no associations with male sex or with duration of disease.46 Newly diagnosed patients among the study population, had to visit an average of 1.25 physicians before a diagnosis was made. Studies from Nigeria state a value of 2.7.53 We compared the states under 3 headings as Tamil Nadu, West Bengal and others. The number of physicians contacted was highest in patients from the third group(3.26±2.207) and least among cases from Tamil Nadu(1.32±0.885) while patients from West Bengal had visited an average of 2.71 (± 1.707) physicians( p = 0.002). This could be because 68.42% of patients from TamilNadu had seen no other or only a single other physician before coming to our centre.
Economic losses:
Our patients had spent an average of 20.05% of their annual income on health care for leprosy, with the maximum being 128.53% .
We found that 12(19.4%) of our patients were forced to lose their jobs or change over to another, less demanding and probably lesser paying job. This was less than earlier studies from Nigeria 49and Tamil Nadu.73, 75 This could probably be a result of reduction both in stigma and in case load, considering that both the above studies were published 2 decades ago.
Participation restriction:
Evaluating the level of participation restriction in relation to the level of activity limitation, we found that the P and the SALSA scales correlated with each other. In view of this, it would be a good idea to administer both these scales together, while evaluating the efficacy of rehabilitation programmes.
However, since there is a paucity of data, we feel that further studies using larger populations should be done, before advocating this scale for use in a clinic based setting.
Activity limitation:
The SALSA scale was developed as screening measure for health care workers to detect activity limitation.14 In our study , the activity limitation was found to increase with the disability grades( p = 0.008), as has been described in the original study.14 We found no correlations with age as has been mentioned in the above study. Though we have used this study cross-sectionally, we feel that this scale could be of more use in longitudinal studies along with measurements of the EHF sum scores to assess the efficacy of prevention of disability programmes.
again, the efficacy of using this scale for health education can be confirmed only with longitudinal studies.
Mental health impairment:
We found 50.9% of our patients to be depressed using the GHQ 12 , with a cut off of 2/3 as has been advocated by Goldberg et al.114 However, only 6 of these patients, were confirmed to have depression using the ICD 10 criteria. Using this cut off, the GHQ 12 was found to have a similar sensitivity in our study as has been found in an earlier study in culturally comparable population.114 22.2% of patients in our study were found to have had suicidal thoughts or acts. This was higher compared to the 18.5% reported from Ethiopia.111 Surprisingly the mental health impairment as determined by the GHQ 12 and the ICD 10 criteria did not increase with higher disability grades as has been proved in earlier studies.98, 109-112, 115 We suggest the use of a better tool with more specificity for evaluation of the mental health impairment. Another option would be to use 2 scales, one for screening and another with higher specificity for confirmation, as has been used here.
LIMITATIONS OF THE STUDY
1. Patients were required to spend considerable time (45- 60min) for the assessment. Owing to which, only 81 of the available 198 patients, consented for participating in the questionnaires related to activity and participation limitations and mental health status. Also, owing to a language barrier, patients who did not have a working knowledge of any one of the languages used ( English, Tamil, Hindi and Bengali) could not participate in the above assessments. This limited the number of patients available for evaluation of these parameters.
2. The estimated cost of care represents only a fraction of capital spent, the lifetime costs are not captured.
3. Ours being a cross sectional study, we were unable to evaluate the potential of the SALSA scale as a tool in health education for prevention of disability.
4. Since most of the information used in our study were based on patients' recounting of past events, recall bias is a factor to be considered.