Bangladesh
PRELIMINARY TEST ESTIMATORS FOR THE
MULTIVARIATE NORMAL MEAN BASED ON THE
MODIFIED W, LR AND LM TESTS
S.Khan
Department ofMathematics andComputing
UniversityofSouthern Queensland
QLD4350, Australia
Email: [email protected]
Z.Hoque 1
Department ofMathematics andComputing
UniversityofSouthern Queensland
QLD4350, Australia
Email: [email protected]
summary
Inthis paper we consider the preliminary test estimators (PTEs) of the mean
vectorof multivariate normal distribution underthe modied Wald, likelihood
ratio,andLagrange multipliertests. Thepropertiesoftheestimators havebeen
investigatedundersome popular statistical criteria. It has been observedthat
withrespecttothequadraticbiastheWaldtestbasedPTEperformsbetterthan
thosebasedonthelikelihoodratioandLagrangemultipliertests.Whereas,with
respectto thequadratic risk theLagrange multipliertest basedPTEperforms
better thanthosebasedon thelikelihoodratio and Wald tests. Theresults of
this study reveal that the use of the three modied tests in the formation of
thePTEssignicantlyreducestheconictamongthePTEsascomparedtothe
estimatorsbasedonthethreeoriginaltestsintermsofbothquadraticbiasand
riskproperties.
Keywords: Preliminarytestestimator;Wald,likelihoodratioandLagrange
mul-tipliertests; quadraticbias;quadraticrisk;relativeeÆciencyandconict.
AMS2000SubjectClassication: Primary62H12,Secondary62F05.
1 Introduction
The multivariatenormal distributionis appropriateto model many reallife phenomenon,
andhenceintheliteraturethereisagreatdealofinteresttoimprovetheestimationofits
parameters. Often, forap-dimensionalnormaldistribution,theinterestis toestimatethe
meanvectorwhenthecovariancematrixisunknown. Acommonandpopularestimator
ofisthemaximumlikelihoodestimator(MLE).Customarily,thisMLEisbasedexclusively
on the sample responses, and is known as the unrestricted estimator (UE). The sample
information basedUE of isunbiasedand uniformly minimum variance. Thisestimator
obviouslydisregardsanyotherkindofnon-samplepriorinformationontheparameter.
Often information on the value of is available from expert knowledge or previous
investigations. Inclusionof suchpriorinformationin thedenitionofestimatorislikelyto
improvesomestatisticalpropertiesof theestimator. Accordingto Fisher,thisnon-sample
priorinformationcanbeexpressedintheformofanullhypothesisH
0
:=
0
(cf. Ahmed
and Saleh 1989). Usually, the researchersare notsure that theprior informationis quite
true, and hence there is an uncertainty in the validity of the null hypothesis. However,
assuggestedby Bancroft(1944),the uncertainty in thenon-sample priorinformation can
beremovedbyperforminganappropriatestatisticaltest onthenullhypothesis. Basedon
thepriorinformation, arestrictedestimator(RE)ofisdened as b
=
0
. Saleh(1973)
appliedthisideain themultivariatenormalcasewithdiagonalcovariancematrix.
TheUEandREfailtousebothsampleandnon-samplepriorinformation. Therefore,it
isdesirabletodevelopanimprovedestimatorbycombiningthenon-samplepriorinformation
as well asthe sample information. This is done by using the preliminary test estimator
(PTE)whichisafunction oftheUE,REandanappropriatestatisticaltestfortestingthe
nullhypothesis.
Manyauthors haveused the likelihood ratio(LR) test orequivalentF-testto test H
0 .
Intheliteraturethere aretwoothercompeting tests,namely,theWald(W)andLagrange
multiplier (LM) tests to test the sameH
0
. The W test wasintroduced by Wald (1943),
and the LM test by Aitchison and Silvey (1958), and Silvey (1959). Engle (1984) has
proved that the LM test is the sameas the score test of Rao (1947). Instead of the LR
test, thesetwotestscanalso beused todene thePTE(cf. Billah andSaleh1998,2000).
Recently, Kibria (2002) uses the three original W, LR and LM tests in the denition of
PTEs andcompares theirperformances. Althoughit doesnotengage in theinvestigation
oftheconict (dierencebetweenthelargestand smallestrelativeeÆciency),itis evident
that theperformancesof thePTEsunder dierenttestsaredierent, andhencethereisa
greatdealofconictamongthethreePTEsbasedonthethree originaltests.
Theexactsamplingdistributions oftheW, LRand LMteststatisticsarecomplicated.
In practice, the criticalregions of the tests are considered based on the sameasymptotic
approximate distributionofthe statistics. It hasbeenproved(cf. Engle 1984)that under
the null hypothesis the three teststatistics areasymptotically equivalent, and distributed
asacentral chi-squarevariablewiththesamedegreesoffreedom. Evansand Savin(1982)
haveshown that these testsbasedon theapproximate chi-squarecritical valuedierwith
respectto theirsize andpower,andhencelikelyto resultin conictingconclusions.
EvansandSavin(1982)haveinvestigatedtheeectsofsomemodicationsonthethree
(c.f Gallant,1975)and those derivedfrom second orderEdgeworthapproximationsto the
exact distributions of the test statistics (Rothenberg, 1977). Their study shows that in
case of the modied tests the conict among the size and power properties of the three
testsisreduced. Inthisstudy,weapplytheGallent's(1975)degreesoffreedomcorrection
to theestimate ofthe covariancematrix, and Rothenberg's (1977)correctionto the exact
distributions ofthe teststatistics. Weconjecturethat theuse ofthemodiedtestsin the
denitionofPTEwillreducetheconictamongthepropertiesofthePTEsunderthethree
modiedtests. ThemainobjectiveofthisstudyistoformulatethePTEofbasedonthe
threemodiedtests,andinvestigatethesmallsamplepropertiesofthePTEs. Furthermore,
thisstudycomparestheconictamongtheperformancesofPTEsunderthethreemodied
testswiththat oftheperformancesofthePTEsunder thethreeoriginaltests.
Theorganizationofthis paperisasfollows. InSection 2,weoutlinetheteststatistics
andthePTEsbasedondierentteststatistics. Thebiasfunctions ofthePTEshavebeen
statedandanalyzedinSection3. Section4providesexpressionsforthequadraticrisksand
theiranalyses. Finally,someconcludingremarksaregivenin section5.
2 The Tests and the Estimators
Consider a random sample X
1 ;X
2 ;:::;X
n
of size n from a p-dimensional multivariate
normaldistributionwith unknownmeanvectorand covariancematrix= 2
I
p , where
I
p
isanindentitymatrixoforderp. Basedonthesampleinformation,theUEofisdened
as
e =
X = 1
n n
X
j=1 X
j
: (2.1)
Letthenon-samplepriorinformationaboutbeexpressedbythenullhypothesis,
H
0
:=
0
: (2.2)
To test the null hypothesis in (2.2) the commonly used LR test based F statistic is
dened as
F =
2
p ()=p
2
n p
=(n p)
(2.3)
where 2
p
() is a non-central chi-square variable having p degrees of freedom (d.f.) and
non-centralityparameter=Æ 0
ÆwithÆ= p
n 1
2
Æ
inwhichÆ
=
0 ,and
2
n p isa
central chi-squarevariablewith(n p)d.f. Totestthe samehypothesistheteststatistics
undertheoriginalW, LRandLMtestscanbeexpressedas
T
W =
np
m F
p;m
() (2.4)
T
LR
= ln n
1+ p
m F
p;m ()
o
n
(2.5)
T
LM =
npF
p;m ()
m+pF ()
where m = n p, respectively. Under the null hypothesis these three test statistics are
equivalent, and their asymptotic distribution is chi-square with p d.f. As suggested by
EvansandSavin(1982),theapplicationofthedegreesoffreedomcorrectiontotheestimate
ofthecovariancematrix(Gallant,1975)forWandLMtests,andsecond orderEdgeworth
approximations to the exact distributions of the test statistic(Rothenberg, 1977) for the
LRtest givesthefollowingmodiedformsoftheteststatistics.
T
W
= pF
p;m
() (2.7)
T
LR
= (m+ p
2 1)ln
1+ pF
p;m ()
m
(2.8)
T
LM =
(m+p)pF
p;m ()
m+pF
p;m ()
: (2.9)
ThiscorrectiontotheLRstatisticensuresthattheLRtesthasthecorrectsignicancelevel
toorder1=m(seeAnderson, 1958,p. 208).
Basedonthesampleinformation,non-samplepriorinformationandanappropriatetest
for testingthe hypothesis in (2.2), thepreliminary test estimatorof the meanvectoris
dened as
b
PTE
G
= e (e )b I(T
G <
2
) (2.10)
where T
G
is any appropriate test for testing H
0
, and I() is an indicator function which
assumesvalueunitywhentheinequalityintheargumentholdsand0otherwise. Therefore,
when I() = 1 the PTE becomes the RE, otherwise it is the UE. Replacing T
G
by any
appropriateteststatisticdierentPTEsofcanbeobtained.
3 The Bias Function
InthissectionthebiasfunctionsofthePTEsofunderthethreemodiedtestsarestated.
Thebiasfunction of anestimatorofthe parametervectorisalsoavector. Therefore, any
direct comparison among the biasesis not meaningful. To facilitate the comparison the
quadraticbias(QB)functionsofthePTEsunderthethreemodiedtestsarederived,and
analysed both graphicallyand numerically. Moreover, the conict among the QBs which
is thedierenceof themaximumand minimumvaluesof theQBs ofthe threePTEs, has
beencomputedand analysed. Fortheexpression ofthe biasfunctions of thePTEs under
thethreeoriginaltestsreadersmayseeKibria(2002). ThebiasfunctionsofthePTEunder
thethreemodiedtestsarestatedinthefollowingtheorem.
Theorem3.1: The bias functions of the PTEs of under the modied W, LR andLM
testsarerespectively
B(b SPTE
W
;) = Æ
G
p+2;m h
W
1 ;
B(b SPTE
LR
;) = Æ
G
p+2;m
h LR
1(E) ;)
B(b SPTE
;) = Æ
G
p+2;m h
LM
where h W i = 2 (p+2i) , h LR i(E) = m (p+2i) e 2 =(m+ p 2 1) 1 ,h LM i = m 2 (p+2i) m+p 2 )
, i=1;2;
and G
a;b
(h;) is the distribution function of the non-central F-distributionwith (a;b) d.f.
andnon-centralityparameter evaluatedath.
Theproofofthetheoremisstraightforward.
3.1 Analysis of Quadratic Bias
FromTheorem3.1 thefollowingforms ofthequadraticbiasesareobtained.
QB[b PTE
W
;] = Æ 0 Æ G p+2;m h W 1 ; 2 =Q 1 QB[b PTE LR
;] = Æ 0 Æ n G p+2;m h LR 1(E) ;) o 2 =Q 2 QB[b PTE LM
;] = Æ 0 Æ G p+2;m h LM 1 ; 2 =Q 3 (say):
From Table 3.1 and Figure 1 & 2 it is observed that when = 0 (under the null
hypothesis)the quadratic biasesof the PTE under thethree originalas well asthe three
modiedtestsare0. Inbothcases,asdeviatesfrom0,thequadraticbiasesstartgrowing
larger. Fromsomemoderatevaluesof,thequadraticbiasesstartdecreasing,andapproach
to0fromsomelargevalueof. Interestingly,theinequality
Q 1 Q 2 Q 3 (3.1)
exists among the quadratic biases of PTEs under the three original as well as the three
modied tests. The above inequality relation of the QBs is the reverse of the inequality
relation that exists among theoriginal test statisticsfor arbitrary. Foranyxed , as
the sample size increasesthe conict among the quadratic biasesof the PTEs under the
originalandthemodiedtestsdecreases. Foranyxedsamplesizeand=0,thereisno
conict among the quadratic biasesof the PTEs regardlessof the useof the original and
modiedtests. Asdeviatesfrom zero,theconictamongthequadraticbiasesincreases.
Fromsomemoderatevalueof(say,
m
)theconictdecreases,anditapproachestozero
fromsomelargevalueof(say,
l
). TheperformancesofthePTEsvaryforvarying. In
thisstudy weuse=0:05forthecomputationofthe QBsofthePTEs. Fortheselection
of anoptimumreadersmaysee ChiouandSaleh (2002). TheTable3.1reveals thatthe
conictamongtheQBsofthePTEsunderthethreeoriginaltestsismuchmorehigherthan
that of QBs of the PTEs under the three modied tests, unless = 0or,
l . For
Table3.1: QuadraticbiasofPTEfororiginalandmodiedW, LRandLMtests
forp=5,=0:05andselectedvaluesofn,(hereConft standsforconict).
n=20 n=30 n=50
Q
1 Q
2 Q
3
Conft Q
1 Q
2 Q
3
Conft Q
1 Q
2 Q
3
Conft
0 0 0 0 0 0 0 0 0 0 0 0 0
1 0.306 0.517 0.846 0.540 0.404 0.561 0.765 0.361 0.491 0.591 0.706 0.215
2 0.460 0.854 1.581 1.121 0.624 0.925 1.369 0.745 0.775 0.973 1.220 0.445
3 0.511 1.043 2.192 1.681 0.709 1.125 1.808 1.099 0.899 1.177 1.549 0.650
4 0.499 1.117 2.676 2.177 0.705 1.195 2.091 1.386 0.909 1.242 1.716 0.807
5 0.451 1.108 3.033 2.582 0.648 1.173 2.235 1.587 0.847 1.207 1.752 0.905
6 0.388 1.043 3.271 2.883 0.564 1.089 2.264 1.700 0.746 1.107 1.689 0.943
7 0.321 0.944 3.399 3.078 0.471 0.971 2.201 1.730 0.629 0.973 1.559 0.930
8 0.257 0.829 3.431 3.174 0.381 0.838 2.071 1.690 0.513 0.826 1.389 0.876
9 0.201 0.711 3.381 3.180 0.300 0.704 1.897 1.597 0.406 0.681 1.203 0.797
10 0.155 0.596 3.266 3.111 0.232 0.578 1.698 1.466 0.314 0.548 1.015 0.701
12 0.087 0.398 2.898 2.811 0.130 0.367 1.284 1.154 0.177 0.333 0.679 0.502
15 0.033 0.196 2.191 2.158 0.049 0.166 0.750 0.701 0.066 0.139 0.327 0.261
20 0.005 0.049 1.126 1.121 0.008 0.035 0.241 0.233 0.010 0.025 0.074 0.064
25 0.001 0.010 0.480 0.379 0.001 0.006 0.062 0.061 0.001 0.004 0.013 0.012
30 0.000 0.002 0.178 0.178 0.000 0.001 0.014 0.041 0.000 0.000 0.002 0.002
Q
1 Q
2 Q
3
Conft Q
1 Q
2 Q
3
Conft Q
1 Q
2 Q
3
Conft
0 0 0 0 0 0 0 0 0 0 0 0 0
1 0.516 0.703 0.846 0.330 0.554 0.680 0.765 0.211 0.585 0.661 0.706 0.121
2 0.852 1.245 1.581 0.729 0.912 1.177 1.369 0.457 0.960 1.120 1.220 0.260
3 1.039 1.632 2.192 1.153 1.106 1.501 1.808 0.702 1.158 1.394 1.549 0.391
4 1.112 1.878 2.676 1.564 1.172 1.675 2.091 0.919 1.218 1.515 1.716 0.498
5 1.102 2.004 3.033 1.931 1.147 1.727 2.235 1.088 1.180 1.516 1.752 0.572
6 1.037 2.030 3.271 2.234 1.063 1.685 2.264 1.201 1.080 1.432 1.689 0.609
7 0.939 1.980 3.399 2.460 0.945 1.578 2.201 1.256 0.947 1.296 1.559 0.612
8 0.824 1.873 3.431 2.607 0.813 1.430 2.071 1.258 0.802 1.132 1.389 0.587
9 0.706 1.729 3.381 2.675 0.681 1.262 1.897 1.216 0.659 0.961 1.203 0.544
10 0.592 1.563 3.266 2.674 0.558 1.087 1.698 1.140 0.529 0.796 1.015 0.486
12 0.395 1.212 2.898 2.503 0.353 0.762 1.284 0.931 0.320 0.512 0.679 0.359
15 0.194 0.746 2.191 1.997 0.158 0.397 0.750 0.592 0.133 0.233 0.327 0.194
20 0.036 0.216 0.962 0.926 0.024 0.079 0.187 0.163 0.016 0.034 0.054 0.038
0
10
20
30
0
0.5
1
1.5
2
2.5
3
3.5
∆
Quadratic bias
Original tests for n = 20
W
LR
LM
0
10
20
30
0
0.5
1
1.5
2
2.5
3
3.5
∆
Quadratic bias
Modified tests for n = 20
W
LR
LM
0
10
20
30
0
0.5
1
1.5
2
2.5
∆
Quadratic bias
Original tests for n = 30
W
LR
LM
0
10
20
30
0
0.5
1
1.5
2
2.5
∆
Quadratic bias
Modified tests for n = 30
W
LR
LM
Figure 1: Quadratic biasesof thePTE based onthe W, LR and LM testsfor p= 5and
=0:05
4 The Quadratic Risk Function
Intheliterature,thequadraticrisk(QR) hasbeenwidely usedasastatistical criterionto
judgetheperformanceoftheestimators. Anestimatorwithsmallerriskisalwayspreferred
overthe other that with largerrisk. Researchers areinterestedto nd an estimatorwith
minimumrisk. Inthissectionthequadraticriskfunctions ofthePTEsbasedonthethree
modied W, LR and LMtests are stated and analysed both graphically and numerically.
Moreover,theconict (the dierenceofthemaximumand minimumvaluesof therelative
eÆciencies)among therelativeeÆcienciesrelativetotheUE ofthe threePTEs underthe
threeoriginalaswellasthethreemodiedtestshavebeenobtainedandcompared. Forthe
expressionsoftheQRfunctionsofthePTEsunderthethreeoriginaltests,andananalytical
0
10
20
30
0
0.5
1
1.5
2
∆
Quadratic bias
Original tests for n = 40
W
LR
LM
0
10
20
30
0
0.5
1
1.5
2
∆
Quadratic bias
Original tests for n = 50
W
LR
LM
0
10
20
30
0
0.5
1
1.5
2
∆
Quadratic bias
Modified tests for n = 50
W
LR
LM
0
10
20
30
0
0.5
1
1.5
2
∆
Quadratic bias
Modified tests for n = 40
W
LR
LM
Figure 2: Quadratic biasesof thePTE based onthe W, LR and LM testsfor p= 5and
=0:05
Theorem4.1: The quadratic riskfunctions of the PTEs of the mean vector of
multi-variatenormal distributioncanbestatedas
R
W
= p pG
p+2;m (h W 1 ;)+ 2G p+2;m (h W 1
;) G
p+4;m (h W 2 ;) R LR
= p pG
p+2;m (h LR 1 ;)+ 2G p+2;m (h LR 1
;) G
p+4;m (h LR 2 ;) R LM
= p pG
p+2;m (h LM 1 ;)+ 2G p+2;m (h LM 1
;) G
p+4;m (h LM 2 ;) ; whereR W =QR h b PTE W ; i ,R LR =QR h b PTE LR ; i , R LM =QR h b PTE LM ; i ;h W i ,h LRr i(E) andh LM i
,for i=1;2aredenedearlier in Theorem 3.1.
Theproofofthetheoremisstraightforward.
4.1 Analysis of Quadratic Risk
0
5
10
15
20
25
30
0
5
10
15
20
∆
Relative efficiency
Original tests for n = 20
1−line
W
LR
LM
0
5
10
15
20
25
30
5
10
15
∆
Relative efficiency
Modified tests for n = 20
1−line
W
LR
LM
0
5
10
15
20
25
30
0
2
4
6
8
10
12
14
∆
Relative efficiency
Original tests for n = 30
1−line
W
LR
LM
0
5
10
15
20
25
30
0
2
4
6
8
10
12
14
∆
Relative efficiency
Modified tests for n = 30
1−line
W
LR
LM
Figure3: RelativeeÆcienciesofthePTEbasedontheW,LR andLMtestsforp=5and
=0:05
FromFigure3&4andTable4.1itisobservedthat theperformanceofthePTEswith
respect to the UE is the best at =0. As departs from zero, the relativeeÆciencies
decreaseandcrossthe1-lineatsomesmallvalueof. Foranyxedsamplesize,andfrom
0tosomesmallvalueof(say,
0
)therelativeeÆciencyofthePTEunder themodied
LMtest is thehighestfollowedbythose ofthe PTEsunder themodiedLR andW tests
respectively.
Therefore,for0
0
thefollowinginequalityrelationholds
R
W R
LR R
LM
: (4.1)
Butfrom
0
to somelargevaluesof (say,
1
) therelativeeÆciency ofthe PTE based
onthemodiedWtestisthehighestfollowedbythoseofthePTEsunderthemodiedLR
and LM tests respectively. Therefore, for
0
1
the following inequalityrelation
holds
0
5
10
15
20
25
30
0
2
4
6
8
10
12
∆
Relative efficiency
Original tests for n = 40
1−line
W
LR
LM
0
5
10
15
20
25
30
0
2
4
6
8
10
12
∆
Relative efficiency
Modified tests for n = 40
1−line
W
LR
LM
0
5
10
15
20
25
30
0
2
4
6
8
10
∆
Relative efficiency
Original tests for n = 50
1−line
W
LR
LM
0
5
10
15
20
25
30
0
2
4
6
8
10
∆
Relative efficiency
Modified tests for n = 50
1−line
W
LR
LM
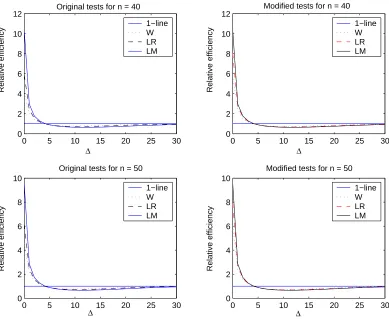
Figure4: RelativeeÆcienciesofthePTEbasedontheW,LRandLMtestsassumingp=5
and=0:05
However,whenisgreaterthan
1
,therelativeeÆcienciesofthePTEsbasedonallthree
tests tendto bethe sameasthat of theUE.Therefore,withrespectto thequadraticrisk
there is nouniform dominationof thePTE basedon any particulartest overthose based
ontheothertestsforallvaluesofandforanyxed. FromTable4.1itisobservedthat
the amount of conict decreases as growslarger upto some moderate value(say,
).
As from some large value of the relative eÆciencies of the PTE under the three tests
approachestothat of theUE,the conict amongthe relativeeÆciencies approachesto0.
Table4.1, andFigures3&4reveal thefactthat theuseofthethreemodiedtests inthe
denition ofthePTE reducestheconict among theirQRsascompared to thatbasedon
thethreeoriginaltests. Forexample,whenn=50and=1theamountofconictamong
theQR ofthe PTEunder the threeoriginal testsis 0:927,whichis 0:453under the three
[image:10.595.112.501.111.430.2]Table4.1: RelativeeÆcienciesofPTEundertheoriginalandmodiedW,LR and
LMtestsforp=5,=0:05andfewvaluesofn,(hereConftstandsforconict).
n=20 n=30 n=50
R
W R
LR R
LM
Conft R
W R
LR R
LM
Conft R
W R
LR R
LM Conft
0 2.724 4.658 18.81 16.09 3.533 5.456 12.08 8.542 4.551 6.170 9.516 4.956
1 1.700 2.217 3.627 1.927 1.912 2.335 3.141 1.229 2.124 2.421 2.853 0.927
2 1.301 1.516 2.030 0.729 1.379 1.546 1.841 0.462 1.453 1.566 1.723 0.270
3 1.098 1.191 1.427 0.329 1.125 1.197 1.329 0.204 1.151 1.199 1.268 0.117
4 0.981 1.011 1.114 0.133 0.983 1.007 1.062 0.079 0.987 1.003 1.030 0.043
5 0.910 0.900 0.926 0.026 0.898 0.892 0.902 0.001 0.890 0.887 0.889 0.003
6 0.866 0.828 0.802 0.064 0.846 0.820 0.798 0.048 0.830 0.814 0.800 0.030
7 0.840 0.781 0.716 0.124 0.815 0.774 0.729 0.086 0.794 0.769 0.742 0.052
8 0.826 0.751 0.655 0.171 0.798 0.745 0.681 0.117 0.774 0.741 0.704 0.070
9 0.821 0.733 0.610 0.211 0.791 0.728 0.649 0.142 0.766 0.726 0.681 0.085
10 0.822 0.723 0.576 0.246 0.791 0.720 0.627 0.164 0.765 0.721 0.668 0.097
12 0.835 0.721 0.534 0.301 0.805 0.724 0.607 0.198 0.780 0.728 0.664 0.116
15 0.869 0.747 0.508 0.361 0.844 0.757 0.615 0.229 0.823 0.768 0.693 0.130
20 0.928 0.821 0.525 0.306 0.914 0.840 0.684 0.230 0.903 0.858 0.785 0.118
25 0.967 0.894 0.585 0.382 0.962 0.914 0.780 0.182 0.957 0.930 0.878 0.079
30 0.987 0.945 0.668 0.319 0.985 0.961 0.869 0.116 0.984 0.971 0.942 0.042
R
W R
LR R
LM
Conft R
W R
LR R
LM
Conft R
W R
LR R
LM Conft
0 4.640 8.666 18.81 14.17 5.349 8.252 12.08 6.726 6.040 7.901 9.516 3.476
1 2.213 2.868 3.627 1.414 2.315 2.758 3.141 0.826 2.400 2.667 2.853 0.453
2 1.514 1.763 2.030 0.516 1.538 1.704 1.841 0.303 1.558 1.656 1.723 0.165
3 1.191 1.303 1.427 0.236 1.194 1.267 1.329 0.135 1.196 1.239 1.268 0.072
4 1.010 1.056 1.114 0.104 1.006 1.034 1.062 0.056 1.002 1.018 1.030 0.028
5 0.900 0.906 0.926 0.026 0.892 0.895 0.902 0.010 0.887 0.887 0.889 0.002
6 0.828 0.808 0.802 0.026 0.821 0.805 0.798 0.023 0.815 0.805 0.800 0.015
7 0.782 0.741 0.716 0.066 0.775 0.746 0.729 0.046 0.770 0.752 0.742 0.028
8 0.752 0.694 0.655 0.097 0.747 0.707 0.681 0.066 0.743 0.719 0.704 0.039
9 0.733 0.662 0.610 0.123 0.731 0.682 0.649 0.082 0.729 0.699 0.681 0.048
10 0.724 0.640 0.576 0.148 0.723 0.666 0.627 0.096 0.723 0.689 0.668 0.055
12 0.722 0.618 0.534 0.188 0.727 0.657 0.607 0.120 0.732 0.690 0.664 0.068
15 0.748 0.621 0.508 0.240 0.761 0.679 0.615 0.146 0.772 0.725 0.693 0.079
20 0.822 0.677 0.525 0.297 0.844 0.759 0.684 0.160 0.861 0.817 0.785 0.076
5 Concluding Remarks
LMtest rather thantheoriginal LMtest Fromtheforegoinganalyses itis observedthat
forboththeoriginalandmodiedtests,withrespecttothequadraticbiastheperformance
of theW test basedpreliminary test estimatoris thebest followedby those basedonthe
LR andLM tests respectively. Ingeneral,theconict among theQBs of thePTEs based
onthemodiedtestsislessthanthatofthePTEsbasedontheoriginaltests. Withrespect
tothequadraticrisk,thereisnouniformdominationofonePTEbasedonaparticulartest
overtheothers forallvaluesof. This istrueforallPTEsunder thethree originaltests
aswellasunderthethreemodiedtests. Asthenon-samplepriorinformationis obtained
fromexpertsknowledgeorpreviousstudies, islikelytobenottoofarfrom0,andhence
ourinterestcenters aroundthevalueof near0. SincetherelativeeÆciency ofthePTE
based on the LM test is the highest near = 0, the practitioners may use the LM test
basedPTEtominimizethequadraticrisk. However,astheuseofthemodiedtestsinthe
denition ofthe PTEreduces theconict amongthe estimatorsitis preferableto usethe
modiedLMtestratherthantheoriginalLMtestintheformationofthePTE.
References
[1] Ahmed, S.E. and Saleh, A.K.Md.E. (1989). Pooling multivariate data. Jou. Statist.
Comput.Simul.31, 149-167
[2] Aitchison,J.andSilvey,D.(1958).Maximumlikelihoodestimationofparameters
sub-jectto restraints.Annals ofMathematical Statistics,29, 813-828.
[3] Anderson, T.W. (1958). An Introduction to Multivariate Statistical Analysis. Wiley,
NewYork.
[4] Bancroft,T.A.(1944).Onbiasesin estimationdueto theuseofthepreliminarytests
ofsignicance.Ann.Math. Statist.,15,190-204.
[5] Billah, M. B. and Saleh, A.K.Md.E. (1998). Conict between pretest estimators
in-ducedbythreelargesampletestsunderaregressionmodelwithstudentst-error.The
Statistician,47,Part4,593-606.
[6] Billah,M.B.andSaleh,A.K.Md.E.(2000).Performanceofthreelargesampletestsin
theactualformationofthepretestestimatorsforregressionmodelwitht-error.Journal
ofAppliedStatisticalScience,9(3),237-251.
[7] Chiou,P.andSaleh,A.K.Md.E.(2002).Preliminarytestcondencesetsforthemeanof
[8] Engle,R.F.(1984).Wald,LikelihoodRatio,andLagrange MultiplierTests in
Econo-metrics,inHandbook ofEconometrics,II,EditedbyZ.GrilichesandM.D.Intriligator,
776-826,North-Holland.
[9] Evans, G.B.A. and Savin, N.E.(1982). Conict among the criteriarevisited: the W,
LRandLMtests.Econometrica,50(3),737-748.
[10] Gallant, A.R. (1975). Seemingly Unrelated Nonlinear Regression. Journal of
Econo-metrics,3,35-50.
[11] Judge,G.G.andBock,M.E.(1978).TheStatisticalImplicationsofPre-testand
Stein-ruleEstimatorsinEconometrics.North-Holland,New York.
[12] Kibria, B.M.G. (2002). Simultaneous Shrinkage Estimation of the Mean Vector of a
MultivariateNormalDistribution.JournalofStatisticalResearch,36(1),29-44.
[13] Rao,C. R.(1947).Largesample testsof statisticalhypothesesconcerningseveral
pa-rameters with applications to problems of estimation. Proceedings of the Cambridge
Philosophical Society,44,50-57.
[14] Rothenberg,T.J.(1977).EdgeworthExpansionsforMultivariateTestStatistics.
Work-ingPaperinEconomicTheory andEconometricsIP-255,CenterforResearchin
Man-agementScience,InstituteofBusinessandEconomicResearch,UniversityofCalifornia,
Berkeley.
[15] Saleh,A.K.Md.E.(1973).Pretestestimatorforthemeanofmultivariatenormal
distri-bution.Carleton Mathematical Series,94,CarletonUniversity,Canada.
[16] Savin,N.E.(1976).Conictamongtestingproceduresinalinearregressionmodelwith
autoregressivedisturbances.Econometrica,44,1303-1315.
[17] Silvey, S.D.(1959). The Lagrange Multiplier test. Annals of Mathematical Statistics,
30,389-407.
[18] Wald,A.(1943):Testsofhypothesesconcerningseveralparameterswhenthenumberof