Rochester Institute of Technology
RIT Scholar Works
Theses
4-2018
On Contact Line Region Heat Transfer, Bubble
Dynamics and Substrate Effects during Boiling
Pruthvik A. Raghupathi
par3002@rit.edu
Follow this and additional works at:https://scholarworks.rit.edu/theses
This Dissertation is brought to you for free and open access by RIT Scholar Works. It has been accepted for inclusion in Theses by an authorized administrator of RIT Scholar Works. For more information, please contactritscholarworks@rit.edu.
Recommended Citation
i
R
.
I
.
T
On Contact Line Region Heat Transfer, Bubble Dynamics
and Substrate Effects during Boiling
by
Pruthvik A. Raghupathi
A dissertation submitted in partial fulfilment of the requirements for the
degree of Doctor of Philosophy in Engineering
Engineering (PhD Program)
Kate Gleason College of Engineering
Rochester Institute of Technology
Rochester, New York
i
On Contact Line Region Heat Transfer, Bubble Dynamics and Substrate Effects during
Boiling
by
Pruthvik A. Raghupathi
Committee Approval:
We, the undersigned committee members, certify that we have advised and/or supervised the candidate on the work described in this dissertation. We further certify that we have reviewed the dissertation manuscript and approve it in partial fulfillment of the requirements of the degree of Doctor of Philosophy in Engineering.
______________________________________________________________________________
Dr. Satish G. Kandlikar (Advisor) Date
James E. Gleason Professor, Mechanical Engineering
______________________________________________________________________________
Dr. Robert Stevens Date
Associate Professor, Mechanical Engineering
______________________________________________________________________________
Dr. Michael Schertzer Date
Assistant Professor, Mechanical Engineering
______________________________________________________________________________
Dr. Jiandi Wan Date
Assistant Professor, Microsystems Engineering
Certified by:
______________________________________________________________________________
Dr. Edward Hensel Date
Director, PhD in Engineering
______________________________________________________________________________
Dr. Doreen D. Edwards Date
ii
Abstract
Kate Gleason College of Engineering
Rochester Institute of Technology
Degree: Doctor of Philosophy Program: Engineering PhD
Author: Pruthvik A. Raghupathi Advisor: Satish G. Kandlikar
Dissertation Title: On Contact Line Region Heat Transfer, Bubble Dynamics and Substrate Effect
during Boiling
Rapid advancement of electronics used in domestic, commercial and military applications has
necessitated the development of thermal management solutions capable of dissipating large
amounts of heat in a reliable and efficient manner. Traditional methods of cooling, including air
and liquid cooling, require large fluid flow rates and temperature differences to remove high heat
fluxes and are therefore unsuited for many advanced applications. Phase change heat transfer,
specifically boiling, is capable of dissipating large heat fluxes with low temperature gradients and
hence is an attractive technique for cooling high heat flux applications. However, due to the
complex interactions between the fluid dynamics, heat transfer, and surface chemistry, the
fundamental physics associated with boiling is not completely understood.
The focus of this work is to get a better understanding of the role played by a nucleating bubble in
removing the heat from the substrate. The interfacial forces acting on a bubble, contact line motion,
and the thermal interaction with the heater surfaces are some of the important considerations which
have not been well understood in literature. The work reported in this dissertation is divided into
three parts. In the first part, an analytical study of the effect of evaporation momentum force on
bubble growth rate and bubble trajectory was conducted. It was shown that the trajectory of a
bubble can be controlled by creating an asymmetric temperature field. This understanding was
used to develop a bubble diverter that increased the Critical Heat Flux (CHF) over a horizontal
tubular surface by 60% and improved the heat transfer coefficient by 75%. In the second part of
the work, additional contact line regions were generated using microgrooves. This enhancement
technique increased the CHF with water by 46% over a plain copper surface to 187 W/cm2. Finally,
the effect of the heater properties and surface fouling during boiling was evaluated. This included
a study on the effect of thermophysical properties of the heater surface on CHF and an investigation
iii
Acknowledgement
There are several people whose help and support was critical in completing this dissertation. On
top of that list would be my advisor Dr. Satish Kandlikar (better known to those of us in the lab as
Dr. K). In addition to his deep knowledge of the field and creativity with which he tackled
challenges what made interactions with him enjoyable was the energy and enthusiasm with which
he approached each day. The positive work culture that he cultivated in the lab helped in making
the lab feel like a second home and made it possible to work late into the night on various projects.
I would like to thank my committee members- Dr. Robert Stevens, Dr. Michael Schertzer, and Dr.
Jiandi Wan for their feedback and encouragement. I am grateful to the director of the Engineering
PhD program- Dr. Edward Hensel for his constant guidance and support.
I am thankful to all the past and present members of the Thermal Analysis, Microfludics and Fuel
Cell Lab for helping me with my work and for their friendship. I would particularly like to thank
Rupak, Ankit, Arvind, Alyssa, Isaac, Travis and Aranya for being wonderful lab mates. I would
also like to thank Austin, Brittany, Gia, and Jean-Patrick for helping with fabrication and running
the tests.
Finally, I would like to thank my dad, mom and sister for being the pillars of strength and support
all my life. Your unconditional love and confidence in me really helped me get through the all
iv
Dedication
v
Table of Contents
1.0 Introduction ... 1
1.1 Background ... 1
1.1.1 Boiling Curve ... 2
1.1.2 Heat Transfer Mechanisms ... 7
1.2 Applications ... 8
1.2.1 Electronics Cooling ... 8
1.2.2 Desalination ... 10
1.2.3 Refrigeration and Air Conditioning ... 10
1.3 Structure of Thesis ... 10
2.0 Literature Review... 13
2.1 Bubble Growth ... 13
2.2 CHF Models ... 18
2.2.1 CHF Description ... 18
2.2.2 Hydrodynamic CHF Models ... 20
2.2.3 Thin Heater Studies... 22
2.4 Contact Line Region ... 25
vi
2.4.2 Heat Transfer in the Contact Line Region ... 32
2.4.3 Contact Line Heat Transfer during Boiling ... 39
2.5 Research Needs ... 45
3.0 Experimental Setup ... 48
3.1 Open Loop Setup ... 48
3.1.1 Experimental Setup ... 48
3.1.2 Test Section ... 50
3.1.3 Test Procedure ... 51
3.2 Closed Loop Setup ... 52
3.2.1 Experimental Setup ... 52
3.2.2 Test Procedure ... 53
3.3 Tubular Test Section ... 54
3.3.1 Experimental Setup ... 54
3.3.2 Test Section ... 55
3.3.3 Test Procedure ... 58
3.4 Uncertainty Analysis ... 58
4.0 Effect of Evaporation Momentum Force on Bubble Dynamics ... 61
4.1 Effect of Evaporation Momentum Force on Bubble Growth ... 62
4.1.1 Expression for Evaporation Momentum Pressure ... 62
vii
4.2 Effect of Evaporation Momentum Force on Bubble Trajectory ... 67
4.2.1 Effect of Thermal Boundary Layer on Evaporation Distribution ... 67
4.2.2 Determining Evaporation Momentum Pressure under Asymmetric Temperature Conditions ... 70
4.2.3 Determining Bubble Displacement Under Asymmetric Temperature Conditions ... 72
4.2.4 Comparison with Experimental Observations ... 75
4.2.5 Conclusion ... 82
4.3 Bubble Induced Flow Field Modulation over Tubular Surfaces ... 84
4.3.1 Onset of CHF Over Plain Tubular Surfaces ... 85
4.3.2 Effect of Bubble Diverter on Bubble Trajectory ... 87
4.3.3 Visualization ... 90
4.3.4 Applicability to Other Fluids ... 92
4.3.5 Conclusion ... 93
5.0 Pool Boiling Enhancement through Contact Line Augmentation ... 95
5.1 Hypothesis... 95
5.2 Experimental Results ... 98
5.3 Visualization ... 102
5.4 Role of Effective Contact Line Length ... 104
5.5 Effect on Heat Transfer Coefficient ... 108
viii
6.0 Effect of Surface Properties and Morphology on Pool Boiling ... 111
6.1 Effect of Thermophysical Properties of Heater Substrate on CHF... 111
6.1.1 Experimental Test Section ... 112
6.1.2 Pool Boiling Results ... 115
6.1.3 Comparison with Hydrodynamic Models ... 116
6.1.4 Effect of Heater Properties on Wall Superheat ... 120
6.1.5 Discussion ... 122
6.1.6 Conclusion ... 125
6.2 Characterization of Pool Boiling Of Seawater and Regulation of Crystallization Fouling by Physical Aberration ... 126
6.2.1 Background on Fouling... 126
6.2.2 Test Setup... 128
6.2.3 Artificial Seawater ... 128
6.2.4 Pool Boiling Results ... 130
6.2.5 Comparison with Rohsenow’s Correlation ... 131
6.2.6 Visualization ... 132
6.2.6 Extended Boiling and Fouling Mitigation ... 134
6.2.7 Conclusion ... 138
7.0 Key Contribution and Future Recommendations ... 140
ix
7.2 Future Recommendations ... 143
8.0 References ... 145
9.0 Appendix ... 155
9.1 Uncertainty Derivation... 155
9.1.1 Heat Flux Uncertainty ... 155
9.1.2 Chip surface temperature derivation ... 156
9.1.3 Heat transfer coefficient uncertainty ... 157
9.2 Publication list ... 159
9.2.1 Journal Papers ... 159
x
List of Figures
Figure 1: General pool boiling curve and a schematic representation of various boiling regimes. 4
Figure 2: Transient heat conduction in the influence region as proposed by Mikic and Rohsenow
[12]. ... 8
Figure 3: CPU power consumption between 2010 and 2020 [19]. ... 9
Figure 4: Bubble growth rate in inertia controlled and heat diffusion controlled regions. ... 14
Figure 5: Effect of contact angle on CHF. Data from Liaw and Dhir [36] and Maracy et al. [35].
Figure adopted from Kandlikar et al. [9]. ... 19
Figure 6: Forces acting on a bubble growing on a heater surface as considered by Kandlikar [42].
... 21
Figure 7: CHF over thin heaters as a function of thermal activity parameter. Figure adapted from
Golobic and Bergles [45]. ... 23
Figure 8: (a) Contact line region in a nucleating bubble and (b) Schematic of the different regions
in the contact line. ... 28
Figure 9: (a) Variation of interfacial curvature under isothermal and non-isothermal conditions,
(b) Liquid temperature variation at the solid-liquid and liquid-vapor interface, and (c) Contribution
of Marangoni, capillary and disjoining pressure towards fluid flow [58] ... 32
Figure 10: Heat flux along the thin film for different wall superheats using equation from Schrage
[69] and Wayner et al. [71] [72]. ... 35
Figure 11: Effect of superheat on total heat transfer rate in a thin film for/using constant and
variable thermophysical properties [85]. ... 37
xi
Figure 13: Schematic of the vertically constrained vapor bubble setup used to study thin film
evaporation (adopted from [93]). ... 39
Figure 14: Variation of heat flow into a bubble with time and the contribution of microlayer evaporation [18]. ... 42
Figure 15: Average heat flux in the radial direction Curves 1-5: growing bubble and curves 6-13: receding bubble (time step-5 ms) [109]. ... 44
Figure 16: a) Side view of the liquid meniscus on a rotating heater surface and [112] b) temperature field inside the meniscus [113]. ... 45
Figure 17: Schematic of the open loop pool boiling setup. ... 48
Figure 18: Test section a) boiling area and b) thermocouple spacing. ... 50
Figure 19: Closed loop test setup. ... 52
Figure 20: CAD rendering of test setup. ... 54
Figure 21: CAD rendering of test assembly. ... 55
Figure 22: Schematic showing test section geometry and thermocouple location. ... 56
Figure 23: Schematic showing mass transfer and relative velocities of liquid and vapor at the bubble interface. ... 62
Figure 24: Change in the bubble radius vs time computed using Eq. 46... 66
Figure 25: Contour plot showing temperature distribution in the liquid during bubble growth [117]. ... 69
xii
Figure 27: Schematic of a bubble subjected to an asymmetric temperature distribution and the
resultant evaporation momentum force experienced by the bubble, T2>T1. ... 73
Figure 28: Drag coefficient of a bubble vs Reynolds number [119]. ... 74
Figure 29: Schematic of the experimental test section consisting of a grooved copper surface filled
with an insulating epoxy. ... 75
Figure 30: (a)-(e): Image sequence showing horizontal displacement of the bubble. The bubble is
seen after nucleation shown by ‘A’ in the image and departs after 2.5 ms after being displaced by
a distance ‘D’. ... 78
Figure 31: (a) Schematic of the 2D model used to simulate surface temperature distribution, (b)
temperature contour near the top of the test section and (c) temperature along the heater surface.
... 80
Figure 32: Observed and predicted horizontal displacement of the bubble for different effective
boundary layer thicknesses (δ). ... 81
Figure 33: Temperature variation (5 Hz sampling frequency) along the circumference of the tube
during the onset of CHF; temperature spike first observed at the bottom thermocouple. ... 86
Figure 34: Ratio of EMF to buoyancy force for a bubble nucleating at the base of the diverter as a
function of time for water at 5°C, 10°C and 15°C wall superheats; Insert: Direction in which
evaporation momentum force and buoyancy acts on a bubble at the base. ... 88
Figure 35: (a) HTC vs heat flux for plain tube and tube with bubble diverter, and (b) circumferential
temperature profile during onset of CHF for a tube with a bubble diverter. ... 89
Figure 36: Bubble displacement captured using high speed imaging at 4000 fps. Bubble nucleation
observed in (a) and displacement from the fin is shown in (b-d). ... 90
xiii
Figure 38 (a) Schematic of bubble growth over a microgrooved surface and generation of contact
line at the base of the bubble and (b) bubble pinning observed on 100 micron deep microgrooved
surface. ... 98
Figure 39: Confocal image of 400 μm wide 20 μm deep microgrooves and (b) 300 μm wide and 20 μm deep microgroove. ... 98
Figure 40: Pool boiling curves for some of the surfaces tested. ... 100
Figure 41: CHF (wetted area) vs groove width for the grooves tested. ... 102
Figure 42 (a-f): Bubble growing over multiple grooves on a 200 μm wide, 20 μm deep grooves. ... 102
Figure 43, and (e-g) bubble constrained within a groove on a 200 μm wide 100 μm deep microgrooved surface (yellow dotted lines indicate the location of the groove walls). ... 104
Figure 44: Schematic of a bubble growing over a microgrooved surface and the additional contact line regions generated. ... 105
Figure 45: CHF (wetted area) vs contact line length. ... 107
Figure 46: Contact line length vs microgroove width. ... 107
Figure 47: Heat transfer coefficient vs contact line length. ... 108
Figure 48: Pool boiling curves for the surfaces tested. The red arrows indicate the last measured data point before CHF was observed. ... 115
Figure 49: Variation of CHF as a function of the receding contact angle. Predicted CHF computed using Kandlikar’s [42] model. ... 117
Figure 50: Variation of normalized CHF as a function of a) thermal conductivity, b) thermal diffusivity, and c) thermal mass. ... 118
xiv
Figure 52: Variation of wall superheat as a function of a) thermal mass, b) thermal conductivity,
and c) thermal diffusivity. ... 121
Figure 53: Asymptotic heater thickness as a function of a) thermal activity parameter (ρCpk)-0.5
and b) k-0.5 [45]... 123
Figure 54: Pool boiling curve for seawater and distilled water. ... 130
Figure 55: Bubble growth rate for distilled water and seawater at a heat flux of 13 W/cm2. ... 134
Figure 56: Variation of wall superheat when the heat flux is maintained over 125 W/cm2 for a
sustained period of time for seawater a) without beads and b) with beads... 135
Figure 57: Laser confocal images of the heater surface a) before boiling, b) after a single pool
boiling test c) after an extended boiling test without beads, and d) after an extended boiling test
xv
List of Tables
Table 1: Asymptotic heater thickness for various heater materials ... 24
Table 2: Parameters contributing to uncertainity ... 59
Table 3: K3 values for various fluids corresponding to reported CHF values [131–133] ... 92
Table 4: CHF (wetted area) and wall superheat recorded for each of the surfaces tested and the predicted CHF using the roughness model ... 99
Table 5: Thermal properties and roughness of the substrates tested ... 114
Table 6: Composition of synthetic seawater ... 129
xvi
Nomenclature
Term Description Units
A Parameter defined by Mikic et al.[1] m/s
A
∗ Hamaker constant JA1 and A2 Coefficients used by Plesset and Zwick [2]
𝐴
𝑏 Cross-sectional area of the bubble m2B Parameter defined by Mikic et al. [1] m.s-0.5
B
∗ Dispersion constant N.m2B
x Bias errorb Shape factor defined by Mikic et al. [1]
c Constant of proportionality used in Eq. 47 kg/m2-K-s
𝐶𝐷 Coefficient of drag
𝐶𝑠𝑓 Solid-liquid coefficient used by Rohsenow [3]
𝑐𝑝 Specific heat J/kg-K
D Diameter m
FD Drag force N
𝐹𝑀 Evaporation momentum force N
g Acceleration due to gravity m/s2
ℎ𝑙𝑣 Latent heat J/kg
I Current Amps
J Interfacial curvature m-1
𝐽𝑎 Jacob number
K Non dimensional number to predict CHF proposed by
Kutateladze [4]
xvii
𝐾3 Non dimensional ratio of evaporation momentum force to
buoyancy
k Thermal conductivity W/m-K
L Microgroove length per unit area m-1
𝑀𝑤 Molecular weight kg/mol
P Pressure N/m2
p Long range intermolecular forces N/m
Px Precision error
Pr Prandtl number
𝑃𝑀 Evaporation momentum pressure N/m2
𝑞′′ Heat flux W/cm2
𝑞𝑐′′ Critical heat flux W/m2
𝑞′′
𝑎𝑠𝑦 Asymptotic critical heat flux W/m2
R Bubble radius m
𝑅̅ Gas constant
N-m/(k-mol)
𝑅𝑜 Initial bubble radius m
R+ Non dimensional bubble radius defined by Mikic et al. [1]
𝑅̇ Bubble growth rate m/s
r Radial distance m
𝑟
1 Radial distance of the thermocouple m𝑟
2 Radial distance of the heater surface mrc Cavity radius m
𝑟
∗ Surface roughness mT Temperature °C
Tsat Saturation temperature °C
xviii
Twall Wall temperature °C
T* Non dimensional degree of subcooling
t Time s
t+ Non dimensional time defined by Mikic et al. [1]
tw+ Non dimensional wait time defined by Mikic et al. [1]
Ux Uncertainty
u Velocity m/s
V Voltage V
W Work done J
x Distance m
𝛼 Thermal diffusivity m2/s
𝛼∗ Fluid specific coefficient used by Holm and Gopeln [57]
𝛽∗ Fluid specific coefficient used by Holm and Gopeln [57]
𝛾 Interfacial tension N/m
𝛿 Liquid film thickness m
𝛿ℎ Thickness of the heater m
𝛿𝑡 Thermal boundary layer thickness m
Γ
Mass transfer rate kg/sμ Dynamic viscosity kg/m-s
𝜃 Contact angle °
𝜗𝑙 Kinematic viscosity m2/s
Π Disjoining pressure N/m2
η Evaporative mass flux kg/m2
𝜌 Density kg/m3
𝜎 Surface tension N/m
𝜎̂ Accommodation coefficient
1
Chapter 1
1.0
Introduction
Boiling is a phase change process in which vapor bubbles are formed on a heated surface and/or
in a superheated liquid. Boiling has been used as a mode of heat transfer for thousands of years
and has now become ubiquitous with a wide variety of domestic and industrial applications
including electricity generation in power plants, heating and cooling, desalination and dissipation
of high heat fluxes from electronic devices among others. Extensive research conducted over the
last five decades using state of the art tools for measurement and imaging have helped develop a
better understanding of the fundamentals of boiling and in turn have helped develop more efficient
heat transfer surfaces. Specifically, research over the past decade has been largely focused on
developing boiling surfaces that are able dissipate large amounts under both static and mobile
conditions. Even after being the focus of many years of research the physics of boiling heat transfer
is yet to be mastered due to the complex interaction between fluid dynamics, heat transfer and
surface chemistry. Understanding the effect of bubble dynamics, heat transfer in the contact line
region and the effect of surface properties and morphology on boiling and applying that
understanding to develop surface enhancements will be the focus of this thesis.
1.1 Background
The two main modes of heat transfer between a solid and a liquid are single phase and two phase
heat transfer. Single phase heat transfer is a process where heat from the substrate only results in
an increase in the temperature of the liquid. This increase in temperature is dependent on the
specific heat of the liquid. The heat transfer coefficient, a measure of the efficiency of the heat
2
solid-liquid boundary increases with time creating a resistance for heat transfer. Under two phase
heat transfer, in addition to sensible heating, heat from the substrate evaporates the liquid into
vapor. This process is far more efficient than single phase heat transfer since the heat required to
evaporate the liquid, known as latent heat, is significantly greater than the specific heat. The
temperature rise on the bulk liquid is also limited under two phase heat transfer since liquid begins
to evaporate beyond saturation temperature. Boiling defers from evaporation at a preexisting
liquid-vapor interface as it involves generation of these interfaces at discrete sites.
Based on the motion of the liquid relative to the heater surface, boiling can be classified as pool
boiling and flow boiling. Pool boiling refers to the boiling under natural convection conditions
where the bulk liquid is quiescent relative to the heater surface, while flow boiling refers to boiling
while the bulk liquid moves over the heater surface. In case of pool boiling the growth and
departure of bubbles is the main reason for liquid motion and in flow boiling the presence of an
external force also aids in the mixing of the liquid.
1.1.1 Boiling Curve
In pool boiling, the temperature of the heater surface and the heat flux over the heater are directly
related, with surface temperature increasing as the heat flux across the surface increases. Broadly,
there are two types of boiling systems: a heat flux controlled system and a temperature controlled
system. In a heat flux controlled system, the amount of power provided to the heater is regulated
and the surface temperature is dependent on the heat flux input to the system. In a temperature
controlled system, the heater surface temperature is directly controlled, typically by having a
secondary heat exchange process on the other side of the heater surface. The relationship between
the heat flux over the surface and the surface temperature was first studied by Nukiyama [5]. A
3
identify the various boiling regimes. Figure 1 shows a typical pool boiling curve for a heat flux
controlled horizontal plate or wire. Heat flux is the rate of heat transfer per unit area and the wall
superheat is the difference between the heater surface temperature and the saturation temperature
of the liquid corresponding to the operating temperature. The red arrows indicate the plot traced
as the heat flux is increased and the blue arrows indicate the plot traced as the heat flux is reduced.
Five different regimes can be identified in boiling and they are
i) Natural convection
ii) Partial nucleate boiling
iii) Fully developed nucleate boiling
iv) Transition boiling
4
[image:24.612.90.529.65.328.2]
Figure 1: General pool boiling curve and a schematic representation of various boiling regimes.
As the input heat flux to the surface increases, the first regime of heat transfer is natural convection
observed between points ‘o’ and ‘a’ in Figure 1. The low wall superheats in this regime are not
sufficient to initiate bubble nucleation and therefore heat transfer to the bulk liquid is through
natural convection. As the input heat flux increases, a thermal boundary layer develops over the
heater surface with the liquid within the boundary layer being superheated. At point ‘a’, the wall
superheat is sufficient for bubble nucleation and the first vapor bubbles begin to grow on the heater
surface. This point is the onset of nucleate boiling (ONB). Bubble nucleation on a heated surface
was studied by several researchers including Hsu [6], Hsu and Graham [7], and Kandlikar and
Spiesman [8]. The wall superheat at which bubble nucleation is observed for a given cavity
diameter is given by,
∆𝑇 =
2𝜎𝑇𝑠𝑎𝑡5
where 𝐾𝑚𝑎𝑥 is the maximum non-dimensional curvature of the interface. The range of cavity radii
where nucleation can occur at a particular wall superheat was initially proposed by Hsu [6] and
was later modified by Kandlikar et al. [9] and is given by
(𝑟
𝑐,𝑚𝑎𝑥, 𝑟
𝑐,𝑚𝑖𝑛) =
𝛿𝑡sin 𝜃 2.2(
∆𝑇𝑠𝑎𝑡
∆𝑇𝑠𝑎𝑡+ ∆𝑇𝑠𝑢𝑏
) [1 ± √
8.8𝜎𝑇𝑠𝑎𝑡 (∆𝑇𝑠𝑎𝑡+ ∆𝑇𝑠𝑢𝑏)
𝜌𝑣ℎ𝑙𝑣𝛿𝑡𝑇𝑠𝑎𝑡 2
]
(2)After the first bubble has nucleated, a large number of cavities on the surface of the heater are
activated and boiling is observed throughout the surface of the heater. A temperature drop is
sometimes observed at ONB due to the increase in heat transfer coefficient as a result of the sudden
increase in the number of sites where nucleation occurs. Between point ‘a’ and point ‘c’, partial
nucleate boiling is observed. During partial nucleate boiling, nucleation is observed at distinct
locations on the heater surface and there is little interaction between bubbles at different cavities.
The density of active nucleation sites and the frequency of bubble formation from nucleation sites
increases as the heat flux increases. This results in the slope of the boiling curve increasing
significantly beyond point ‘a’.
As the heat flux increases, isolated bubbles begin to coalesce in the vertical direction to form vapor
jets or columns. This represents the transition of the boiling regime from partial nucleate boiling
to fully developed nucleate boiling and is observed between points ‘c’ and ‘d’. In addition to the
bubbles merging in the vertical direction, lateral coalescence of bubbles are observed leading to
the formation of mushroom-like bubble structures. During fully developed nucleate boiling, a point
of inflection is observed close to point ‘d’ where the heat transfer coefficient is highest.
At point ‘d’, the maximum heat flux possible during nucleate boiling is reached. This point is
6
prevents the liquid from touching the heater surface. The layer of vapor drastically reduces the
heat transfer coefficient of the surface and hence the temperature of the heater rises almost
instantaneously and the system moves from point ‘d’ to point ‘e’.
Transition boiling
After reaching CHF the boiling mechanism instantly changes from fully developed nucleate
boiling to film boiling. The change is accompanied by a sudden rise in temperature indicated by
the dotted line between ‘d’ and ‘e’ in Figure 1. However, in a temperature controlled system the
heat flux drops as the surface temperature increases and the boiling regime is described as
transition boiling. During transition boiling an unstable vapor layer is established on the surface
that is intermittently removed. Point ‘f’ is the minimum heat flux point (also known as Leidenfrost
point). The presence of the vapor layer reduces the efficiency of heat transfer thereby decreasing
the heat transfer coefficient as the heat flux increases. After point ‘f’ the vapor film becomes stable
and the boiling regime changes to film boiling.
Film boiling
Upon formation of a stable film layer the boiling regime changes from transition boiling to film
boiling. In the case of a heat flux controlled system, film boiling is observed immediately after
CHF is reached without traversing the transition boiling region. Since the surface is completely
covered by a layer of vapor and most of the heat is transferred through radiation, the heat transfer
coefficient is very low. In a heat flux controlled system, the surface temperature increases until the
radiative heat flux becomes equal to the input heat flux. Since most systems cannot handle the high
temperatures associated with film boiling they are maintained below CHF in the nucleate boiling
7
1.1.2 Heat Transfer Mechanisms
One of the areas researchers have focused on is the modes of heat transfer from the heater to the
liquid during boiling. Three main modes of heat transfer have been identified during nucleate
boiling: i) microconvection, ii) transient conduction, and iii) microlayer evaporation modes of heat
transfer have been widely reported and they are:
Microconvection: the rapid motion of the liquid-vapor interface during the bubble ebullition
creates convective currents adjacent to the bubble base area. Adiabatic solid sphere experiments
by Han and Griffith [10] showed that the microconvection currents influence a region that is twice
the bubble departure diameter. At higher heat fluxes, the bubble frequency increases and
consequently the contribution of microconvection heat transfer also increases. Rohsenow [11] first
proposed that convection due to bubble departure was responsible for enhanced heat transfer
during boiling. Forced convection correlations were modified by computing the Reynold’s number
based on bubble diameter and a relation between the wall super heat and heat flux was proposed
and is given by
𝐶𝑝∆𝑇
ℎ𝑓𝑔
= 𝐶
𝑠𝑓[
𝑞′′ 𝜇𝑙ℎ𝑓𝑔√(
𝜎 𝑔(𝜌𝑙−𝜌𝑣)
)]
0.33
𝑃𝑟
𝑙1.7 (3)where 𝐶𝑠𝑓 is a coefficient specific to the liquid-solid combination.
Transient conduction: This refers to the transient heat transfer to the bulk liquid that rewets the
heater surface upon bubble departure and corresponding removal of the liquid from the thermal
boundary layer. Han and Griffith [10] and Mikic and Rohsenow [12] initially studied transient
conduction and proposed that transient conduction is observed throughout the influence region of
the bubble (twice the bubble departure diameter). Figure 2 shows a schematic of the region where
8
Moghadam and Keiger [13,14] suggested that only the region under the bubble is subjected to
transient conduction as the liquid front rewets the surface during bubble departure. Consensus on
the region where transient conduction is effective is still missing/elusive.
Figure 2: Transient heat conduction in the influence region as proposed by Mikic and Rohsenow
[12].
Microlayer evaporation: The microlayer is a thin liquid film that develops between the bubble
and the heater surface during bubble growth. The microlayer develops due to the no slip boundary
condition at the heater surface. It was initially studied by Moore and Mesler [15], and Cooper and
Lloyd [16]. Since the microlayer is just a few microns thick, the resistance to conduction is very
low in this region and therefore heat transfer between the heater and the liquid-vapor interface is
very high. As a result, the microlayer evaporates rapidly leading to a drop in the temperature under
the bubble. The contribution of microlayer heat transfer has been widely debated [13,14,17,18]
and depends on the properties of the liquid with the contribution of microlayer evaporation being
higher for liquids with large latent heats.
1.2 Applications
9
Thermal management of electronic devices has been a challenge since the inception of the industry.
Cooling of certain components in electronic devices such as the processor and power electronics
is particularly challenging since the heat fluxes generated are very high and maintaining the device
temperature is critical to its functioning. One of the applications where two phase cooling is being
widely researched is cooling of high performance computers (supercomputers) and data centers.
Figure 3 shows power consumption of CPUs between 2010 and 2010. It is clear that the power
density in data center racks has been rapidly increasing. Air cooling is currently the most widely
used cooling technique and single phase liquid cooling has been used in certain high performance
applications. Due to the relatively low heat transfer coefficients associated with these cooling
techniques, large volumetric flow rates will be required to keep up with the ever increasing thermal
demand and inefficient cooling of local hotspots. Since two phase cooling can dissipate much
higher heat fluxes at significantly lower wall superheats it can be an effective solution to dissipate
[image:29.612.119.491.441.682.2]large amounts of heat from electronic devices.
10
1.2.2 Desalination
A growing proportion of the water requirements of water-starved large cities is being met by
desalination plants. Factors such as population growth, urbanization, industrialization and climate
change are expected to accelerate the need for desalinated water [20]. A report by the global water
intelligence estimates that the need for desalinated water is expected to increase from 1% currently
to 14% by 2025 [21]. Thermal desalination techniques boil or evaporate seawater to produce fresh
portable water. In the coming years, integration of desalination plants with renewable power
sources are expected to become increasingly popular as the world moves towards cleaner sources
of energy [22]. Using the heat generated in solar concentrators, geothermal units and nuclear
reactors to operate the thermal desalination units can also potentially produce large amounts of
fresh water at very low costs.
1.2.3 Refrigeration and Air Conditioning
Boiling is extensively used in refrigeration and air conditioning for domestic and commercial
applications. The refrigeration and air conditioning industry is one of the largest consumers of
power in the U.S. responsible for 30 % and 7% of the total power consumption in the commercial
and manufacturing sectors in the U.S. respectively. In these systems, boiling heat transfer can be
seen on tube bundles and microchannel heat exchangers in flooded evaporators and chillers. The
working fluid in these systems are typically refrigerants that have low thermal conductivity and
latent heat (relative to water) and therefore are poor heat transfer fluids. Since the efficiency of the
system is directly dependent on the heat transfer coefficient at the evaporator section, improving
the boiling performance can have a direct impact on the size and operational cost of the system.
11
Chapter 1: Introduction- An overview of the basic concepts in boiling heat transfer, the main
advantages of boiling heat transfer and its application
Chapter 2: Literature Review- A review of the research related to the three aspects of boiling
heat transfer studied in this work: i) Bubble growth models, ii) CHF models- Hydrodynamic and
thin heater models, and iii) forces acting in the contact line region and the nature of heat transfer
in the region.
Chapter 3: Experimental Setup- Description of the three experimental setups used during the
study- an open loop and a closed loop setup to test flat surfaces and an open loop setup to test
tubular surface. Additionally the test procedure, data acquisition and the uncertainty analysis
conducted are also explained.
Chapter 4: Effect of Evaporation Momentum Force on Bubble Dynamics- The effect of
evaporation momentum force on bubble growth rate is analytically modeled. Later, the trajectory
of a bubble subjected to an asymmetric temperature field is evaluated. High speed visualization is
used to validate the analytical predictions. Finally, the findings are applied to develop a surface
enhancement on tubular surfaces that increases the CHF and heat transfer coefficient by modifying
the trajectory of a nucleating bubble.
Chapter 5: Pool Boiling Enhancement through Contact Line Augmentation- Microgrooved
surfaces that are designed to increase the pool boiling performance by increasing the contribution
of contact line heat transfer during boiling are discussed. High speed visualization is used to
understand the role of the contact line region heat transfer and bubble dynamics over microgrooved
12
Chapter 6: Effect of Surface Properties and Morphology on Pool Boiling- The effect of the
thermophysical properties of the heater surface on the CHF over thick heaters is experimentally
studied. In the second part of the study, the pool boiling performance with seawater is evaluated
and a passive method to reduce crystallization fouling through physical aberration is described.
Chapter 7: Summary and Future Recommendations- Some key contributions and societal
impact of the work are outlined in this section. Future research recommendations are also
presented.
13
Chapter 2
2.0 Literature Review
2.1 Bubble Growth
The growth rate of a bubble in a superheated liquid or nucleating on a heated surface has been
studied by several researchers over the past five decades [1,23–25]. The growth rate of a bubble
varies significantly between bubble nucleation and bubble departure and is influenced by the
thermophysical properties of the liquid, the operating pressure, the wall/liquid superheat and the
gravitational field. Broadly, the growth of a bubble can be divided into the inertia controlled phase
and the temperature controlled phase. Figure 4 shows a generic plot of bubble radius vs time. In
the initial stages of bubble growth, a small amount of evaporation at the bubble interface leads to
a significant increase in the bubble radius. Additionally, as the bubble radius increases, the vapor
pressure within the bubble reduces as the surface tension on the bubble reduces. This leads to a
reduction in the saturation temperature and the temperature gradient at the liquid-vapor interface
increases. Therefore, in the initial stages the limiting factor for bubble growth is the displacement
of the liquid around the bubble. This is the phase where the growth rate of the bubble is highest.
Some of the earliest work to predict bubble growth was conducted by Rayleigh [26] while
investigating cavitation. The model developed by Rayleigh does not account for the effect of
temperature variation on bubble growth and can be used to predict bubble growth rate in the inertia
14
Figure 4: Bubble growth rate in inertia controlled and heat diffusion controlled regions.
As the bubble diameter increases, continued evaporation of the liquid results in a thermal boundary
layer developing around the bubble. The growth of the boundary layer results in a reduction in the
temperature gradient at the liquid-vapor interface and therefore the bubble growth rate also
reduces. This phase of bubble growth can be described as the heat flux limited phase. Theoretical
models to predict bubble growth while accounting for a temperature gradient at the liquid-vapor
interface have been modeled by Forster and Zuber [23], Plesset and Zwick [2], Scriven [24],
Skinner and Bankoff [27] and Mikic et al. [1]. A brief description of some of the most popular
bubble growth models are given below.
Rayleigh-Plesset model: The Rayleigh-Plesset equation is an ordinary differential equation which
describes the growth of a spherical bubble in an infinite body of liquid. It was developed to model
liquid cavitation and hence does not include any heat transfer term. Since the initial phase of bubble
15
of a bubble. The variation of radial velocity in the liquid domain as a result of bubble growth can
be given by
𝑢(𝑟, 𝑡) =
𝑅𝑟22𝑑𝑅𝑑𝑡(4)
where R is the radius of the bubble. Upon expressing the radial velocity in the liquid in terms of
the bubble growth rate in the Navier-Stokes equation, the bubble growth rate can be expressed as
𝑃(𝑅)−𝑃(∞)
𝜌𝑙
= 𝑅
𝑑2𝑅 𝑑𝑡2
+
3 2
(
𝑑𝑅 𝑑𝑡)
2 (5)Eq. 5 is known as Rayleigh’s equation for bubble growth. This was extended by Plesset and Zwick
to account for the viscous effects. Expressing P(R) in terms of the vapor pressure inside the bubble,
the Rayleigh-Plesset equation can be written as
𝑃𝑣−𝑃𝑙
𝜌𝑙
= 𝑅
𝑑2𝑅 𝑑𝑡2
+
3 2
(
𝑑𝑅 𝑑𝑡
)
2
+
4𝜗𝑙𝑅 𝑑𝑅
𝑑𝑡
+
2𝜎𝜌𝑙𝑅 (6)
Plesset [28] later modified the equation to account for viscous forces due to liquid displacement
and surface tension changes.
Plesset and Zwick [2]: As the bubble grows past the inertia controlled growth phase the transfer
of heat from the liquid surrounding the bubble becomes the limiting factor for bubble growth.
Plesset and Zwick extended the Rayleigh solution by accounting for the heat diffusion into the
bubble. A non-dimensional differential equation was proposed to describe bubble growth in a
superheated liquid. An approximate solution for initial phases of bubble growth shows an
exponential behavior and is given by
16
As the bubble grows, a thermal boundary layer develops next to the liquid-vapor which results in
a reduction in the bubble growth rate. An asymptotic approximation to describe bubble growth in
the heat flux limited regime can be given by
𝑅(𝑡) = 2
𝜋12
𝐽𝑎(𝛼𝑡)12 (8)
Mikic et al. [1]: Mikic et al. [1] proposed a simple non-dimensional polynomial equation that can
be used to predict bubble growth rates in both uniform and non-uniform temperature fields. The
model used a force balance approach to predict the growth rate in the inertia controlled phase and
incorporated the growth rate expressions proposed by Plesset and Zwick [2] to predict the growth
rate in the heat diffusion controlled phase. The growth of non-spherical bubbles like those seen on
heated surfaces can also be predicted using the model by varying a shape factor term in the model.
The expression for bubble growth in the inertia controlled phase was obtained by equating the
work done by the bubble on the liquid to the total kinetic energy of the liquid. This resulted in the
equation:
(
𝑑𝑅𝑑𝑡)
2= 𝐴
2 𝑇𝑣−𝑇𝑠𝑎𝑡∆𝑇 (9)
where ∆𝑇 = 𝑇∞− 𝑇𝑠𝑎𝑡 and
𝐴 = (
𝑏ℎ𝑓𝑔𝜌𝑣∆𝑇 𝜌𝑙𝑇𝑠𝑎𝑡
)
1 2
The growth rate of a bubble in the heat diffusion controlled phase developed by Plesset and Zwick
[2] was used. The growth rate was rewritten as
𝑑𝑅 𝑑𝑡
=
1 2 𝐵 √𝑡(
𝑇∞−𝑇𝑣
17 where
𝐵 = (
12𝜋
𝛼)
1 2𝐽𝑎
and
𝐽𝑎 =
∆𝑇𝑐𝑝𝜌𝑙 ℎ𝑓𝑔𝜌𝑣Combining Eq. 9 and Eq. 10, an equation describing bubble growth in a uniformly heated liquid
domain was obtained and is given by,
𝑅
+=
23
((𝑡
+
+ 1)
32− (𝑡
+)
32)
(11)R+ and t+ are non-dimensional terms which describe radius and time respectively and are given by
𝑅
+=
𝐴𝑅𝐵2 and
𝑡
+=
𝐴2𝑡𝐵2
The results were extended to non-uniform temperature fields similar to those present in nucleate
boiling on a heated surface and is given by
𝑅
+= (𝑡
+)
0.5{1 − 𝑇
∗[(1 +
𝑡𝑤+ 𝑡+)
0.5
− (
𝑡𝑤+ 𝑡+)
0.5
]}
(12)The model proposed by Mikic et al. accurately predicts bubble growth under various conditions
and is widely used. Since the bubble radius and time are expressed in non-dimensional terms, the
18
2.2 CHF Models
2.2.1 CHF Description
Critical heat flux is the maximum heat flux that can be achieved under fully developed nucleate
boiling conditions. Further increase in heater temperature or heat flux results in the transition from
nucleate boiling to film boiling. Upon reaching CHF, the temperature of the heater rapidly
increases (for heat flux controlled systems) often leading to considerable damage to the heater and
sometimes leading to meltdown. The onset of CHF corresponds to the formation of a thin vapor
film between the heater surface and the bulk liquid. Since the thermal conductivity of vapor is
orders of magnitude lower than the bulk liquid, conduction heat transfer from the heater to the bulk
liquid drastically reduces with the formation of vapor layer over the heater surface and most of the
heat transfer occurs through radiation. For a plain heater surface, multiple factors that affect the
CHF have been identified. These include liquid properties like density, surface tension, viscosity
and latent heat; interfacial properties such as contact angle for the heater-liquid pair; system
conditions like orientation of the heater surface, gravity and system pressure; and heater properties
such as surface roughness, density, specific heat, thermal conductivity and heater thickness.
Surface roughness: The effect of surface roughness on CHF has been widely investigated with
multiple works concluding that an increase in surface roughness leads to an increase in CHF.
Berenson [29] studied the effect of roughness with n-pentane as the working fluid and showed that
surfaces that are mirror finished had a 20% lower CHF than rough surfaces (polished with #60
emery paper). Similarly, experimental works from Ramilson and Lienhard [30] and Haramura [31]
have shown that surface roughness can enhance the CHF over a surface up to 35%. However, in a
19
roughness values between 0.01 and 2.62 and found that there is no significant increase in CHF due
to an increase in roughness.
Surface wettability: The effect of surface wettability on CHF has been studied by many researchers
including Costello and Frea [33], Kirishenko and Cherniakov [34], Maracy and Winterton [35],
Liaw and Dhir [36] and O’Hanley et. [32]. Costello and Frea found that CHF increases as the
wettability of the heater surface increases. Liaw and Dhir [36] controlled the wettability of the
surface by varying the degree of oxidization of the surface. This was believed to be because the
removal process of the vapor bubbles from the heater surface becomes more efficient as the surface
becomes more wetting. Figure 5 shows the experimental results of CHF as a function of contact
[image:39.612.140.481.367.641.2]angle from Liaw and Dhir [36] and Maracy et al. [35].
Figure 5: Effect of contact angle on CHF. Data from Liaw and Dhir [36] and Maracy et al.
20
Heater size: Shoji et al. [37] studied the effect of heater size on CHF using horizontally oriented
stainless steel ribbon heaters in water. It was seen that the CHF increased as the heater width
decreased with the CHF on 0.2 mm wide heaters being four times higher than wider heaters.
However similar studies on cylindrical heaters showed that CHF increased as the radius of the
cylindrical heaters increased. The divergence in the trends has been associated with the different
bubble departure mechanisms.
2.2.2 Hydrodynamic CHF Models
The prediction of critical heat flux (CHF) over a heater surface is one of the most widely studied
aspects of pool boiling. The models for predicting CHF can be largely classified into
hydrodynamic, interfacial and surface effect based. One of the proposed theories for the onset of
CHF is the vapor escape instability model. Kutateladze [4] proposed that at high heat fluxes
separate liquid and vapor columns are formed and CHF is reached when the two phase flow near
the heater surface becomes unstable. It was proposed that the flow becomes unstable when the
vapor velocity increases beyond a critical value. Kutateladze performed a dimensional analysis
and proposed the following expression to predict the onset of CHF
𝑞𝑐′′
ℎ𝑓𝑔𝜌𝑔0.5[𝜎𝑔(𝜌𝑙−𝜌𝑔)] 1 4
= 𝐾
(13)
For pool boiling on a horizontal surface, the value of the constant K used in the above equation
was experimentally determined to be 0.16. Zuber [38] extended the work by assuming that the
diameter of the vapor columns produced at high heat fluxes is half of the Rayleigh-Taylor
wavelength. Further, the maximum velocity of the vapor in the vapor column was assumed to be
limited by the Kelvin-Helmholtz instability function. Following this approach, the value of K as
21
changed to 0.131. Lienhard and Dhir [39] modified the expression for maximum vapor velocity
and included the effect of heater geometry to predict the CHF in finite geometries such as vertical
plates and cylinders. The modified expression suggested that Zuber’s model under predicted the
CHF of a surface by 14%.
Instead of the vertical coalescence model proposed by Kutateladze and Zuber, some researchers
proposed an alternate approach and assumed that the bubbles coalesce in the horizontal direction
to form vapor mushrooms. Katto and Yokoya [40] proposed that a liquid macrolayer is formed
between coalescing vapor bubbles and CHF occurs when the macrolayer dries out before the
departure of the coalesced bubble. Haramura and Katto [41] further refined the dryout model by
assuming that the thickness of the trapped macrolayer is one-fourth the Kelvin-Helmholtz
wavelength. An energy balance approach was used to determine the heat flux required to evaporate
the macrolayer before the departure of the coalesced bubble. The final equation arrived at was
[image:41.612.125.482.448.655.2]similar to the one proposed by Kutateladze with a K value of 0.131.
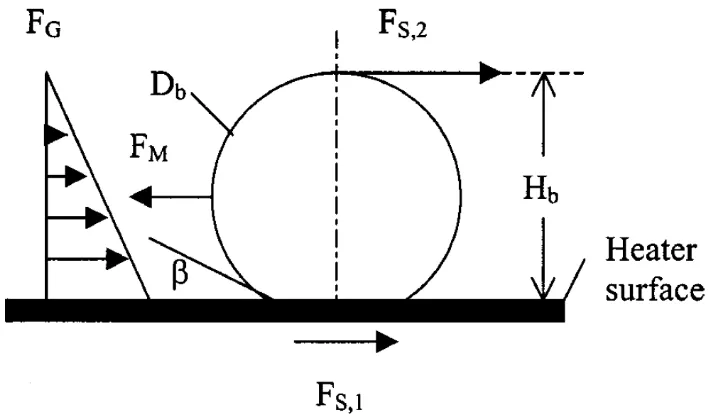
Figure 6: Forces acting on a bubble growing on a heater surface as considered by
22
Kandlikar [42] incorporated the effect of dynamic receding contact angle in the CHF model by
using a force balance approach to predict the onset of CHF. Figure 6 shows the forces acting on a
nucleating bubble on a heater surface. The forces acting on the bubble parallel to the heater surface
were considered and it was proposed that the onset of CHF occurs when the forces that push a
bubble outwards overcome the forces that restrict bubble expansion. The bubbles then expand over
the heater surface to form a thin vapor blanket. The force responsible for the outward expansion
of the bubble was identified as evaporation momentum force. Evaporation momentum force (vapor
recoil) is a reactionary force experienced at the liquid-vapor interface due to the sudden expansion
of the evaporating mass and the consequent increase in its momentum. The forces that restrict
bubble expansion were assumed to be the hydrostatic pressure due to the liquid head and the
surface tension acting at the three phase contact line. The departure diameter was assumed to be
half of the Taylor instability wavelength. The expression for CHF was given by
𝑞′′
𝑐= ℎ
𝑓𝑔𝜌
𝑔1
2
(
1+cos 𝜃 16) [
2 𝜋
+
𝜋
4
(1 + cos 𝜃) cos 𝜑]
1
2
× [𝜎𝑔(𝜌
𝑙
− 𝜌
𝑔)]
14 (14)
2.2.3 Thin Heater Studies
Non-hydrodynamic factors like the thermal properties and thickness of the heater also play a
significant role in affecting the CHF of a surface. Multiple works [43–47] have studied the effect
of heater thickness and thermal properties, such as the heater material, on CHF over the surface.
To study the effect of the thermal properties of the heater substrate on CHF, Tachibana et al. [44]
experimentally determined the CHF on thin, vertically oriented ribbon heaters in water. For thin
heaters, the CHF was seen to be proportional to the heat capacity, which is the product of heater
thickness, density and specific heat of the heater. For a given material, the CHF increased with an
23
in CHF was observed. The authors also conducted numerical simulations to show that the heat flux
required for the temperature raise is only dependent on the heat capacity of the heater and not the
[image:43.612.143.467.159.419.2]thermal conductivity of the material.
Figure 7: CHF over thin heaters as a function of thermal activity parameter. Figure
adapted from Golobic and Bergles [45].
Golobič and Bergles [45] conducted similar tests with thin vertically oriented heaters in FC-72 at
atmospheric pressure. Regression analysis was carried out to determine the effect of properties and
thickness of the heater on CHF. The CHF corresponding to a surface was seen to be best predicted
using the term 𝛿(𝜌𝑐𝑝𝑘)0.5 which is referred to as the thermal activity parameter. For the obtained
dataset, the following expression relating the CHF to the thermal activity of the heater was
proposed
𝑞
′′= 𝑞
𝑎𝑠𝑦′′
(1 − 𝑒
−(𝛿ℎ(𝜌𝑐𝑝𝑘) 0.5
2.44 ) 0.8498
−(𝛿ℎ(𝜌𝑐𝑝𝑘) 0.5
2.44 ) 0.0581
24
where 𝑞𝑎𝑠𝑦′′ is the asymptotic CHF and was taken to be 135 kW/m2 for the surfaces tested.
However, sufficient testing of thick heaters, which are heaters whose thickness is greater than the
asymptotic heater thickness, was not conducted to determine the asymptotic CHF for all the
materials. Figure 7 shows the CHF obtained for the substrates tested as a function of the thermal
activity parameter and the predicted CHF using Eq. 15. The thermal activity parameter resulted in
the best fit for the thin heater with the average absolute deviation between the experimental results
and the predicted valued being about 8.4%. The authors also evaluated the thickness at which
asymptotic CHF is reached. The heater thickness at which 90% of the asymptotic CHF is reached
was taken to be the asymptotic heater thickness. Table 1 shows the observed asymptotic heater
thickness for the different materials tested.
Table 1: Asymptotic heater thickness for various heater materials.
Material Asymptotic Heater
Thickness (μm)
Inconel 600 500 SS 302 550
Steel 300
Iron 250
Nickel 100
Brass 130
Aluminum 25
Copper 15
The transient nature of boiling plays an important role in determining the temperature
fluctuations in the heater substrate. Han and Griffith [10] modeled heat transfer during boiling
25
growth of a thermal boundary layer over the heater surface. It was proposed that the superheated
liquid around the influence region of a bubble is replaced by the cooler bulk liquid during bubble
departure. The heater surface temperature reduces due to contact with cooler liquid and a cyclic
variation in the local heater temperature corresponding to the bubble ebullition cycle is observed.
The local temperature variations get evened out in the heater as the distance from the surface
increases and a further increase in the thickness of the heater does not improve the CHF.
Watwe and Bar-Cohen [46] numerically modeled heat conduction in thin heaters and studied the
variation of the maximum surface temperature for different heater thicknesses and properties. The
maximum surface temperature was found to correlate well with the thermal activity parameter
when the size of the vapor bubbles on the heater surface were assumed to be small. When the vapor
bubbles are large or, in the case of flow boiling, when the frequency of bubble formation and
departure is high, the lateral diffusion of heat from the center of the bubble was found to be
insignificant and the temperature rise under the hot spot correlated well with the thermal capacity
of the heater and the effect of thermal conductivity is negligible. From the studies described above,
density, specific heat and thermal conductivity of the heater material have been identified as the
properties that could affect the CHF over a thick heater surface. Arik and Bar-Cohen [47] proposed
a statistically determined correlation for pool boiling CHF that accounted for the thickness and the
thermal properties of the heater, the operating pressure and the degree of liquid sub-cooling.
2.4 Contact Line Region
The contact line or the three-phase contact line is defined as the region where the solid, liquid and
the gaseous phases intersect. The contact line region in a bubble is observed at the base of the
bubble where the interface of the bubble meets the heater surface. Figure 8 (a) shows the contact
26
region is unlike the rest of the boiling surface and merits a careful examination. While the three
phase contact line region macroscopically appears as a sharp boundary between the bulk liquid
and the vapor, an enlarged view of the contact line region reveals a more nuanced picture. Based
on the size of the meniscus and the nature of the forces acting on the liquid, the contact line region
can be divided into four regions – the adsorbed film region, the transition region, the intrinsic
meniscus region and the microconvection region. A schematic representation of the regions is
shown in Figure 8 (b). The adsorbed film and transition regions together may be described as the
thin film region and is characterized by dominant role of the long range intermolecular forces. The
region adjacent to the thin film region is the macro region of the contact line and can be further
categorized into the intrinsic meniscus region and the microconvection region.
The adsorbed region is a non-evaporating liquid film and hence does not contribute towards the
growth of a bubble. Strong attractive forces between the solid substrate and the liquid prevent
evaporation and results in a flat liquid-vapor interface with uniform thickness. It is difficult to
visually observe this region since the liquid layer is only a few nanometers thick and specialized
optical techniques are required to measure the film thickness. The region adjacent to the adsorbed
film region where the thickness of the liquid begins to increase is known as the transition region.
Due to the increasing separation between the liquid-vapor interface and the heater surface, the
attractive forces between the liquid molecules at the interface and the heater surface reduces
significantly. Sharp variation in the curvature of the interface causes large capillary forces to be
experienced at the interface affecting the liquid flow at the contact line region during evaporation.
The resistance to heat transfer from the contact line region is due to the conduction resistance in
the liquid and the resistance to evaporation at the liquid-vapor interface. The transition region
27
given its small thickness and the resistance at the interface is drastically lower than that in the
adsorbed region due to reduced disjoining pressure. As the thickness of the liquid film increases,
the conduction resistance in the liquid film increases proportionately and thereby heat flux in the
bulk region decreases again.
The macro region is characterized by the dominance of forces such as surface tension and inertial
force on the liquid. The intrinsic meniscus can be described as the region where the thickness of
the liquid is large enough for intermolecular forces to be insignificant but small enough for shear
forces to significantly influence fluid flow. The intrinsic meniscus region is also referred to as the
‘microlayer’ in the boiling context. The shear force on the liquid reduces significantly as the
thickness of the liquid meniscus increases leading to the development of microconvective currents
(microconvection is used here to represent the localized liquid convection adjacent to the contact
line due to motion of the interface, and not the increased convection in the region between
bubbles). The movement of the contact line during bubble growth and departure induces additional
convective effects which enhance the heat transfer in the microconvection region. While the heat
flux in the transition region is very high, the size of the region limits its contribution towards net
heat transfer during boiling. However, Dhavaleswarapu et al. [48] found that almost 95% of heat
is transferred from 30% of the interface close to the contact line. Although further confirmation of
this conclusion is warranted, studying heat transfer in the microconvection region is nevertheless
critical for understanding heat transfer in the contact line region. The discussion presented in this
paper will first cover the forces acting in the adsorbed film and transition regions followed by a
review of the nature of heat transfer in the microlayer and microconvection regions and the
28
(a) (b)
Figure 8: (a) Contact line region in a nucleating bubble and (b) Schematic of the different regions in
the contact line.
2.4.1 Forces in the Contact Line Region
Consider a thin film of thickness 𝛿, the free energy per unit area of the film is given by [49]
𝐹(𝛿) = 𝛾𝑆𝐿+ 𝛾𝐿𝑉 + 𝑝(𝛿) (16)
where 𝛾𝑆𝐿 is the solid-liquid interfacial tension, 𝛾𝐿𝑉 is the liquid-vapor interfacial tension and p(𝛿)
represents the surface forces due to long-range intermolecular forces. Researchers have
extensively studied the nature of surface forces acting on a thin film between two charged solid
surfaces [50–53]. These forces can be further classified into electrostatic, structural, and dispersion
structural forces. The origin of the electrostatic component is the osmotic pressure buildup in the
thin film due to excessive accumulation of counter ions near a charged surface. Structural forces
are repulsive in nature and act on the molecules when the separation is under 3 nm in case of
hydrophilic surfaces and 20 nm in case of hydrophobic surfaces. The dispersion component
consists of van der Waals interaction between the solid and thin liquid film. van der Waals forces
were first studied by Derjaguin [54] and Derjaguin and Landau [55] and later extended by Verwey
and Overbeek [56] in what is commonly referred to as the DLVO theory. In the case of non-polar
liquids, the dominant intermolecular interaction is the van der Waals force. For the liquid film
29
𝑝(𝛿) =
−𝐴∗12𝜋𝛿2 (17)
where A* is the Hamaker constant. In case of non-retarded van der Waals forces, disjoining
pressure (Π) is the derivative of the free energy with respect to the film thickness and is given by
Π
(𝛿) = −
𝑑𝑝 𝑑𝛿= −
𝐴∗
6𝜋𝛿3
,
𝛿 < 30 𝑛𝑚 (18)For distances greater than 30 nanometers, the Hamaker constant is replaced by dispersion constant
B* and the disjoining pressure is given by
Π
(𝛿) = −
𝐵∗
𝛿4
, 𝛿 > 30 𝑛𝑚
(19)The variation of disjoining pressure for polar liquids was expressed as a logarithmic function by
Holm and Goplen [57], and is given by
Π(𝛿) = −𝜌𝑙𝑅̅𝑇𝑖ln(𝛼∗
×
𝛿𝛽∗) (20)where 𝛼∗ and 𝛽∗ are fluid specific coefficients.
The second type of force experienced by the liquid in the thin film region is called capillary force.
Capillary force is a surface force experienced by the molecules at the interface due to asymmetric
intermolecular attraction. The magnitude of the capillary pressure is a product of the surface
tension of the liquid and the curvature of the interface and is given by
𝑃𝑐 = 2𝛾𝐽 (21)
The capillary pressure experienced by the liquid acts normal to the interface. Experimentally
obtained results by Panchamgam et al. [58] showed that the curvature of the interface increases
30
(a)). Such variations in the interface curvature results in a non-uniform distribution of capillary
pressure at the interface which significantly affects the fluid flow in the region. Since the curvature
of the interface is uniform in the macro region, the capillary force experienced in this region does
not vary. In case of thin films, the Young Laplace equation is modified to account for the disjoining
pressure experienced at the interface. The modified equation, referred to as the augmented
Young-Laplace equation [59], is given by,
𝑃 = 2𝛾𝐽 + Π (22) <

![Figure 3: CPU power consumption between 2010 and 2020 [19].](https://thumb-us.123doks.com/thumbv2/123dok_us/32678.2590/29.612.119.491.441.682/figure-cpu-power-consumption.webp)

![Figure 5: Effect of contact angle on CHF. Data from Liaw and Dhir [36] and Maracy et al](https://thumb-us.123doks.com/thumbv2/123dok_us/32678.2590/39.612.140.481.367.641/figure-effect-contact-angle-data-liaw-dhir-maracy.webp)