The effectiveness of recreational only fishing areas in North Queensland estuaries for reducing conflict and improving recreational catches
275
0
0
Full text
(2) THE EFFECTIVENESS OF RECREATIONAL ONLY FISHING AREAS IN NORTH QUEENSLAND ESTUARIES FOR REDUCING CONFLICT AND IMPROVING RECREATIONAL CATCHES.. Thesis submitted by Renae Carolyn TOBIN BSc & Grad Cert (Fisheries Management) in January 2006. for the degree of Doctor of Philosophy in the Department of Tropical Environment Studies and Geography, and The School of Marine Biology and Aquaculture James Cook University and CRC Reef Research Centre..
(3) STATEMENT OF ACCESS. I, Renae Tobin, author of this work, understand that James Cook University will make this thesis available for use within the University Library and, via the Australian Digital Theses network, for use elsewhere. I understand that, as an unpublished work, a thesis has significant protection under the Copyright Act and I do not with to place any further restriction on access to this work.. ___________________________. ________________. Signature. Date. i.
(4) STATEMENT OF SOURCES. DECLARATION I declare that this thesis is my own work and has not been submitted in any form for another degree or diploma at any university or other institution of tertiary education. Information derived from the published or unpublished work of others has been acknowledged in the text and a list of references is given.. ___________________________. ________________. Signature. Date. ii.
(5) STATEMENT ON THE CONTRIBUTION OF OTHERS. CRC Reef Research Centre (CRC Reef) provided student stipend support throughout my PhD candidature via the Student Merit scholarship and Completion Scholarship. These scholarships also covered all HECS fees. CRC Reef and the department of Tropical Environment Studies and Geography at James Cook University provided financial support for research and for attendance at various conferences. Principal supervision was provided by Prof. Bruce Mapstone from 2001 to 2005; however he was unable to continue this supervision after leaving James Cook University due to external work commitments. Dr Stephen Sutton provided supervision from 2002 (principal from 2003), while Dr Marcus Sheaves provided supervision for the duration of the candidature. Drs Sutton and Sheaves provided editorial and statistical advice. Dr Daryl McPhee (University of Queensland and Queensland Seafood Industry Association) and Mr Darren Cameron (Great Barrier Reef Marine Park Authority) were assigned as Task Associates via CRC Reef. They provided general advice on the project particularly at the project design stage. Numerous volunteers assisted with the implementation of field work for the questionnaire program and fishery-independent structured fishing surveys. The Australian National Sportsfishing Association (ANSA) provided recreational fishing data, and Queensland Department of Primary Industries and Fisheries (QDPI&F) provided information on the recreational fishery, inshore charter fishery and inshore commercial net fishery.. iii.
(6) ACKNOWLEDGEMENTS: First and foremost I thank Prof Bruce Mapstone (previously of CRC Reef Research Centre (CRC Reef) and James Cook University (JCU)), Dr Stephen Sutton (of CRC Reef Research Centre and the Department of Tropical Environment Studies and Geography (TESAG), JCU) and Dr Marcus Sheaves (of the School of Marine Biology and Aquaculture, JCU) for supervising the thesis. Your essential advice, input and support is greatly appreciated. This research was supported by CRC Reef via a student merit scholarship, without which the research would not have been possible. Thanks also to TESAG for additional financial support for research and conference attendance. I also thank various people who assisted with providing information at various stages of the project: these people are my Task Associates Mr Darren Cameron and Dr Daryl McPhee who provided invaluable input and support, particularly in the early stages of the project; Dr Ken Pollock who arrived at CRC Reef precisely when I was designing my recreational fisher surveys for which topic he is an expert; and numerous researchers and academics who provided hard-to-find papers relevant to my literature review, particularly Prof Bob Kearney, Dr Lynnath Beckley, and Dr Daryl McPhee. Mr Jim Higgs from Queensland Department of Primary Industries and Fisheries (QDPI&F) promptly provided essential information on Queensland’s recreational fisheries from bi-annual recreational fisher (‘RFISH’) surveys, as well as advice on how to implement my own recreational fisher surveys. Also from QDPI&F, Mr Ian Halliday and Mark Doohan provided prompt information on the inshore commercial fishery whenever requested. Thanks for your help. Numerous recreational fishing clubs allowed me to attend their meetings and competitions and provided essential opinions, advice and catch data. Thanks to all of you for your help and support, especially Gordon Leverton from the Hinchinbrook Sportsfishing Club, Rod Knight from the Army Sportsfishing Club, and Rob Dwyer from the Burdekin Recreational Fishing Club. Thanks also to Bill Sawynok from the Australian Sportsfishing Association (ANSA), SUNTAG and CapReef for providing detailed recreational catch data and for your support of the project. A number of fishers also provided information on ramp usage and were ‘guinea pigs’ for pilot questionnaires and catch logbooks – your assistance is appreciated, particularly Vern Veitch and Tony Katsaros. I presented research results at numerous conferences and for various fishing clubs and research agencies – this required countless practice seminars which the. iv.
(7) members of the Fishing and Fisheries Team at CRC Reef, Tim Harvey, and various TESAG students patiently sat through. I am grateful for your advice and help. Interviewing almost 400 recreational fishers would not have been possible without the help of willing volunteers, particularly the continued help of Beth Cameron, Kara Dew and Denise Betts. Similarly the fishery-independent fishing surveys were reliant on help from volunteers, so thanks to all who assisted, particularly Mark O’Callaghan and Peter Short who always seemed to be available. The use of the public media was essential to alert fishers to the project – both to gain participants and to disseminate research results. I couldn’t have done this without the help of Dr Annabel Jones and Dr Louise Goggin – Thanks. And finally, thanks to my family – thanks to Andrew and little Elliot for providing a life outside of the PhD. I couldn’t have done this and stayed sane without you. And thanks to baby Charlotte for waiting until your due date to arrive (5 days after thesis submission).. v.
(8) ABSTRACT Allocation of fisheries resources to recreational fishers via Recreational Only Fishing Areas (ROFAs) is becoming increasingly common in all developed countries, particularly in coastal areas. ROFAs are often introduced with the expectation that such action will segregate competing recreational and commercial fishers (by excluding commercial fishers) and thus resolve apparent conflict over previously shared fisheries resources. ROFAs also have the expected benefit of improving recreational catch quality for previously shared species. Whether these benefits are realised, however, is unknown because little monitoring of outcomes occurs post-ROFA implementation. Using questionnaires of recreational and commercial fishers and collection of fishery-dependent and fishery-independent recreational catch data, this study investigated the outcomes of ROFAs in north Queensland estuaries. Specifically, the study examined: the nature and source of conflict between recreational and commercial fishers competing for shared barramundi stocks; whether current estuarine ROFAs are successful in segregating and reducing conflict between these sectors; and whether ROFAs result in improved recreational catches of barramundi. Results from the questionnaires show that while recreational fishers (anglers) have high expectations of ROFAs and would like more implemented, most anglers are unaware of locations of current ROFAs, and do not deliberately choose to use them. Consequently, current ROFAs are not increasing segregation of recreational and commercial fishers. Moreover, contact between the recreational and commercial sectors appears to already be limited due to time segregation (commercial netting is not allowed in estuaries on weekends) and the finding that most commercial fishers avoid areas heavily occupied by recreational fishers. Thus the conflict between these sectors does not appear to be due to high levels of direct contact. Investigations of the perceptions of fishers from both sectors via the questionnaire program revealed that the underlying conflict between commercial and recreational fishers in north Queensland appears to be based on mutual misperceptions of the competing sector’s operations and impacts, particularly from anglers. Such misperceptions lead to blame (i.e. anglers blame commercial fishers) for negative outcomes such as (real or perceived) catch declines. ROFAs do not address this problem of mutual misperceptions of fishers and are therefore unlikely to resolve this conflict in the long-term. Increased communication between sectors and education from fisheries managers and researchers and stakeholder representatives regarding each sector’s operations and impacts on the resource is more likely to reduce conflict.. vi.
(9) Such actions should reduce misperceptions, adjusting attitudes of fishers to be more positive towards the competing sector, and hence reducing conflict. Despite anecdotal claims and expectations of improved recreational catches of barramundi in ROFAs compared to open estuaries in north Queensland, fisherydependent (from charter fishing records, voluntary recreational catch logbooks, and personal fisher time series records) and fishery-independent (in the form of structured fishing surveys) recreational catch data collected though this study did not reveal improvements in catch per unit effort or success rates for barramundi in ROFAs. Results did show that the average size of barramundi caught in ROFAs was larger than those caught in the open estuaries, though the reason for this difference in size structure is unknown. Further investigation into why recreational catch benefits are not being realised and what this may mean for barramundi populations is required. Results imply natural variation may be more influential on barramundi populations than fishing, or that recreational fishing is highly variable and not a good indicator of stock structure and abundance. Overall, results of this project suggest current estuarine ROFAs in north Queensland are not resulting in the expected benefits: i.e. they are not reducing conflict between recreational and commercial fishers or resulting in improved recreational catches of barramundi. This study highlights the importance of determining the source of conflict, and collecting quality time-series recreational catch data before and after ROFA implementation. Future studies should aim to examine both the costs and expected benefits of ROFAs to determine whether benefits outweigh the costs involved. Costs and benefits should be examined from a multi-disciplinary approach, including social, ecological and economic aspects.. vii.
(10) TABLE OF CONTENTS: STATEMENT OF ACCESS ......................................................................................... I STATEMENT OF SOURCES ..................................................................................... II STATEMENT ON THE CONTRIBUTION OF OTHERS ............................................ III ACKNOWLEDGEMENTS: ........................................................................................ IV ABSTRACT ............................................................................................................... VI TABLE OF CONTENTS: ......................................................................................... VIII LIST OF TABLES:..................................................................................................... XI LIST OF FIGURES: ................................................................................................... XI LIST OF ABBREVIATIONS: ...................................................................................XVI CHAPTER 1: GENERAL INTRODUCTION ............................................................... 1 1.1 INTRODUCTION ........................................................................................................1 1.2 LITERATURE REVIEW: THE BENEFITS AND COSTS OF RECREATIONAL ONLY FISHING AREAS ..........................................................................................................................3 1.2.1 Benefits of ROFAs...........................................................................................5 1.2.2 Costs of ROFAs.............................................................................................19 1.2.3 Conclusion.....................................................................................................26 1.3 ROFAS WITHIN QUEENSLAND EAST COAST ESTUARIES ...........................................26 1.3.1 ROFAs for barramundi ..................................................................................28 1.3.2 Goals of ROFAs ............................................................................................28 1.3.3 Available data for Queensland estuarine ROFAs..........................................30 1.4 OBJECTIVES OF PROJECT ......................................................................................30 1.5 STUDY AREA .........................................................................................................31 1.6 THE BARRAMUNDI FISHERY ....................................................................................33 1.6.1 Barramundi biology........................................................................................33 1.6.2 The Barramundi Fishery ................................................................................34 1.6.3 Threats to the resource .................................................................................37 1.7 CHAPTER OUTLINE ................................................................................................37 CHAPTER 2: QUESTIONNAIRE PROGRAM.......................................................... 39 2.1 INTRODUCTION ......................................................................................................39 2.1.1 The nature and source of conflict ..................................................................39 2.1.2 Are ROFAs likely to resolve the conflict? ......................................................42 viii.
(11) 2.2 OBJECTIVES ..........................................................................................................42 2.3 METHODS ..............................................................................................................42 2.3.1 Questionnaire development...........................................................................43 2.3.2 Distribution methods......................................................................................44 2.3.3 Data Analysis.................................................................................................49 2.4 RESULTS ...............................................................................................................50 2.4.1 Objective 1: To explore the nature and source of apparent competition and conflict between recreational line and commercial gill net fishers in north Queensland. ...........................................................................................................50 2.4.2 Objective 2: To examine whether fishers support the current and future use of estuarine finfish ROFAs to reduce conflict between the two sectors......................60 2.5 DISCUSSION ..........................................................................................................69 2.5.1 Is competition and conflict realised by the general fishing public? ................69 2.5.2 What is the nature and source of the conflict? ..............................................69 2.5.3 Do fishers support the use of ROFAs?..........................................................73 2.5.4 Are more ROFAs necessary?........................................................................74 2.5.5 Other potential solutions to conflict................................................................75 2.6 CONCLUSION .........................................................................................................80 2.7 FUTURE SURVEY IMPROVEMENTS ...........................................................................80 CHAPTER 3: FISHERY-DEPENDENT RECREATIONAL CATCH DATA .............. 82 3.1 INTRODUCTION ......................................................................................................82 3.1.1 Fishery-dependent data sources ...................................................................85 3.2 OBJECTIVES ..........................................................................................................86 3.3 METHODS AND RESULTS ........................................................................................86 3.3.1 Charter fishery catch data .............................................................................86 Methods..................................................................................................................86 Results....................................................................................................................87 3.3.2 Voluntary recreational catch logbooks...........................................................88 Methods..................................................................................................................88 Results....................................................................................................................92 3.3.3 ANSA time-series data for the Hinchinbrook region ....................................110 Methods................................................................................................................110 Results..................................................................................................................111 3.4 DISCUSSION ........................................................................................................122 3.4.1 Is recreational fishing quality better in ROFAs? ..........................................122 3.4.2 Consequences for future ROFAs ................................................................129. ix.
(12) 3.4.3 Difficulties with fishery-dependent data .......................................................130 3.4.4 Future directions..........................................................................................131 CHAPTER 4: FISHERY-INDEPENDENT STRUCTURED FISHING SURVEYS ... 133 4.1 INTRODUCTION ....................................................................................................133 4.2 OBJECTIVES ........................................................................................................134 4.3 METHODS ............................................................................................................134 4.3.1 Site selection ...............................................................................................134 4.3.2 Sampling periods.........................................................................................136 4.3.3 Sampling within estuaries............................................................................137 4.3.4 Sampling methods.......................................................................................138 4.3.5 Data recorded..............................................................................................138 4.3.6 Data Analysis...............................................................................................139 4.4 RESULTS .............................................................................................................140 4.4.1 Description of the catch data .......................................................................140 4.4.2 CPUE comparisons .....................................................................................141 4.4.3 Size frequency of barramundi......................................................................145 4.5 DISCUSSION ........................................................................................................147 CHAPTER 5: GENERAL DISCUSSION................................................................. 152 5.1 OVERVIEW ...........................................................................................................152 5.1.1 Segregation as a solution to conflict............................................................152 5.1.2 Education and communication as a solution to conflict ...............................154 5.1.3 The use of ROFAs to improve recreational catches....................................156 5.2 IMPLICATIONS FOR FUTURE ROFAS......................................................................160 5.3 CONCLUSION .......................................................................................................162 REFERENCES: ...................................................................................................... 164 APPENDICES:........................................................................................................ 187 Appendix 1 Queensland estuaries north of Fraser Island closed to commercial gill net fishing (i.e. effectively ROFAs for finfish). .............................................187 Appendix 2 Fisher Questionnaires ...................................................................193 Appendix 3 Timetables for the recreational fisher access point (boat ramp) Bus Route Surveys..................................................................................................206 Appendix 4 QDPI&F Charter Fishing Catch Logbook ......................................207 Appendix 5 Recreational fisher catch logbook .................................................209 Appendix 6 Classification and Regression Trees for Voluntary Recreational Catch Logbook Data.........................................................................................213 x.
(13) Appendix 7 Timetable for fishery-independent structured fishing surveys. ......246 Appendix 8 Mud-maps of each sampled estuary for the fishery-independent structured fishing surveys.................................................................................250 Appendix 9 Data sheets for fishery-independent structured fishing surveys....256. LIST OF TABLES: Table 2.1. Regions within study area for the recreational fisher access point Bus-. Route Surveys, listed south-north. .........................................................................45 Table 2.2. Sampling timetable for the recreational fisher access point Bus-Route. Surveys…. ..............................................................................................................47 Table 2.3. Perceived threats to the resource listed by recreational and commercial. fishers in response to the open-ended question: “What do you see as the biggest threat to local estuarine fish stocks?” .....................................................................52 Table 2.4. Reasons listed by recreational and commercial fishers for why they think. their catch has changed in recent years.................................................................53 Table 2.5. Solutions suggested by recreational and commercial fishers to resolve. or reduce competition between the two sectors in local estuaries. ........................61 Table 2.6. List of factors given by recreational and commercial fishers that usually. affect their choice of fishing location.......................................................................65 Table 3.1. Codes assigned to each fishing factor within the “fishing factor code”..91. Table 4.1. Estuaries sampled within each region for the fishery-independent. structured fishing surveys, including approximate estuary dimensions................136 Table 4.2. Description of fishery-independent structured survey fishing trips in each. estuary….. ............................................................................................................140 Table 4.3. Total number (n) and catch per unit effort (CPUE, number of fish per. angler per hour) of each species (grouped to genus in some instances) caught in each estuary with the fishery-independent structure fishing surveys. ..................142. LIST OF FIGURES: Figure 1.1. Map outlining the study area within Queensland, Australia...................32. Figure 1.2. Map of study area in north Queensland outlining ROFA and part-ROFA. estuaries and Dugong Protection Areas (DPAs). ...................................................33 Figure 2.1. Map of regions within the study area for the recreational fisher access. point (boat ramp) Bus Route Surveys. ...................................................................46. xi.
(14) Figure 2.2. Percentage of a) recreational fishers, and b) commercial fishers in each. answer category for the question: “Do you think competition/conflict between recreational and commercial fishers in estuaries is a significant problem in the local area; or for you personally? If yes, at what level?” .................................................51 Figure 2.3. Percentage of respondents from the recreational and commercial. sectors that think the number of fish they catch has increased, decreased or not changed in recent years. ........................................................................................53 Figure 2.4. Percentage of recreational and commercial fishers who hold a positive. (‘like’), neutral (‘indifferent’) or negative (‘dislike’) attitude toward the competing sector. ….. ..............................................................................................................54 Figure 2.5. Percentage of recreational and commercial fishers in each answer. category for the question: “Do you think recreational fishers as a group have an impact on estuarine fish stocks? If yes, to what extent?” .......................................55 Figure 2.6. Percentage of commercial fishers who answered ‘yes’ or ‘no’ to the. questions: “Do you think recreational fishers regularly keep undersize fish; barramundi over 1m; more than their bag limit; or fish to sell on the black market?” ……………..............................................................................................................56 Figure 2.7. Percentage of recreational and commercial fishers that think the. commercial gill net fishery is, or is not, sustainable at current effort levels on Queensland’s east coast. .......................................................................................57 Figure 2.8. Percentage of commercial fishers in each answer category for the. question: “Do you think the commercial gill net sector catches more or less barramundi per year than the recreational sector on Queensland’s east coast?” ..57 Figure 2.9. Percentage of recreational fishers that answered ‘yes’ or ‘no’ to the. question: “Do you think commercial gill net fishers regularly keep undersize barramundi; or large female barramundi (over 1m)?”.............................................58 Figure 2.10. Species listed by recreational and commercial fishers when asked what. the main target species is for the estuarine commercial gill net fishery on Queensland’s east coast. .......................................................................................59 Figure 2.11. Species listed by recreational fishers when asked what they believe. commercial estuarine gill nets catch on Queensland’s east coast. ........................60 Figure 2.12. Percentage of recreational and commercial fishers that think anglers will. catch more, less or the same number of fish on an average fishing day in an estuary that is closed to commercial fishing (ROFA) compared to one that is open. ……………..............................................................................................................62. xii.
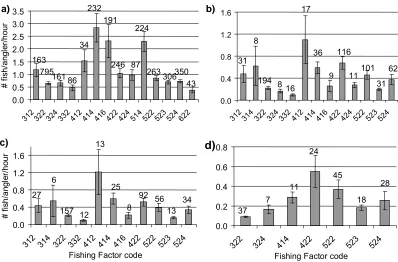
(15) Figure 2.13. Percentage of recreational and commercial fishers in each answer. category for the question: “If an estuary was closed to commercial gill net fishing, do you think recreational effort would increase as a result? If yes, at what level?” 63 Figure 2.14. Number of interviews per hour from anglers fishing in open, ROFA and. part-ROFA estuaries surveyed with the access point Bus Route Surveys. ............65 Figure 2.15. The percentage of anglers that correctly or incorrectly stated whether. the estuary they were fishing on the day of the interview was open or closed (ROFA) to commercial gill net fishing. ....................................................................66 Figure 2.16. The percentage of anglers (from those that claimed knowledge of. ROFAs) that correctly or incorrectly stated whether the estuary they were fishing on the day of the interview was open or closed (ROFA) to commercial gill net fishing. …................................................................................................................67 Figure 2.17. Percentage of recreational and commercial fishers who answered ‘yes’. or ‘no’ to the question: “Do you think it is necessary to close more estuaries in the local area to commercial gill net fishing?”...............................................................68 Figure 2.18. Percentage of recreational and commercial fishers who think closing an. area to one sector for the benefit of the other (i.e. sector-specific closures) is ‘fair’ or ‘unfair’. ...............................................................................................................68 Figure 3.1. Classification and Regression Tree (CART) with the 1-SE rule. examining the effect of fishing location (management status and bay) on catch per unit effort (CPUE, weight per day) of barramundi for the Commercial Charter Fishery. … ..............................................................................................................88 Figure 3.2. Percentage of recreational logbook holders (that targeted barramundi) in. each avidity category, plus percentage of trips provided by anglers in each avidity category. ................................................................................................................93 Figure 3.3. Percentage of trips logged by each fishing party size (i.e. number of. anglers). … .............................................................................................................94 Figure 3.4. Percentage of logged trips by anglers using different line numbers per. angler. ….. ..............................................................................................................94 Figure 3.5. Duration of logged fishing trips within one-hour time categories (rounded. up to the nearest hour). ..........................................................................................95 Figure 3.6. Percentage of logged fishing trips using each fishing method (i.e. bait. type) to target barramundi. .....................................................................................95 Figure 3.7. Classification and Regression Tree (CART) with the 1-SE rule for: a) all. fish species; b) all barramundi; c) undersize barramundi; and d) legal-sized barramundi, examining the effect of various fishing factors on the percentage of successful (for catching at least one fish) trips.......................................................97 xiii.
(16) Figure 3.8. CART with the 1-SE rule for: a) all fish species; b) all barramundi; c). undersize barramundi; and d) legal-sized barramundi, examining the effect of combined fishing factors (avidity, number of anglers, and number of lines per angler) on catch per unit effort (CPUE, number of fish per angler per hour)..........99 Figure 3.9. Interaction effect of avidity, number of anglers per fishing party and line. number per angler on CPUE (number of fish per angler per hour) for successful trips for a) fish of any species; b) barramundi; c) undersize barramundi; and d) legal-sized barramundi. ........................................................................................100 Figure 3.10. CART with the 1-SE rule for: a) all fish species; b) all barramundi; c). undersize barramundi; and d) legal-sized barramundi, examining the effect of fishing method on CPUE (number of fish per angler per hour). ...........................101 Figure 3.11. CART with the 1-SE rule for the success rate for catching at least one:. a) fish of any species; b) barramundi; c) undersize barramundi; and d) legal-sized barramundi. ..........................................................................................................103 Figure 3.12. Average CPUE with 95% CI for successful fishing trips for: a) all fish; b). all barramundi; c) undersize barramundi; and d) legal-sized barramundi for open, ROFA and part-ROFA estuaries in the study area. ..............................................104 Figure 3.13. CART with the 1-SE rule for a) all fish, b) all barramundi, c) undersize. barramundi; and d) legal-sized barramundi for CPUE for successful trips in each bay. ……… ...........................................................................................................105 Figure 3.14. CART with the 1-SE rule for the legal-sized barramundi CPUE for. successful trips in each bay using: a) only artificial bait; and b) a mixture of real and artificial bait...........................................................................................................106 Figure 3.15. Frequency histogram of each size class of barramundi caught in open. and ROFA estuaries throughout the study area. ..................................................107 Figure 3.16. Correspondence analysis of size classes of barramundi caught in open. and ROFA estuaries in each bay in the study area. .............................................108 Figure 3.17. Size frequency histograms for barramundi caught in open and ROFA. estuaries in each bay in the study area. ...............................................................109 Figure 3.18. CPUE (number of fish per angler per hour) for all barramundi for. estuaries within the Hinchinbrook DPA region and adjacent open estuaries over time. ……..............................................................................................................112 Figure 3.19. CPUE for all barramundi for estuaries within the Hinchinbrook DPA. region and adjacent open estuaries over time (grouped within 3-year blocks). ...112 Figure 3.20. CART with the 1-SE rule for the number of barramundi caught per. angler per hour in: a) estuaries within the Hinchinbrook DPA area; and b) adjacent open estuaries over time (within 3-year blocks). ..................................................113 xiv.
(17) Figure 3.21. Cross-correlation of open versus DPA estuaries of average barramundi. CPUE over time (within 3-year blocks).................................................................114 Figure 3.22. CPUE for legal-sized barramundi for: a) estuaries within the. Hinchinbrook DPA region over time (open estuaries not included due to large error bars); and b) DPA and adjacent open estuaries within 3-year blocks. .................115 Figure 3.23. CART with the 1-SE rule for legal-sized barramundi CPUE in: a). estuaries within the Hinchinbrook DPA area; and b) adjacent open estuaries over time (within 3-year blocks)....................................................................................116 Figure 3.24. Success rate for all barramundi for estuaries within the Hinchinbrook. DPA region and adjacent open estuaries for: a) individual years; and b) 3-year blocks. …..............................................................................................................117 Figure 3.25. CART the 1-SE rule comparing average success rate for 3-year blocks. for barramundi between: a) estuaries within the Hinchinbrook DPA area; and b) adjacent open estuaries. ......................................................................................118 Figure 3.26. Cross-correlation of open versus DPA estuaries of success rate for. catching barramundi (within 3-year blocks). .........................................................119 Figure 3.27. Success rate for legal-sized barramundi for: a) estuaries within the. Hinchinbrook DPA region over time (open estuaries not included due to large error bars); and b) DPA and adjacent open estuaries within 3-year blocks. .................120 Figure 3.28. CART the 1-SE rule comparing success rate for legal-sized barramundi. between 3-year blocks in: a) estuaries within the Hinchinbrook DPA area; and b) adjacent open estuaries. ......................................................................................121 Figure 3.29. Size frequency histogram for all barramundi caught within the. Hinchinbrook DPA region pre- and post-DPA implementation. ............................122 Figure 4.1. Map of estuaries sampled (fished) within the fishery-independent. structured fishing surveys within each region in the study area. ..........................135 Figure 4.2. Common dropper rig used for targeting barramundi by fishing with live. prawns in snags (exaggerated for clarity).............................................................139 Figure 4.3. Average CPUE (number of fish per angler per hour) for all fish caught in. each sampled estuary. .........................................................................................141 Figure 4.4. Classification and Regression Tree (CART) with the 1-SE rule for the. CPUE (number of fish caught per angler per hour) of all fish in all sampled estuaries. .. ...........................................................................................................143 Figure 4.5. Average CPUE for all barramundi caught in each sampled estuary. ..144. Figure 4.6. CART with the: a) 1-SE rule; and b) min-CV rule for barramundi CPUE. in all sampled estuaries. .......................................................................................145. xv.
(18) Figure 4.7. Size frequency histogram for barramundi caught in the sampled open. and ROFA estuaries. ............................................................................................146 Figure 4.8. Average size of barramundi caught in the sampled open and ROFA. estuaries. . ............................................................................................................147. LIST OF ABBREVIATIONS: AFANT. Amateur Fisherman’s Association of the Northern Territory. ANSA. Australian National Sportsfishing Association. CHRIS. Coastal Habitat Resources Information System. CPUE. Catch per unit effort. CRC Reef. CRC Reef Research Centre. DPA. Dugong Protection Area. ECIFF. East Coast Inshore Finfish Fishery. EoNF Project Effects of Net Fishing Project GBRMP. Great Barrier Reef Marine Park. GBRMPA. Great Barrier Reef Marine Park Authority. GBRWHA. Great Barrier Reef World Heritage Area. NSW. New South Wales. NRIFS. National Recreational and Indigenous Fishing Survey. QDPI. Queensland Department of Primary Industries. QDPI&F. Queensland Department of Primary Industries and Fisheries. QBFP. Queensland Boating and Fisheries Patrol. QSIA. Queensland Seafood Industry Association. RAP. Representative Areas Program. RFISH. QDPI&F Recreational Fisher Monitoring Program. ROFA. Recreational Only Fishing Area. WA. Western Australia. xvi.
(19) CHAPTER 1: GENERAL INTRODUCTION 1.1 Introduction Competition and conflict between commercial and recreational fishers over shared fish stocks is a historic and current reality, and has been documented in all developed and some developing countries (Ruello and Henry 1977; Gartside 1986; Aas and Skurdal 1996; Sumaila 1999; Kearney 2002a, b; Pitcher and Hollingworth 2002; Sumaila 2002; McPhee and Hundloe 2004; Arlinghaus 2005). Although recreational and commercial fishing sectors are often in competition to the point of conflict with other users (including within their own sector), apparent conflict between recreational and commercial fishers is currently one of the most significant issues for fisheries management in Australia and many other countries (West and Gordon 1994; Brayford 1995; van Buerren et al. 1997; McPhee and Hundloe 2004; Arlinghaus 2005). Conflicts may be severe and expensive of management resources, regardless of whether they are “real” or only perceived (i.e. based on fishers’ beliefs but not substantiated) by one or more of the involved fishing sectors (Jacob and Schreyer 1980; Aas and Skurdal 1996). Many authors suggest conflict between recreational and commercial fishing sectors is increasing as contact between the sectors increases, particularly in coastal areas and close to population centres (Gartside 1986; Edwards 1991; Hannah and Smith 1993; Brayford 1995; Ramsay 1995; Scialabba 1998; O'Neill 2000; McPhee et al. 2002; Steffe et al. 2005b). Increasing contact between the sectors may be due to a number of factors including: increased population; increased recreational fishing participation; and improved accessibility to previously remote fishing areas (Smith 1980; Henry 1984; Edwards 1990; van der Elst 1992; Hannah and Smith 1993; Green 1994; West and Gordon 1994; Kearney 2001, 2002b; Williams 2002a; Sumner 2003; Steffe et al. 2005b). Although conflict can occur when commercial and recreational fishers target different species, the conflict situation is enhanced when the same species are targeted by both sectors (Arlinghaus 2005). In an attempt to reduce contact between competing sectors and hence reduce conflict, sector-specific closures are introduced in previously shared areas (Samples 1989; Department of Primary Industries and Fisheries 2003). Recreational Only Fishing Areas (ROFAs) (i.e. areas where commercial fishing is banned, leaving exclusive access to recreational fishers (also termed ‘anglers’ when they are recreational line fishers)) are becoming increasingly common in Australia and other developed countries (Owen 1981; Rogers and Gould 1995; Kearney 2002b; McPhee et al. 2002; Walters. 1.
(20) 2003). All States and Territories in Australia have implemented ROFAs, particularly in coastal areas. For instance, in New South Wales (NSW) in May 2002, 30 areas along the coast became “Recreational Fishing Havens” (termed ROFAs here), where commercial fishing was either completely banned or significantly restricted. These ROFAs resulted in the closure of 24% of the State’s estuarine waters to commercial fishing (NSW Department of Primary Industries 2004; Steffe et al. 2005b). In the Northern Territory, the rise of the recreational fishing sector in the 1980s shifted the focus of barramundi management to the allocation of the resource between the competing sectors. This resulted in the exclusion of commercial fishing from some areas including all freshwater areas, plus Darwin Harbour, Kakadu National Park, and the Daly, Mary and Roper Rivers (Pender 1995; Griffin 2003). In Victoria, only 4 of 25 bays and inlets allow commercial finfish fishing, making the remaining areas effectively ROFAs for finfish (Murray MacDonald, Department of Primary Industries Victoria, pers. comm., 2006) Commercial Only Fishing Areas (COFAs), on the other hand, appear extremely rare. There is one published example of COFAs available: in the north-western Mediterranean there are areas where small-scale restricted commercial net fishing is allowed but recreational line and spear fishing is banned. However the purpose of such restrictions was for conservation of fish species, rather than segregation to reduce conflict (Francour et al. 2001). In Western Australia, priority access (but not exclusive access) is given to commercial salmon fishers for a set period on southern beaches (Bartleet 1995). Given this trend, ROFAs are the focus of the present study. In north Queensland, Australia, a number of estuaries have been closed to commercial netting (effectively making them ROFAs for finfish) to reduce conflict between recreational and commercial fishers competing for shared estuary fish, particularly barramundi (Lates calcarifer) (Mark Doohan, QDPI&F, pers. comm., 2005). Although some of these ROFAs have been in place since the 1970s there has been very little evaluation of their social and biological effects. In most cases, the extent to which ROFAs are successful in segregating competing sectors, and thus reducing conflict, has not been tested. In addition to potentially segregating competing sectors, ROFAs also have additional potential benefits for the recreational sector. In particular, with the exclusion of commercial fishing, there is less competition for previously shared fish stocks in the area. Consequently, improved recreational catches are expected, producing potential flow-on effects of increased effort from this sector, which may lead to increased spending and potentially increased value to the community (Ruello and Henry 1977;. 2.
(21) Kearney 2001; Dominion 2002; McPhee and Hundloe 2004). While significant anecdotal evidence suggests such benefits are being realised, there are few cases where actual catch trends and flow-on benefits are examined, and when they are the results are mixed. The introduction of ROFAs also attracts various potential costs. Many of these costs will be borne by the excluded commercial sector; however there are also potential costs to the community and the fish stocks (Kearney 2003a; MacDonald 2003). In practice, ROFAs are permanent – i.e. there are no published cases of ROFAs being reverted back to shared-access where both sectors are targeting the same species (McPhee and Hundloe 2004). Thus, with increasing calls for ROFAs from recreational fishers, and more claims for compensation for loss of commercial livelihood as a result, it becomes important to look at the actual costs and benefits of implementing ROFAs (Dominion 2002). This project examines whether the expected benefits of ROFAs – in terms of reduced conflict between recreational line fishers (anglers) and commercial gill net fishers, and improved recreational catches – exist within the north Queensland barramundi fishery. In addition to providing an understanding of the benefits of ROFAs within this fishery, results will be relevant to many situations where ROFAs are being proposed or have been introduced with the goal of reducing conflict and/or improving recreational catches.. 1.2 Literature Review: The benefits and costs of Recreational Only Fishing Areas Sector-specific fishing closures (where one sector is excluded from an area to provide exclusive use of the resource to the other sector), designed to separate competing user groups (sectors) date back to the early 20th century (Department of Fisheries Western Australia 2000). Traditionally, fisheries resources were accessible to all sectors, with fisheries resources generally considered common property: i.e. the resources are owned collectively by a group and not owned by anyone (Rogers and Gould 1995; van der Elst et al. 1997; Marshall and Moore 2000). However, traditional ‘open access’ to common property resources can lead to depletion of stocks, through Hardin’s wellknown “Tragedy of the Commons” situation, where each fisher will have the incentive to catch as much as possible before someone else does (Smith and Pollard 1995; van der Elst et al. 1997; Kearney 2001). To avoid this, most fisheries are managed via regulation by the government or state, which allocates both commercial and recreational rights (Charles 1992; Rogers and Gould 1995; Marshall and Moore 2000).. 3.
(22) However, there is a lack of agreed processes for determining appropriate sharing/allocation targets for particular resources (Henry and Lyle 2003), and both the commercial and recreational sectors aim to maximise their share of limited and finite fisheries resources, often at the expense of the other sector (Ruello and Henry 1977; Henry 1984; Smith and Pollard 1995). Central to the problem of increasing competition between sectors is this question of ownership of the resource (Charles 1992; Kearney 2003a). Commercial rights may be regarded as a form of private property right purchased in the form of a transferable licence that provides a degree of ownership over the resource (Marshall and Moore 2000). For some commercial fisheries catch shares for each licence are also well-defined (Craig 2000; Kearney 2001). For recreational fisheries, although most anglers consider fishing to be their birthright, collectively their rights have not been defined (Rogers and Gould 1995; McMurran 2000; Kearney 2001; McPhee et al. 2002; Kearney 2003a). With increasing pressures on, and competition for, limited fish stocks there are increasing demands from the recreational fishing sector for greater recognition and definition of their rights of access (McPhee et al. 2002). With the rise of the recreational fishery there has been an increased political push for exclusive access to some areas and species (Teirney 1995; Kearney 2001; McPhee and Hundloe 2004). Allocation decisions such as these are unique in that the best available scientific information is not central to the conflict resolution (Hannah and Smith 1993). Many fisheries researchers advocate sector-exclusive access/closures to areas as a feasible way to reduce conflict by reducing contact between competing sectors (e.g. Hendee 1974; Brown 1977; Owen 1981; Samples 1989; Brayford 1995; Rogers and Gould 1995; Taylor-Moore 1997; van der Elst 1997). For example, van der Elst (1997), suggested ongoing competition for King George whiting (Sillaginodes punctatus) in South Australia and Victoria could be resolved through sector-specific zonation by restricting recreational anglers to areas close to urban centres and allocating commercial rights beyond. Other authors believe sector-specific closures are detrimental or unpopular, and may themselves cause conflict (Beaumariage 1978; Hannah and Smith 1993; Bennett et al. 2001). Resource allocation is one of the most challenging issues for fisheries managers (Department of Primary Industries and Fisheries 2004) and requires the most conflict producing decisions within fisheries management as they “pit group against group” (Hannah and Smith 1993). The likelihood of allocations to produce conflict depends on whether allocations are shared equally, or whether one sector gains at the expense of the other (such as in the case of sector-specific closures) (Hannah and Smith 1993). Conflict caused by dissatisfaction regarding allocation 4.
(23) decisions can cause problems for the involved fishing sectors as well as fisheries managers. Time and money spent on conflict resolution efforts (including via legal proceedings) can be costly (Daigle et al. 1996). Regardless of these varied opinions, sector-specific closures are becoming increasingly common, and it is most common to exclude commercial fishing to the advantage of recreational fishers – i.e. to introduce ROFAs (Pender 1995; McPhee et al. 2002; Rogers and Curnow 2003). There are various possible benefits and costs of providing exclusive access to recreational fishers through areas such as ROFAs: for recreational and commercial fishers, the community, and the fish stocks. Often such benefits and costs are hypothesised, but few cases examine whether these benefits are actually realised, and whether they outweigh associated costs. Where expected benefits and costs are examined, results are mixed. Despite the extensive use of ROFAs, detailed literature searches revealed that few case studies outlining examples of ROFAs, both pre- and post-implementation, are published in peer-reviewed scientific journals. Available literature on this topic is dominated by internal fisheries reports, conference proceedings and other grey literature (perhaps because conflict resolution is often seen as a local issue (Brayford 1995; Rogers and Gould 1995)). Consequently, available information about the effectiveness of ROFAs is limited.. 1.2.1 Benefits of ROFAs a) Reduction of conflict between recreational and commercial fishers Where there is an overlap of recreational and commercial fishing in terms of fished species and area, ROFAs are expected to reduce contact between competing groups thereby reducing or eliminating the need for direct conflict intervention (Samples 1989). If successful, this resolution of conflict will benefit both of the competing fishing sectors as well as fisheries managers. There are many cases within Australia and other developed countries where ROFAs have been suggested and/or implemented in order to reduce competition and conflict between sectors (see Owen 1981; Gwynne 1995; Dominion 2002; Department of Primary Industries and Fisheries 2003). For example, in Western Australia (WA), Fisheries Adjustment Schemes were developed which aimed to reduce commercial effort in specific areas or fisheries where there was a high level of conflict or competition for the available catch, particularly between the commercial and. 5.
(24) recreational fishing sectors. WA’s Department of Fisheries advocated spatial separation of groups, and in 1996 the WA government provided $8 million to directly fund the voluntary surrender of commercial fishing licences in areas where there was community demand for greater recreational fishing opportunities. The scheme successfully removed 46 licences by 1999 (at a cost of $3.2 million) from the smaller but often highly contentious commercial fisheries in estuaries and inshore areas (Department of Fisheries Western Australia 2000). There is no further published information available outlining whether this scheme has reduced conflict in the longterm. The effectiveness of ROFAs in resolving conflict may depend on: 1) the cause of the conflict; and 2) how the ROFAs are implemented. Each of these points are discussed below. i) Causes of conflict In most situations the cause of conflict between recreational and commercial fishing sectors is the perception that stocks, or at least catches, are declining, which is generally attributed to the competing sector. Such conflict can come from either or both sectors (Henry 1984; Samples 1989; Dovers 1994; Kearney 2002a; Arlinghaus 2005). Apparent conflict in Australia’s Sydney Estuary in the 1980s reflected this: Anglers claimed that commercial gill net fishers killed many small fish, resulting in depleted fish stocks and poor angler catches. Commercial fishers reciprocated by claiming anglers also killed many undersize fish, either by deliberately keeping them or through poor handling prior to release (Henry 1984). Unfortunately, in most cases there is an absence of adequate stock and catch data, particularly for the recreational fishery, making such claims unresolvable as it is unknown whether they are based on misperceptions or reality (Dovers 1994; Presser 1994; Department of Fisheries Western Australia 2000; Murray-Jones and Steffe 2000; Kearney 2002a). It is most common for recreational fishers to blame commercial fishers for perceived catch declines (Ruello and Henry 1977; Quinn 1988; Macreadie 1992; Bartleet 1995; Gladwin 1995; Kearney 1995a; Griffiths and Lamberth 2002; Kearney 2002a, 2003b). If conflict is present due to recreational fishers’ perception of a commercial fishing impact on stocks and catches, the removal of commercial fishing should reduce the animosity recreational fishers feel towards commercial fishers for that particular area. However, commercial fishers are likely to feel resentful unless there is compensation for the lost fishing area (Kearney 2002a; Olsen 2003). In some cases compensation is available to displaced commercial fishers. For example, fees. 6.
(25) from newly introduced recreational fishing licences were used to buy-out commercial licences in Victoria, Australia. Such fees removed 52% of commercial licences, and complete buy-outs were effective in some waters making these areas ROFAs. The buy-outs, which were voluntary and endorsed by the peak body for recreational fishing (Morison and McCormack 2003), may reduce conflict in the area that has been ongoing for many years (see Gladwin 1995; van der Elst 1997; Kearney 2002a). However the long-term effects of the buy-outs on both the commercial and recreational sectors still needs to be assessed (Morison and McCormack 2003). The success of ROFAs in resolving conflict resulting from blame for catch declines may further depend on whether the impacts of the commercial sector on recreational catches are perceived or real. In many cases perceptions of recreational catch declines are not examined, and where there is a lack of data anecdotal claims take precedence (Smith and Pollard 1995; Griffin and Walters 1999). Where perceptions are examined, results are mixed. In some cases the impact of commercial fishing on recreational catches is found to be real, and intervention is required. For example, in 1997 an experimental tuna longline fishery was initiated off South Africa. Due to a number of factors, the ‘bycatch’ of swordfish (Xiphias gladius) made up 70% of the total landed catch up to January 1999. At the same time there was a dramatic decline in recreational catch of swordfish. This situation, not surprisingly, led to considerable conflict between the two sectors, and the recreational sector strongly pushed for a closure of the commercial longline fishery1 (Griffiths and Lamberth 2002). In many fisheries, however, catch declines are misperceived. For example, Sztramko et al. (1991) examined anglers’ catch rates at Long Point Bay on Lake Erie, Canada. Anglers were concerned about the effects of incidental catches of smallmouth bass (Micropterus dolomieu) in commercial gill nets targeting yellow-perch (Perca flavescens) and were thus calling for tighter restrictions on gill netting in the area. Creel surveys from the area’s own angling group, however, showed an increasing trend in angler success rates. Thus, further restriction or banning of gill netting was not warranted, and the conflict was diffused. In many cases conflict results from misperceptions, and thus many conflicts can be resolved through education of the 1. For interest, closure of the longline fishery based on unavoidable swordfish bycatch. was unlikely to occur at the time of publication, as foreign vessels within the fish’s migratory path also target the South African swordfish stock. There is no international limit on swordfish catch; however the South African longline fleet has been limited to a swordfish catch of 3500 tonnes (Griffiths and Lamberth 2002).. 7.
(26) parties involved rather than via ROFAs (see Ruello and Henry 1977; Henry 1984; Kearney 1995b; McLeod 1995; Aas and Skurdal 1996; Griffiths and Lamberth 2002).. ii) Method of implementation: Recreational Fishing Only Areas can be implemented in a number of ways including political lobbying, through a management agency decision, or via consultation and stakeholder involvement. Whether conflict is resolved by ROFAs appears to depend on how the ROFAs are implemented. Many ROFAs are implemented via political lobbying. Some authors consider fisheries managers have dealt with allocation issues by minimising the “political whinge” between user groups: i.e. managers have dealt with public perception and made adjustment to rules as combined fishing and/or lobbying pressure has increased, taking the minimal action needed to satisfy the most vocal stakeholders in what are regarded mostly as local concerns (Brayford 1995; Rogers and Gould 1995; Walters and Cox 1999; Rogers and Curnow 2003). Recreational fishers have significant power when it comes to influencing political decisions regarding allocation of fisheries resources (Owen 1981; Hushak et al. 1986; Charles 1992; Adams 1994; Kearney 2001; McPhee et al. 2002; Walters 2003). Australia’s peak national body for recreational and sport fishing, Recfish, states that in many reallocation scenarios, scientific considerations will be over-ridden by political decisions as a result of vocal and skilful political lobbying. They further state that anglers’ awareness of lobbying power is reflected in the common bumper-sticker “I fish and I vote” (Recfish 2001). Apparently, calls for ROFAs are often made by only a small number of vocal recreational fishers. They are however, the people to whom the government is most responsive (Ruello and Henry 1977; Beaumariage 1978; Henry 1984; McPhee 2001). Even the perception of such a political situation may increase the conflict between the groups as commercial fishers see the government bowing to a select group of recreational fishers who may not actually be representative of the recreational sector (Sutton 2006). The most well known international example of recreational fishing groups’ political power is the Florida ‘netban’: In this case, anglers perceived inshore commercial net fishing as having a detrimental impact on fish stocks and mega-fauna, and they sought to introduce a ban on the use of entanglement nets. An active multimillion-dollar media campaign ensued, with recreational fishing and conservation lobby groups arguing the nets indiscriminately killed endangered species and depleted finfish. 8.
(27) stocks. Despite the fact that available scientific information did not support these perceptions, the controversial campaign was successful in encouraging voters to approve a constitutional amendment in 1994 that prohibited the use of commercial entanglement nets in State waters, as well as other nets larger than 500 square feet in nearshore and inshore waters (Renard 1995; Anderson 1999; Adams 2000; Smith et al. 2003). While ROFAs introduced via political decisions may appear to resolve conflict issues in the short-term, long-term solutions need better future planning. The use and success of political lobbying can lead to a distrust of management, and tensions over shared access will likely intensify unless there is consistency in allocation decisions (Brayford 1995; Rogers and Gould 1995; Daigle et al. 1996; Nakaya 1998; Walters and Cox 1999; Recfish 2001), which is difficult where political, local scale decisions are involved. Adjustment in resource access between groups has historically taken place through government intervention. However managers are beginning to realise that conflict over resource allocations is more likely to be resolved if the relevant stakeholders are involved in decision-making (Charles 1992; Gladwin 1995; Hancock 1995; Rogers and Gould 1995; Hutton and Pitcher 1998; Department of Fisheries Western Australia 2000; McMurran 2000; Recfish 2001; Kearney 2002a). For example, recurring tensions regarding commercial netting in coastal waters in Portland Bay, Victoria (Australia) were resolved in the 1990s through mediation meetings involving recreational and commercial fishing representatives. Anglers were calling for a ban on commercial netting based on a perception (that was not supported by science) that commercial netting was depleting fish stocks and/or affecting the quality of angling. The issues were highly emotive, but it was recognised that this was social problem, not a stock conservation problem. Together with a mediator, both sectors developed a Code of Practice which included a “net free zone” (i.e. ROFA) in one area for times when recreational fishing participation was highest (i.e. Christmas holidays, during recreational fishing competitions and on long weekends), and a net free zone in another area for the whole year. The code of practice was approved by all delegates (Gladwin 1995). Regardless of how ROFAs are implemented, the question of whether they are successful in resolving conflict has yet to be answered – there are no published examples of ROFAs being examined post-implementation to test whether they were successful in reducing or resolving conflict. Conflict is often manifested via media articles and letters to fisheries departments (Ruello and Henry 1977; Henry 1984; 9.
(28) Anderson 1999; Kearney 2002b): if such media outlining the conflict cease, then it could be assumed that the conflict is resolved. In many cases, however the same issues are raised again some years after ROFAs are implemented (or called for but deemed unnecessary at the time), usually with demands for further ROFAs. For example, in Australia’s Northern Territory there has been a progressive implementation of ROFAs since the 1960s (Reed 1992; Pender 1995; Griffin 2003). Initially, commercial gill netting was prohibited in freshwater as a specific resource conservation measure. In 1978 the Mary River was closed to commercial fishing at the river mouth in response to declining recreational catch rates and high commercial pressure. This closure was extended in 1989. From 1987 the Commonwealth began progressively closing the Alligator Rivers in Kakadu to commercial fishing. The Daly River in 1989, and the Roper River in 1991 were closed to commercial netting in response to recreational fishing requests and in recognition of the importance of recreational fishing to the Northern Territory’s outdoor oriented lifestyle (Reed 1992). In 2002, the MacArthur River was closed to commercial fishing, apparently due to lobbying efforts of the Amateur Fisherman’s Association of the Northern Territory (AFANT) (AFANT 2005). Perhaps understandably, commercial fishers are concerned that there seems to be no “bottom line” when it comes to negotiations with anglers over resource allocation (Loveday 1995). Consequently, to reduce conflict in the long-term the implementation of ROFAs requires more future planning and consistency of implementation based on scientific knowledge, rather than via the current ‘ad-hoc’ manner (Brayford 1995; McLeod 1995; Rogers and Gould 1995). In many cases recreational fishers are unaware of previous changes that have been made in their favour, which highlights the need to make such information more readily available (Ruello and Henry 1977; The Recreational Fishing Consultative Committee 1994).. b) Improved recreational catches Recreational fishers advocate the implementation of ROFAs on the presumption that such action will improve the quality of angling (in terms of numbers and size of certain species caught) (Ruello and Henry 1977; Kearney 2001; Cox et al. 2003). Such improvement in angling quality may increase the value current anglers place on fishing (Hendee 1974; Graefe and Fedler 1986). There is significant anecdotal evidence through fishing clubs and the media that ROFAs do result in improved catches for anglers (see Griffin 1995; Brown 2001; Anon 2002b; AFANT 2005). There is at least an expectation that anglers’ catches will improve in ROFAs given the removal of. 10.
(29) commercial fishing effort (so that fish previously harvested by commercial fishers are now available to the recreational sector only) (Steffe et al. 2005b), however there is no scientific information to support claims of improved fishing quality in most cases, and therefore anecdotal claims can take precedence (Smith and Pollard 1995; Griffin and Walters 1999). There are a few cases where recreational catches are examined in ROFAs following their implementation. For example, in Iceland, anglers found a 28-35% increase in their catch when they effectively closed the River Hvitá mainstream to commercial netting from 1991. Recreational catch rates in the ‘closed’ area (i.e. ROFA) from 1991-2000 were compared to catch rates 10 years prior to the closure for the same area. The post-closure catch rates were also compared to catches in two other rivers that remained open to commercial fishing. Results showed significant increases in rod catches in the ROFA post-closure, while in the ‘open’ rivers the catches declined. Note that in this fishery the number of rods allowed on each river is fixed: i.e. it is not open access for recreational fishing (Einarsson and Gudbergsson 2003). More recently, Steffe et al. (2005a) examined recreational harvest in the Tuross Lake estuary in NSW, which was declared a ROFA in May 2002. They compared two separate daytime, boat-based, recreational fishing surveys, with the first annual survey prior to ROFA implementation (March 1999 – Feb 2000), and the second 1.5 – 2.5 years post-ROFA implementation (Dec 2003 – Nov 2004). They found significant increases in recreational fishing effort (about 25%) in the post-ROFA survey year, and significant increases in harvest of many recreationally important species such as dusky flathead and bream. Some species harvest decreased, meaning there was no difference by number between survey years in the total annual harvest, but there was a significant difference by weight (41.6%) in the annual harvest of fish, crabs and cephalopods. This was due to the increase in mean and median size of most species harvested post-ROFA implementation. Further, the proportional increases in recreational harvest were all much larger than the corresponding proportional change in fishing effort. The authors stated the changes detected may be in part attributable to the implementation of the ROFA and/or may be in part attributable to natural fluctuations in fish abundance and catchability (which can be large in an open estuary system). Nonetheless, the comparison between the two annual survey periods shows that real differences occurred in the recreational boat-based fishery in the Tuross Lake estuary since the implementation of the ROFA. In many other fisheries, improvements in recreational catches are not evident. For example the Florida net ban was expected to result in improved recreational catches in terms of catch per unit effort (CPUE). This is not evident according to 11.
(30) current publications, which some authors suggest is due to increases in recreational effort to the degree that total fishing mortality rates returned to previous levels (Anderson 1999; Adams 2000; Walters 2003). Ruello and Henry (1977) found no noticeable improvements in recreational catches in Australia’s Port Hacking and Brisbane waters despite being closed to commercial netting since the 1930s. They further stated that Botany Bay, which was open to commercial fishing, was considered a better angling area than either of these two ROFAs, despite anecdotal claims to the contrary2. In the Pumicestone Passage in Queensland, O’Neill (2000) examined recreational catches before and after commercial fishing was banned in 1995. No improvements in recreational catch rates were found. Unfortunately, most of the studies that do examine recreational catches in ROFAs lack scientific rigour, either through a lack of comparable catch data from before and after ROFA implementation, a lack of time series data following the ROFA, or a lack of replication in sites. For instance, Einarsson’s (2003) study in Iceland, while examining before and after closure data, was unable to provide a replicate ROFA with which to compare catch rates. Thus the changes in catch rates may have been a characteristic of the particular area. Steffe et al.’s (2005a) study provides a good comparison of recreational harvest pre- and post-ROFA implementation, however they do state that changes may be due to natural fluctuations and they recommend continued monitoring at intervals of about 3-5 years. Ruello and Henry’s (1977) observations for Port Hacking and Brisbane waters were based on anecdotal information from ‘experienced’ fishers. Finally, O’Neill (2000) recommended reexamining angler catches in the Pumicestone Passage in future years as he sampled probably too soon since the closure to notice any potential catch improvements. O’Neill also noted he needed to interview twice as many anglers to have about an 80% confidence in detecting a 15% difference in catch rates between the before- and afterclosure periods. A more scientifically rigorous study was successful in showing higher fish abundances in ROFAs compared with non-ROFAs, although they did not examine recreational catches: Halliday et al. (2001) used commercial gill net fishing techniques to compare estuarine catches in three ROFAs and three non-ROFAs in north Queensland bimonthly over two years. The study found higher abundances of large barramundi (over 800 mm total length) in ROFAs compared to non-ROFAs. These results suggest improved angler catches of large barramundi in ROFAs are possible. 2. Interestingly Botany Bay was declared a ROFA in 2002 (NSW Fisheries 2003) – 25. years after Ruello and Henry’s publication. 12.
(31) However, many studies show that there is not a strong relationship between fish abundance and angler catch rates because angling success is highly variable (Ruello and Henry 1977; Johnson and Carpenter 1994; Anderson 1999; Pierce and Tomcko 2003). For example, in Lake Mendota, Wisconsin, examination of 7-year creel survey data for the walleye (Stizostedion vitreum vitreum) fishery revealed that catch per unit effort varied independently of fish abundance (Johnson and Carpenter 1994). Further, the closure of the Mary River in the Northern Territory to commercial gill net fishing resulted in expectations of improved angling success. However, despite a rise in the availability of barramundi (due to commercial exclusion as well as a good wet season and strong recruitment), angler success rate did not change, with only 50% of parties landing a barramundi (Griffin and Walters 1999; Griffin 2003). With any commercial or recreational fishery, there are factors that affect catch rates outside of the abundance of fish stocks, such as the composition of fishing fleet (including number and skill level of fishers), method of fishing, and where and when fishing occurs (Maunder and Punt 2004). Another explanation for the lack of relationship between recreational catch or success rate and stock abundance may be that overall recreational fishing effort increases as stocks increase such that an individual angler’s fishing quality doesn’t improve because there is higher competition between more anglers (Cox and Walters 2002; Cox et al. 2002; Le Goffe and Salanié 2005). Some authors suggest that recreational catches may improve in newly implemented ROFAs, but such benefits may only be realised by 10% of the recreational fishing population – i.e. by the more skilled anglers who catch 90% of the recreational harvest – rather than the average angler (Johnson and Carpenter 1994; Griffin and Walters 1999; McPhee and Hundloe 2004).. c) Flow-on benefits for the community If improved recreational catches are expected or perceived, ROFAs may result in greater recreational fishing effort (Griffin and Walters 1999; Cox and Walters 2002; Cox et al. 2002; Pereira and Hansen 2003; Post et al. 2003; Denny and Babcock 2004). Such increased participation may in turn result in benefit to the community in terms of increased expenditure within the community (Hushak et al. 1986; Dominion 2002; Pereira and Hansen 2003) and potentially increased social well-being, such as health, social cohesion and quality of life, which result from participation in an outdoor recreational past-time such as fishing (Pretty et al. 2005; Cox 2006). The possibilities of increased effort and economic benefit are considered below. While social well-being is. 13.
Figure


+7


Related documents
Mission is to strengthen Latino communities through social, economic, education, and health services; leadership development; and
The findings that the students’ disruptive, time pressure & workload and relations with school principal are significant predictors of teachers’ job stress were consistent
When a client wants to create a group and send an initial message, it retrieves the initial keys from the Delivery Service, verifies them using the identity key, and creates the
In this paper we consider a general model of phyloge- netic network with lateral gene transfers similar to the species graphs’ approach: LGT networks , which consist roughly of a
9 Among others, Jenni Millbank ‘The Role of Rights in Asylum Claims based on Sexual Orientation’ [2004] HRLR193-228; James Hathaway, James Pobjoy ‘Queer Cases Make Bad Law’
At the level of the second anterior intercostal space the QRS complex has the configuration which the theory of "semi- direct" leads regards as characteristic of the
Continuous atrial electrical activity of flutter has been detected at atrial rates as slow as 88 per minute. Some
Significance of the study is when the researcher points out the solutions to the problem or answer to the question that can or will influence education theory
