ʺ
RP- HIGH PERFORMANCE LIQUID CHROMATOGRAPHY
Dissertation submitted to
THE TAMILNADU Dr. M.G.R. MEDICAL UNIVERSITY
CHENNAI
In partial fulfillment for the award of degree of
MASTER OF PHARMACY
IN
DEPARTMENT OF PHARMACEUTICAL ANALYSIS
Submitted By
HITLER NINGTHOUJAM (Reg.No-26117431)
Under the guidance of
Dr. K.K.SENTHIL KUMAR M. Pharm, Ph.D.,
HOD & ASSOCIATE PROFESSORDEPARTMENT OF PHARMACEUTICAL ANALYSIS
DEPARTMENT OF PHARMACEUTICAL ANALYSIS
CHERRAAN`S COLLEGE OF PHARMACY,
(Affiliated to the Tamilnadu Dr.M.G.R medical university, Chennai)
Approved by The Govt. of Tamilnadu, Chennai All India Council for Technical Education, New Delhi Recognized by pharmacy council of India, New Delhi
CERTIFICATE
This is to certify that the Dissertation
entitled “
ESTIMATION AND VALIDATION OFGEFITINIB BY USING RP- HIGH PERFORMANCE LIQUID CHROMATOGRAPHY”
Submitted to The Tamilnadu Dr. M.G.R Medical University, Chennai is a bonafide project work
of Reg No: 26117431 carried out in the Department of Pharmaceutical Analysis, Cherraan’s
college of pharmacy, Coimbatore for the partial fulfillment for the degree of Master of Pharmacy
under my guidance during the academic year 2013-2014.
This work is original and has not been submitted earlier for the award of any other degree or
diploma of this or any other university.
Place: Coimbatore
Date: Dr. K.K. Senthil Kumar, M.Pharm, PhD., HOD and Associate Professor Department of Pharmaceutical Analysis, Cherraan’s college of Pharmacy
(Affiliated to the Tamilnadu Dr.M.G.R medical university, Chennai)
Approved by The Govt. of Tamilnadu, Chennai All India Council for Technical Education, New Delhi Recognized by pharmacy council of India, New Delhi
CERTIFICATE
This is to certify that the Dissertation
entitled “
ESTIMATIONAND VALIDATION OFGEFITINIB BY USING RP- HIGH PERFORMANCE LIQUID CHROMATOGRAPHY”
submitted to The Tamilnadu Dr. M.G.R Medical University, Chennai, is a bonafide project work
Reg No: 26117431 carried out in the Department of Pharmaceutical Analysis, Cherraan’s
college of pharmacy, Coimbatore for the partial fulfillment for the degree of Master of Pharmacy
under the guidance of Dr. K.K Senthil Kumar, M.Pharm,PhD., HOD, Department of
Pharmaceutical Analysis, Cherraan’s College of Pharmacy, Coimbatore, during the academic
year 2013-2014.
Place: Coimbatore Dr. N. Thirumoorthy, M.Pharm, Ph.D., Date: Principal & HOD
Department of pharmaceutics Cherraan’s college of Pharmacy
ABSTRACT
In the present work, RP-HPLC method has been developed for the quantitative estimation
of Gefitinib in Pharmaceutical formulations.
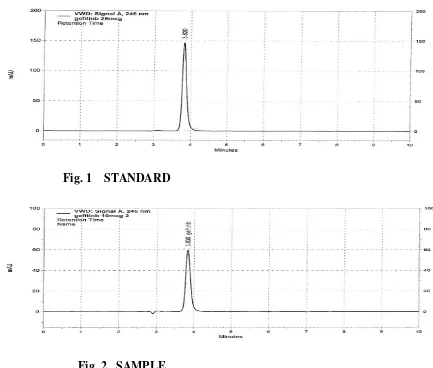
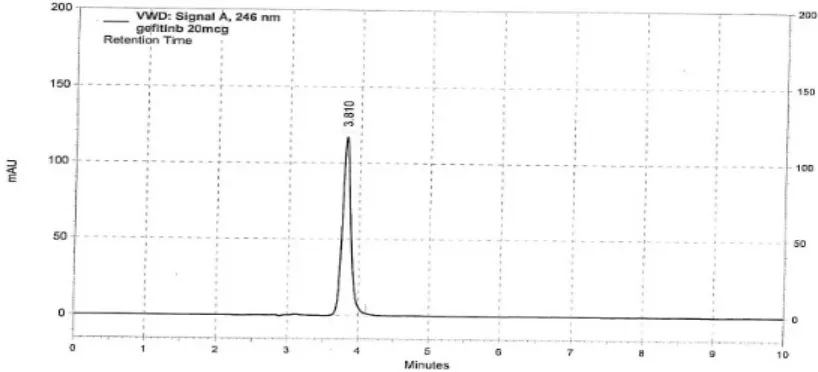
A rapid and sensitive RP-HPLC Method with UV detection (246 nm) for routine analysis
of Gefitinib in Pharmaceutical formulation was developed using gradient pump (LC-10AT vp
pump), The separations were achieved on a Agilents’s 5µ C18 (2) 100A, 250X4.6mm, column
with UV detection at 246 nm. Chromatography was performed with mobile phase containing a
mixture of 0.1% Triflouroacetic acid and Methanol (35:65 v/v) with flow rate 1 ml/min and
retention time at 3.8 min. In the range of 5 -30µg/ml, the linearity of Gefitinib shows a correlation
co-efficient of 0.999. The proposed method was validated by determining sensitivity, accuracy,
precision, linearity, selectivity and system suitability parameters.
ACKNOWLEDGEMENT
It is proud and privileged honor for me to express my heart-felt thanks and gratitude
to all the persons who backed me directly or indirectly through out the
materialization of this project work at this magnitude.
First and foremost, I take this opportunity to express my sincere thanks and
obligation to
Dr. K.K SENTHIL KUMAR
, M.pharm, PhD, and HOD, Department
of Pharmaceutical Analysis, Cherraan’s college of pharmacy whose comprehensive
as well as effective supervision extended beyond the duty of a guide. His active
guidance, motivation and constant support helped me in the completion of my work
successfully.
I express my whole hearted gratitude and thanks to our beloved principal
Dr.N.THIRUMOORTHY
M.Phrarm, PhD., who is the reason for all the support
lend to me.
I also with pride and enormous gratification express my hearty thanks to Asst.prof
C.RubinaReichal M.pharm, Asst.prof J.Karthikeyan M.pharm, Asst.prof Mr.
Selvaraj M.pharm, Asst.prof Mr. Saravanan M.pharm (Department of
pharmaceutics), Asst prof Nagarajaperumal(Department of Pharmacology) for their
inspirative, impressive and innovative ideas as well as their constructive
I shall be failing my duty if I don’t state my sincere whole hearted thanks to all my
friends for their opinions and contributions to make the study a successful one. I
also express my sincere thanks to
Mr.PREM CHANDRA SHARMA
for his kind
help to complete this work.
I whole heartedly thank
Mr.KRISHAN PAL, Mr.RAVI MISHRA, Mr. MUJEEV
KHAN
, Ultra Drug Pvt Ltd,Baddi, Himachal Pradesh, for their kind suggestions in
my project work. Last but not the least, I like to thank all my colleagues and juniors
who helped me to complete this work. I express my sincere thanks to all of them.
Words are insufficient to express the care, affection encouragement, inspiriting
support and kind Co-operation from all staff members of
ULTRA DRUGS Pvt Ltd
.
to complete my project work.
I sincerely express my gratefulness to
Mr. K.C PALANISAMY
. Chairman of
Cherraan’s Institute of Health Sciences for the facilities provided to us in
I express my heartful gratitude to the
ALMIGHTY
, without whose grace all the
efforts would not achieve the good.
“
PARENTS ARE OUR LIVING GODS
” It gives us a sense of honor and pride to
our heartfelt and soulful thanks to our dear most lovable parents who act as the
guiding spirit behind all our activities. They sowed the seeds of hope on us and
seeing their happiness in our eyes. Its they who carved and made us the person
LIST OF ABBREVIATIONS
Abs : Absorbance
A.R. : Analytical Reagent
Conc : Concentration
Cm : Centimeter
FDA : Food and Drug Administration
gm : gram
HPLC : High Performance Thin Chromatography
ICH : International Conference on Harmonization
IP : Indian Pharmacopoeia
IUPAC : International Union of Pure and Applied Chemistry
LC : Liquid Chromatoraphy
LC-MS : Liquid Chromatography and Mass Spectroscopy
LOD : Limit of Detection
LOQ : Limit of Quantitation
Mm : Milli mole
mm : Millimeter
mV : Milli Volt
mL : Milli Litre
ng : Nano gram
nm : nano meter
NMT : Not More Than
OPA : Ortho Phosphric Acid
ppm : parts per million
pKa : Acid Dissociation Constant
QA : Quality Assurance
QC : Quality Control
r2 : Correlation Coefficient
Rf : Retardation Factor
Rt
: Retention time
RP-HPLC : : Reversed Phase High Performance Liquid Chromatography
RSD : Relative Standard Deviation
SD : Standard Deviation
TLC : Thin Layer Chromatography
USP : United States Pharmacopoeia
v/v : Volume /Volume
w/v : Weight/ Volume
WHO : World Health Organisation
°C : Centigrade Temperature
µg : micro gram
µm : micro meter
EGFR : Epidermal Growth Factor Receptor
ATP : Adensine Triphosphate
INR : International Normalised Ratio
CYP3A4 : Cytochrome P450, family 3, subfamily A, polypeptide 4
This is certify that the dissertation work entitled
“
ESTIMATION
AND
VALIDATION OF GEFITINIB BY USING RP- HIGH PERFORMANCE
LIQUID CHROMATOGRAPHY
”
submitted by HITLER NINGTHOUJAM
Reg.no: 26117431
to The Tamilnadu Dr. M.G.R Medical University, Chennai, in the
partial fulfillment for the degree of Master of Pharmacy in Pharmaceutical Analysis is a
record of bonafide work carried out by the candidate at the Department of Pharmaceutical
Analysis, Cherraan’s College of Pharmacy, Coimbatore and was evaluated by us during
the academic year 2013-2014.
The research work embodied in this work “ESTIMATION AND VALIDATION OF
GEFITINIB BY USING RP- HIGH PERFORMANCE LIQUID CHROMATOGRAPHY” was
carried out by me in the Department of Pharmaceutical Analysis, Cherraan’s college of Pharmacy,
Coimbatore under the direct supervision of Dr. K.K SENTHIL KUMAR, M.Pharm, PhD.,
HOD & Associate Professor of Pharmaceutical Analysis, Cherraan’s College of Pharmacy,
Coimbatore-39.
The dissertation submitted to the Tamilnadu Dr.M.G.R Medical University, Chennai, for
the award of degree of Master of Pharmacy in Pharmaceutical Analysis during the academic year
of 2013-2014
Place: Coimbatore HITLER NINGTHOUJAM
SL.NO
TITLE
PAGE.NO ABSTRACTLIST OF FIGURES
LIST OF TABLES
ABBREVIATION
1 INTRODUCTION 1-32
2 LITERATURE REVIEW 33-39
3 SCOPE AND OBJECTIVE OF WORK 40
4 PLAN OF WORK 41
5 INSTRUMENT AND REAGENTS 42-43
6 DRUG PROFILE 44-48
7 VALIDATION 49-71
8 RESULTS AND DISCUSSION 72-73
9 CONCLUSION 74
LIST OF FIGURES
SL.
NO.
TITLE
PAGES NO.
1
Chromatogram of Standard Drug 53
2
Chromatogram of Sample Drug 53
3
Chromatogram of Blank 55
4
Chromatogram of Gefitinib showing retention time (Rt) 55
5
Chromatogram of Gefitinib showing 50% accuracy 56
6
Chromatogram of Gefitinib showing 100% accuracy 56
7
Chromatogram of Gefitinib showing 150% accuracy 57
8
Linearity curve of Gefitinib 59
9
Chromatogram of Gefitinib showing a concentration of 5µ g/ml 59
10
Chromatogram of Gefitinib showing a concentration of 10µ g/ml 59
11
Chromatogram of Gefitinib showing a concentration of 15µ g/ml 60
12
Chromatogram of Gefitinib showing a concentration of 20µ g/ml 60
13
Chromatogram of Gefitinib showing a concentration of 25µ g/ml 60
14
Chromatogram of Gefitinib showing a concentration of 30µ g/ml 61
15
Chromatogram of Gefitinib showing intraday (Forenoon) precision 62
16
Chromatogram of Gefitinib showing intraday (Afternoon) precision 63
17
Chromatogram of Gefitinib showing interday (day1) precision 64
18
LIST OF TABLES
SL. NOTITLE
PAGES NO.1
Optimized Chromatographic conditions of Gefitinib
51
2
Characteristics parameters of calibration equation for the proposed HPLCmethod for Estimation of Gefitinib
52
3
Calculation of Percentage Purity
53
4
Accuracy of Gefitinib
57
5
Results of recovery of Gefitinib
58
6
Linearity data for Gefitinib
61
7
Intraday (Repeatability) study results by HPLC
63
8
Inter day (intermediate precision) study results by HPLC
65
9
LOD & LOQ of Gefitinib
65
10
Results of system suitability parameters
66
11
Ruggedness with Shimadzu System
68
12
Ruggedness with Agilent System
68
13
Intermediate Precision Day 1
69
14
Intermediate Precision Day 2
69
15
Robustness Remarks
1. Analytical Chemistry Introduction:
Analytical chemistry is the science of obtaining, processing, and communicating
information about the composition and structure of matter. In other words, it is the art and science
of determining what matter is and how much of it exists.
Defining analytical chemistry as the application of chemical knowledge ignores the
unique perspective that analytical chemists bring to the study of chemistry. The craft of analytical
chemistry is not in performing a routine analysis on a routine sample which more appropriately is
called chemical analysis, but in improving established analytical methods, in extending existing
analytical methods to new types of samples and in developing new analytical methods for
measuring chemical phenomena.
Analytical chemists perform qualitative and quantitative analysis use the science of
sampling, defining, isolating, concentrating and preserving samples, set error limits, validate and
verify results through calibration and standardization perform separations based on differential
chemical properties create new ways to make measurements interpret data in proper content and
communicate results.
They use their knowledge of chemistry, instrumentation, computers and statistics to
solve problems in almost all areas of chemistry. For example, their measurements are used to
assure compliance with environmental and other regulations to assure the safety and quality of
food, pharmaceuticals and water to support the legal process to help physicians diagnose disease
and to provide chemical measurements essential to trade and commerce.
Analytical chemists are employed in all aspects of chemical research in industry,
academia and government. They do basic laboratory research develop processes and products
design instruments used in analytical analysis, teach and work in marketing and law. Analytical
chemistry is a challenging profession that makes significant contributions to many fields of
1.1 PRINCIPLE OF CHROMATOGRAPHY
Chromatography is a technique by which a mixture sample is separated into components.
Although originally intended to separate and recover (isolate, purify and separation) the
components of a sample today complete chromatography systems are often used to both separate
and quantify sample components.
The term “chromatography" was coined by the Russian botanist, Tswett, who demonstrated that,
when a plant extract was carried by petroleum ether through a column consisting of a glass tube
packed with calcium carbonate powder, a number of dyes were separated. He named this analysis
method "Chromatographie" after "chroma" and "graphos", which are Greek words meaning
"color" and “to draw" respectively.
1.2 HIGH PERFORMANCE LIQUID CHROMATOGRAPHY (HPLC)
High performance liquid chromatography is basically a highly improved form of column
chromatography. Instead of a solvent being allowed to drip through a column under gravity, it is
forced through under high pressures of up to 400 atmospheres. That makes it much faster. It also
allows you to use a very much smaller particle size for the column packing material which gives a
much greater surface area for interactions between the stationary phase and the molecules flowing
past it. This allows a much better separation of the components of the mixture
The other major improvement over column chromatography concerns the detection methods
which can be used. These methods are highly automated and extremely sensitive.
A HPLC system is basically composed of
Mobile phase
Pump
Injector Column Column oven Detector.
The most common type of solvent reservoir is a glass bottle. Most of the manufacturer’s
supply these bottles with special caps Teflon tubing and filters to connect to the pump inlet
t and to the spurge gas (Helium) used to Remove Dissolved air. Filtration is needed to
eliminate suspended Particles and organic impurities
.
Fig: HPLC Basic Instrument.
Solvent system
:The mobile phases used in Reversed-Phase Chromatography are based on a polar solvent,
typically water to which a less polar solvent such as acetonitrile or methanol is added. Solvent
selectivity is controlled by the nature of the added solvent in the same way as was described for
Normal-Phase Chromatography. Solvents with large dipole moments such as methylene chloride
and 1,2-dichloroethane interacts preferentially with solutes that have large dipole moments such
chloroform, m-cresol and water interact preferentially with basic solutes such as amines and
sulfoxides and solvents that are good proton acceptors such as alcohols, ethers, and amines tend to
interact best with hydroxylated molecules such as acids and phenols.
Solvent degassing system
:The constituents of the mobile phase should be degassed and filtered before use. Several methods
are employed to remove the dissolved gases in the mobile phase. They include heating and
vacuum degassing with an aspirator, filtration through 0.45 filters, vacuum degassing with an
air-soluble membrane, helium purging ultra sonification or purging or combination of these methods.
HPLC systems are also provided an online degassing system which continuously removes the
dissolved gases from the mobile phase.
Gradient Elution:
Steady changes of the mobile phase composition during the chromatographic run is called
gradient elution. It may be considered as an analogy to the temperature programming in gas
chromatography.
The main purpose of gradient elution is to move strongly retained components of the mixture
faster, but having the least retained component well resolved.
Starting with the low content of the organic component in the eluent we allow the least retained
components to be separated. Strongly retained components will sit on the adsorbent surface on the
top of the column or will move very slowly.
When we start to increase an amount of organic component in the eluent (acetonitrile) then
strongly retained components will move faster and faster because of the steady increase of the
competition for the adsorption sites.
Gradient elution also increase quasi-efficiency of the column. In the isocratic elution, the longer a
component is retained the wider its peak. In gradient elution especially with the smooth gradient
shape without a flat regions the tail of the peak is always under the influence of the stronger
zone (peak) will move faster. This will tend to compress zone and narrow the resultant peak.
Performance of the gradient elution is strongly dependent on the instrumentation.
Isocratic Elution :
In this technique, the same mobile phase combination is used throughout the process of
separation. The same polarity or elute strength is maintained throughout the process. In isocratic
separation, mobile phase is prepared by using pure solvent or mixture of solvent i.e. , solvent of
same eluting power or polarity is used.
2. PUMPS:
Pumps are used to flow mobile phase at high pressure and at controlled flow rates. The pumps
must be capable of generating pressure of up to 5000 psi at flow rates up to 3ml/min for analytical
purpose. Pumps used in preparative scale hplc may be required to pump at flow rates of
upto20ml/min.The pumping systems used in HPLC can be categorized in three different types.
a. Reciprocating Pump
-single Piston
-Dual Piston
b. Syringe pumps
c. Constant pressure pumps
• Pneumatic Pump • Amplifier Pump
d. Displacement Pump
The first classification is according to the eluent flow rate that the pump is capable of delivering.
type. In reciprocating pumps, a motor driven reciprocating piston controls the flow of mobile
phase with the help of two ball check valves that opens and closes with then piston movement.
The flow is thus not continuous and damping of flow is necessary. This is accomplished using
pulse dampers which are a long coiled capillary tube.
Single Piston Reciprocating Pump:
The pump takes the form of a large metal syringe the piston being propelled by an electric motor
and driven by a worm gear. The speed of the motor determines the pump delivery. Another motor
actuates the piston by a different system of gearing to refill the syringe rapidly when required. The
solvent is sucked into the cylinder through a hole in the center of the piston and between the
piston and the outlet there is a coil that acts as a dampener. This type of pump is still occasionally
used for the mobile phase supply to microbore columns that require small volumes of mobile
phase to develop the separation. It is also sometimes used for reagent delivery in post column
derivatization as it can be made to deliver a very constant reagent supply at very low flow rates.
The single piston reciprocating pump was the first of its type to be used with high efficiency LC
columns (columns packed with small particles) and is still very popular today. It is simple in
design and relatively inexpensive.
Dual piston Reciprocating Pump:
A pump for producing a substantially smooth and continuous outflow of liquid at relatively high
pressure has two piston assemblies flow connected in series. The first piston assembly includes a
pressure piston having a long suction stroke and a relatively short and abrupt expulsion stroke. A
valve at the inlet of the pressurization piston allows flow to enter (but not exit) and a valve at the
outlet of the pressurization piston allows flow to exit (but not enter). The second piston assembly
includes a damper piston which functions as a mechanically driven damper to smooth the outflow
from the pressure piston. This smoothing is accomplished by storing of the liquid displaced by the
expulsion stroke of the pressure piston and then delivering the stored pressurized liquid to the
pump outlet during the suction stroke of the pressure piston. The drive for the pistons is
beginning of the expulsion stroke of the pressure piston to compensate for compressibility of the
liquid at high pressure. At low pressure the stepper motor drive is slowed down in response to the
sensing of the increase of the outflow during this short interval to maintain the outflow smooth
and continuous during this part of the cycle of operation.
b) SYRINGE PUMPS
:The first pumps to be used were syringe pumps which were in effect large stainless steel motor
driven hypodermic syringes. They provided a very constant flow rate which was virtually pulse
less but required a rather frequent, lengthy and involved refilling process. In addition unless some
form of marine engineering was employed the pumps could not operate at very high pressures.
Due to these disadvantages the syringe pump was soon replaced by piston pumps which, although
far from being pulse less, were much easier to operate. Today syringe pumps are rarely used in
mobile phase supplies but they are still used very effectively in both pre-column and post-column
reactors. Their very constant flow rate provides accurate reagent addition and in post-column
reactors does not introduce detector noise.
C
) CONSTANT PRESSURE PUMP
:Pneumatic Pump: The pneumatic pump is double piston pump one piston having a relatively
large diameter and the other a relatively small diameter. The two pistons are connected together
and fit inside two connected cylinders. The smaller cylinder is fitted with inlet and outlet
non-return valves. The large piston is driven by compressed air (the gas alternately driving the piston
in one direction and then the other) and actuates the smaller piston which pumps the liquid. The
system acts as a pressure amplifier as the output pressure from the pump with the smaller piston
will be equal to the pressure applied to the larger piston times the ratio of the cross-sectional area
of the larger piston to that of the smaller piston. This type of piston was originally used for normal
liquid chromatography separations but was found to be noisy and produced strong flow pulses
that destabilized the detector. It is now used almost exclusively for slurry packing liquid
chromatography columns. It is the simplest type of pump that can be designed to provide
pressures were achieved by pneumatic amplification and the syringe pump which was simply a
large strongly constructed syringe with a plunger that was driven by a motor. Today the majority
of modern chromatographs are fitted with reciprocating pumps fitted with either pistons or
diaphragms. For more information on HPLC pump requirements see the pump section in the
HPLC supplement. The pneumatic pump has a much larger flow capacity than the piston type
pumps but nowadays is largely used for column packing and not for general analysis. The
pneumatic pump can provide extremely high pressures and is relatively inexpensive, but the high
pressure models are a little cumbersome and at high flow rates can consume considerable
quantities of compressed air.
The second classification is according to the construction materials and the final classification
Constant pressure pump not constant flow can deliver high pressures.The Construction of
materials to be used for Pumps should be inert towards the solvents to be used .
3. INJECTOR
:Sample introduction can be accomplished in various ways. The simplest method is to use an
injection valve. In more sophisticated LC systems, automatic sampling devices are incorporated
where the sample is introduced with the help of auto samplers and microprocessors. In liquid
chromatography, liquid samples may be injected directly and solid samples need only be
dissolved in an appropriate solvent. The solvent need not be the mobile phase but frequently it is
judiciously chosen to avoid detector interference, column/component interference, loss
inefficiency or all of these. It is always best to remove particles from the sample by filtering over
a 5 µm filter or centrifuging, since continuous injections of particulate material will eventually
cause blockages in injection devices or columns. Sample sizes may vary widely. The availability
of highly sensitive detectors frequently allows use of the small samples which yield the highest
column performance.
a) Septum Injectors : For injecting the sample through a rubber septum. This is not common,
since the septum has to withstand high pressure.
b) Stop flow( on line ) Injectors : In which the flow of mobile phase is stopped for a while and
the sample is injected through a valve device.
c ) Rheodyne Injector ( Loop valve type) : It is the most popular injector. This has a fixed
volume loop like 20µl or 50µl or more. Injector has two modes, i.e. , load position when the
sample is loaded in the loop and inject mode, the sample is injected .
Examples of injectors
Insertion of a sample onto the column must be as a narrow plug so that the peak broadening
attributable to this step is negligible. The injection system itself has no dead volume.
The column is the heart of the chromatograph providing the means for separating a mixture into
components. The selectivity, capacity and efficiency of the column are all affected by the nature
of the packing material or the materials of construction.
Requirements for an Ideal HPLC Column:
1. Particles should be spherical and available in particle diameters ranging from 3 to10 µm. 2. Particles should withstand typical pressures encountered during HPLC {(900-3000 psi
(6.1-20.5 MPa) but ideally up to 4000 psi (27.2 MPa)} and should not swell or shrink with the
nature of the eluent.
3. Particles should have porosity in the range 50-70 %, extending to 80 % for Size-Exclusion
Chromatography.
4. Particles should contain no pores smaller than ~60 A0
in diameter and should have a uniform
pore size distribution.
5. Particles should be available with a range of mean pore diameters of 60-1000 A0 . 6. The internal surface of the material should be homogeneous.
7. The internal surface should be capable of modification to provide a range of surface
functionalities.
8. Packing materials should be chemically inert under all conditions of pH and eluent
composition.
9. The physico-chemical characteristics of the material should be reproducible from batch to
batch and from manufacturer to manufacturer.
10. The material should be readily available and relatively inexpensive and its chemical behavior
should be well understood.
There are different columns are available
A. Guard Columns: These columns are placed anterior to the separating column. This serve as a
protective factor that prolongs the life and usefulness of the separation column. They are
dependable columns designed to filter or remove 1) Particles that clog the separation column.
2)Compounds and ions that could ultimately cause "baseline drift", decreased resolution,
3) Compounds that may cause precipitation upon contact with the stationary or mobile phase. B. Derivatizing Columns: Pre- or post-primary column derivatization can be an important
aspect of the sample analysis. Reducing or altering the parent compound to a chemically related
daughter molecule or fragment elicits potentially tangible data which may complement other
results or prior analysis.
C. Capillary Columns: Advances in HPLC led to smaller analytical columns. Also known as
micro columns, capillary columns have a diameter much less than a millimeter and there are three
types: open-tubular, partially packed, and tightly packed. They allow the user to work with
nanoliter sample volumes, decreased flow rate, and decreased solvent volume usage which may
lead to cost effectiveness.
D. Fast Columns: One of the primary reasons for using these columns is to obtain improved
sample throughput (amount of compound per unit time). For many columns, increasing the flow
or migration rate through the stationary phase will adversely affect the resolution and separation.
Therefore, fast columns are designed to decrease time of the chromatographic analysis without
forsaking significant deviations in results.
E. Preparatory Columns: These columns are utilized when the objective is to prepare bulk
(milligrams) of sample for laboratory preparatory applications. A preparatory column usually has
a large column diameter which is designed to facilitate large volume injections into the HPLC
system.
The heart of the system is the column. The choice of common packing material and mobile phases
depend on the physical properties of the drug. The column is constructed from smooth bore
stainless steel tubing or heavy walled glass tubing to withstand high pressure.
F. Analytical Columns : Analytical columns is the most important part of the HPLC technique
which decides the efficiency of separation. There are several stationary phases available
depending upon the technique or mode of separation used.
COLUMN PACKING:
The packing used in modern HPLC consist of small rigid particles having a narrow particle size
Porous, Polymeric Beads Porous Layer Beds
Totally Porous Silica Particles (dia. <10 µm)
5. DETECTOR
:The detector converts a change in the column effluent into an electrical signal that is recorded by
the data system. There are different types of detectors used in HPLC. Liquid chromatographic
detectors are of two basic types. Bulk property detectors respond to a mobile-phase bulk
property, such as refractive index, dielectric constant, or density. In contrast, solute property
detectors respond to some property of solutes, such as UV absorbance, fluorescence, or diffusion
current, that is not possessed by the mobile phase.
A)
R
efractiveI
ndexD
etector: The detection principle involves measuring of the change in refractive index of the column effluent passing through the flow-cell. The greater the RIdifference between sample and mobile phase, the larger the imbalance will become. Thus, the
sensitivity will be higher for the higher difference in RI between sample and mobile phase. On
the other hand, in complex mixtures, sample components may cover a wide range of refractive
index values and some may closely match that of the mobile phase, becoming invisible to the
detector.
B) UV Detector: In these systems detection depends on absorption of UV ray energy by the
sample. They are capable to detect very wide range of compounds. The sensitivity ranges till
microgram quantity of estimation.
C) PDA detector: These are detectors which follow principle similar to UV detectors but the only
advantages are higher sensitivity and measure the entire absorption range i.e. It gives scan of
entire spectrum.
D) Evaporative Light Scattering Detector (ELSD): In the ELSD, the mobile phase enters the
detector is evaporated in a heated device and the remaining solute is finally detected by the way it
scatters light. The intensity of the light scattered from solid suspended particles depends on their
turn, depends on the size of droplets generated by the nebulizer and the concentration of solute in
the droplets. The droplet size produced in the instrument nebulizer depends on the physical
properties of the liquid and the relative velocity and flow-rates of the gas and liquid stream. The
importance of all these parameters emphasizes the need for careful design and rigorous
optimization of the instrument parts.
E) Electro Chemical Detector: This detector is specially suitable to estimate oxidisable &
reducible compounds .The principle is that when compound is either oxidized or reduced, the
chemical reaction produces electron flow. This flow is measured as current which is the function
of type and quantity of compound
F) Conductivity Detector: conductivity detector measures the conductivity of the mobile phase.
There is usually background conductivity which must be backed-off by suitable electronic
adjustments. If the mobile phase contains buffers the detector gives a base signal that completely
overwhelms that from any solute usually making detection impossible. Thus the electrical
conductivity detector is a bulk property detector. And senses all ions whether they are from a
solute or from the mobile phase.
G) Fluorescence detectors: Fluorescence detectors are probably the most sensitive among the
existing modern HPLC detectors. It is possible to detect even a presence of a single analyte
molecule in the flow cell. Typically, fluorescence sensitivity is 10 -1000 times higher than that of
the UV detector for strong UV absorbing materials. Fluorescence detectors are very specific and
selective among the others optical detectors. This is normally used as an advantage in the
measurement of specific fluorescent species in samples.
H) Mass Spectrometric Detection: The use of mass spectrometer for hplc detection is becoming
common place, despite the high cost of such detector and need for a skilled operator. A mass
spectrometer can facilitate hlpc method development and avoid common problem by
Recognizing unexpected and overlapping interference peaks to avoid a premature finish to method development.
The function of the detector in HPLC is to monitor the mobile phase as it merges from the
column.
Detectors are of usually four types:
Bulk Property Detectors Solute Property Detectors
Desolvation detectors (flame ionization etc.) LC-MS detectors.
MOST COMMONLY USED METHODS IN HPLC:
The four main types of HPLC techniques are
1. Normal-Phase Chromatography. 2. Reversed-Phase Chromatography. 3. Ion-Exchange Chromatography. 4. Size-Exclusion Chromatography.
Normal-Phase Chromatography
:The term "normal phase" is used to denote a chromatographic system in which a polar stationary
phase is employed and a less polar mobile phase is used for elution of the analytes. In the
normal-phase mode, neutral solutes in solution are separated on the basis of their polarity the more polar
the solute, the greater is its retention on the column. Since the mobile phase is less polar than the
stationary phase, increasing the polarity of the mobile phase results in decreased solute retention.
Normal-Phase chromatography is most commonly applied to the analysis of samples that are
soluble in non-polar solvents and it is particularly well suited to the separation of isomers and to
Although the separation mode has occasionally been misidentified as reversed phase it is normal
phase by virtue of the fact that increased aqueous levels of the mobile phase reduce carbohydrate
retention and elution order follows carbohydrate polarity.
Normal-phase separations have occasionally been combined off-line with Reversed-phase
chromatography to separate a wider range of species than could be accomplished by either
technique alone. The feasibility of such a system however is contingent on the compatibility of
the normal-phase eluent with that of the reversed-phase column.
Reversed-Phase Chromatography
:Reversed-Phase Chromatography, the most widely used chromatographic mode is used to separate
neutral molecules in solution on the basis of their hydrophobicity. As the name suggests,
Reversed-Phase Chromatography is the reverse of Normal-Phase Chromatography in the sense
that it involves the use of a non-polar stationary phase and a polar mobile phase. As a result, a
decrease in the polarity of the mobile phase results in a decrease in solute retention. Modern
Reversed-Phase Chromatography typically refers to the use of chemically bonded stationary
phases where a functional group is bonded to silica for this reason Reversed-Phase
Chromatography is often referred to in the literature as Bonded-Phase Chromatography.
Occasionally, however polymeric stationary phases such as polymathacrylate or polystyrene or
solid stationary phases such as porous graphitic carbon are used. Weak acids and weak bases for
which ionization can be suppressed, may be separated on reversed-phase columns by the
technique known as ion suppression. In this technique a buffer of appropriate pH is added to the
mobile phase to render the analyte neutral or only partially charged. Acidic buffers such as acetic
acid are used for the separation of weak acids and alkaline buffers are used for the separation of
weak bases.
The analysis of strong acids or strong bases using reversed-phase columns is typically
accomplished by the technique known as ion-pair chromatography (also commonly called
paired-ion or paired-ion-interactpaired-ion chromatography). In this technique, the pH of the eluent is adjusted in order
Reversed-Phase Chromatography is the most popular mode for the separation of low molecular
weight (<3000) neutral species that are soluble in water or other polar solvents. It is widely used
in the pharmaceutical industry for separation of species such as steroids, vitamins and β-blockers.
Because of the mobile phase in Reversed-Phase Chromatography is polar, Reversed-Phase
Chromatography is suited to the separation of polar molecules that either are insoluble in organic
solvents or bind too strongly to the polar normal-phase materials.
Ion-Exchange Chromatography
:In Ion-Exchange Chromatography (IEC) species are separated on the basis of differences in
electric charge. The primary mechanism of retention is the electrostatic attraction of ionic solutes
in solution to "fixed ions" of opposite charge on the stationary phase support. The stationary
phase or ion exchanger is classified as an anion-exchange material when the fixed ion carries a
positive charge and as a cation exchanger when it carries a negative charge.
A specialized form of IEC is ion chromatography (IC) which is the name applied to the analysis
of inorganic anions, cations and low molecular weight, water-soluble organic acids and bases.
Although any HPLC technique used to separate the above species can be termed ion
chromatography in general IC involves the use of ion-exchange columns and a conductivity
detector. Ion chromatography itself can be sub classified. Suppressed IC involves the use of a
membrane device known as a suppressor between the column and the detector to lower the
response of the eluent and thereby enhance the signal from the solute; nonsuppressed or
"single-column" IC does not contain a suppressor.
Size-Exclusion Chromatography
:Size-Exclusion Chromatography (SEC) is a convenient and highly predictable method for
separating simple mixtures whose components are sufficiently different in molecular weight. For
small molecules, a size difference of more than about 10% is required for acceptable resolution;
for macromolecules a twofold difference in molecular weight is necessary. Size-Exclusion
approximate molecular weight values for the components. It is an easy technique to understand,
and SEC can be applied to the separation of delicate bio macromolecules as well as to the
separation of synthetic organic polymers.
Because SEC is a gentle technique, rarely resulting in loss of sample or reaction, it has become a
popular choice for the separation of biologically active molecules. Each solute is retained as a
relatively narrow band, which facilitates solute detection with detectors of only moderate
sensitivity. One of the major applications of SEC is polymer characterization.
Applications of HPLC
1. Preparative HPLC refers to the process of isolation and purification of compounds. This
differs from analytical HPLC, where the focus is to obtain includes identifications,
quantification, and resolution of a compound.
2. Chemical separations can be accomplished using HPLC by utilizing the fact that certain
compounds have different migration rates given a particular column and mobile phase. Thus
the chromatography can separate compounds from each other using HPLC the extent or
degree of separation is mostly determined by the choice of stationary phase and mobile phase. 3. Purification refers to the process of separating or extracting the target compound from other
(possibly structurally related) compounds or contaminants. Each compound should have a
characteristic peak under certain chromatographic condition. The migration of the compounds
and contaminants through the column need to differ enough so that the pure desired
compound can be collected or extracted without incurring any other undesired compound. 4. Identification of the compounds by HPLC is a crucial part of any HPLC assay. The
parameters of this assay should be such that a clean peak of the known sample is observed
from the chromatograph. The identifying peak should have a reasonable retention time and
should be well separated from extraneous peaks at the detection levels, in which the assay
would be performed.
5. Quantification of compounds by HPLC is the process of determining the unknown
concentration of a compound in a solution. It involves injecting a series of known
6. The chromatograph of these known concentrations will give a series of peaks that correlate to
the concentration of the compound injected.
ADVANTAGES:
HPLC separations can be accomplished in a matter of minutes in some cases even in
seconds. High resolution of complex sample mixture into individual components can be
obtained.
• ••
• Rapid growth of HPLC is also because of its ability to analyse substances that are
unsuitable for gas liquid chromatographic (GLC) analysis due to non-volatility or
thermal-instability.
• ••
• Quantitative analysis is easily and accurately performed and errors of less than 1 % are
common to most HPLC methods.
• ••
• Depending on sample type and detector used it is frequently possible to measure 10-9 g or 1
ng of sample. With special detectors analysis down to 1012ng
has been reported.
DISADVANTAGES:
• ••
• HPLC instrumentation is expensive and represents a major investment for many
laboratories.
• ••
• It requires a proficient operator to handle the instrument. •
••
• HPLC cannot handle gas samples. •
••
• HPLC is poor identifier. It provides superior resolution but it does not provide the
information that identifies each peak.
• ••
• Sample preparation is often required. •
••
• Only one sample can be analyzed at a time. •
••
• Finally there is at present time no universal and sensitive detector.
Method development is done for
1) New products
2) Existing products
Methods are developed for new products when no official methods are available. Alternate
methods for existing (non-pharmacopoeial) products are developed to reduce the cost and time for
better precision and ruggedness. Trial runs are conducted, method is optimized and validated.
When alternate method proposed is intended to replace the existing procedure comparative
laboratory data including merit/demerits are made available.
Selection of analytical method
First stage in the selection or development of method is to establish what is to be measured and
how accurately it should be measured. The following analytical techniques are usually employed
for estimations of different components in
Titrimetric and gravimetric
Ultraviolet and visible spectrophotometry. Thin layer chromatography
High performance liquid chromatography (HPLC) Gas Chromatography (GC)
Atomic absorption spectrometry (AAS) Infra-Red absorption spectrophotometry.
Steps of method development
Documentation starts at the very beginning of the development process a system for full
documentation of the development studies must be established. All data relating to these studies
must be recorded in laboratory notebook or an electronic database.
1. Analyte standard characterization
a) All known information about the analyte and its structure is collected i.e., physical and
chemical properties, toxicity, purity, hygroscopic nature, solubility and stability.
b) The standard analyte (100% purity) is obtained. Necessary arrangement is made for the proper
c) When multiple components are to be analyzed in the sample matrix the number of components
is noted data is assembled and the availability of standards for each one is determined.
d) Only those methods (MS, GC, HPLC etc.,) that are compatible with sample stability are
considered.
2. Method requirements
The goals or requirements of the analytical method that need to be developed are considered and
the analytical figures of merit are defined. The required detection limits, selectivity, linearity,
range, accuracy and precision are defined.
3. Literature search and prior methodology
The literature for all types of information related to the analyte is surveyed. For synthesis,
physical and chemical properties solubility and relevant analytical methods. Books, periodicals,
chemical manufacturers and regulatory agency compendia such as USP / NF, AOAC and ASTM
publications are reviewed. Chemical Abstracts Service (CAS) automated computerized literature
searches are convenient.
4. Choosing a method
a) Using the information in the literatures and prints, methodology is adopted. The methods are
modified wherever necessary. Sometimes it is necessary to acquire additional instrumentation to
reproduce, modify, improve or validate existing methods for in house analytes and samples.
b) If there are no prior methods for the analyte in the literature from analogy the compounds that
are similar in structure and chemical properties are investigated and are worked out. There is
usually one compound for which analytical method already exist that is similar to the analyte of
interest.
5. Instrumental setup and initial studies
a) The required instrumentation is setup. Installation, operational and performance qualification of
b) Always new consumables (e.g. solvents, filters and gases) are used for example method
development is never started on a HPLC column that has been used earlier.
c) The analyte standard in a suitable injection / introduction solution and in known concentrations
and solvents are prepared. It is important to start with an authentic known standard rather than
with a complex sample matrix. If the sample is extremely close to the standard (e.g., bulk drug)
then it is possible to start work with the actual sample.
d) Analysis is done using analytical conditions described in the existing literature.
6. Optimization
During optimization one parameter is changed at a time, and set of conditions are isolated, rather
than using a trial and error approach. Work has been done from an organized methodical plan, and
every step is documented (in a lab notebook) in case of dead ends.
7. Documentation of analytical figures of merit
The originally determined analytical figures of merit limit of quantitation (LOQ), limit of
detection (LOD), linearity, time per analysis, cost, sample preparation etc., are documented.
8. Evaluation of method development with actual samples
The sample solution should lead to unequivocal, absolute identification of the analyte peak of
interest apart from all other matrix components.
9. Determination of percent recovery of actual sample and demonstration of
Quantitative sample analysis:
Percent recovery of spiked, authentic standard analyte into a sample matrix that is shown to
contain no analyte is determined. Reproducibility of recovery (average +/- standard deviation)
from sample to sample and whether recovery has been optimized has been shown. It is not
necessary to obtain 100% recovery as long as the results are reproducible and known with a high
Guidelines for analytical Method validation.
For pharmaceutical method guidelines are prescribed by
United State Pharmacopoeia (USP)
Food and Drug Administration (FDA)
World Health Organization (WHO)
International Conference on Harmonization (ICH)
These Guidelines provide a framework for performing validation. In general, methods for routine
analysis, standardization or regulatory submission must include studies on specificity, linearity,
accuracy, precision, range detection limit, quantitation limit and robustness.
United State Pharmacopoeia (USP):
USP defines analytical method validation as “The process by which it is established; by
laboratory studies that performance characteristics of method meet the requirement for intended
analytical application”.
Food and Drug Administration (FDA): FDA defines validation as “Establishing documented
evidence, which provides a high degree of assurance that a specific process will consistently
produce meeting its pre- determined specification and quality attributes”.
World Health Organization (WHO):
WHO defines validation as “Process of providing documented evidences that a system /
procedure dose what it is supposed to do precisely and reliably”.
International Conference on Harmonization (ICH):
ICH is tripartite agreement between European community, USA and Japan. Its purpose is to
provide a forum for constructive dialogue between regulatory authorities and Pharmacy industry
on real and perceived differences in technical requirements for product registration in European
Objective is lying down of minimum standards applicable uniformly, irrespective of where the
product is manufactured or marketed in the three regions.
The ICH documents give guidance on the necessity for revalidation in the following
circumstances.
Changes in the synthesis of the drug substances and Changes in the composition of the drug product
Validation:
It presents a discussion of the characteristics for consideration during the validation of the
analytical procedures included as part of registration applications submitted within the EC, Japan
and USA. This document does not necessarily seek to cover the testing that may be required for
registration in or export to other areas of the world. Furthermore this text presentation serves as a
collection of terms and their definitions and is not intended to provide direction on how to
accomplish validation. These terms and definitions are meant to bridge the differences that often
exist between various compendia and regulators of the EC, Japan and USA.
The objective of validation of an analytical procedure is to demonstrate that it is suitable for its
intended purpose. A tabular summation of the characteristics applicable to identification, control
of impurities and assay procedures is included. Other analytical procedures may be considered in
future additions to this document
.
Method validation is the process used to confirm that the analytical procedure employed for a
specific test is suitable for its intended use. Results from method validation can be used to judge
the quality, reliability and consistency of analytical results; it is an integral part of any good
analytical practice.
T
ypes of Validation
:Prospective validation: This is performed for all new equipments, products and
specifications and performance before the system is operational. This is t h e
most defendable type of validation.
Concurrent Validation: This is performed in two instances i.e., for existing Equipment
verification of proper installation along with specific Operational tests is done. In case
of an existing, infrequently made Product data is gathered from at least three successful
trials.
Retrospective validation:
This is establishing documented evidence that the Process is performed satisfactory and
consistently over time, based on review and analysis of historical data. The source of
such data is production and QA/QC records. The issues to be addressed here are changes
to equipment, process, specifications and other relevant changes in the past
Analytical methods need to be validated or revalidated before their introduction into routine use
whenever the conditions change for which the method has been validated (e.g., an instrument with
different characteristics or samples with a different matrix) and whenever the method is changed
and the change is outside the original scope of the method.
The validity of a specific method should be demonstrated in laboratory experiments using
samples or standards that are similar to unknown samples analyzed routinely. The preparation and
execution should follow a validation protocol, preferably written in a step by- step instruction
format. This proposed procedure assumes that the instrument has been selected and the method
has been developed. It meets criteria such as ease of use ability to be automated and to be
controlled by computer systems, costs per analysis, sample throughput, turnaround time and
environmental, health and safety requirements.
The validation characteristics
1. Specificity
2. Accuracy
3. Linearity
5. Limit of detection(LOD) & Limit of Quantification(LOQ)
6. Range
7. Robustness
8. Systen suitability Parameters
1. SPECIFICITY
a) Identification: Discrimination between compounds of closely related structures which are
likely to be present.
b) Assay and Impurity test: For chromatographic procedures, representative chromatogram.
Resolution of the two compounds which elute closest together. In case of non- specific assay is
used, a combination can be applied. Titration for assay, suitable test for impurities.
c) Impurities are available: Assay: Spiking pure substance (drug substance or drug product)
with appropriate levels of impurities and/or excipients. Assay result unaffected. Impurity test
spiking drug substance or drug product with appropriate levels of impurities and demonstrating
separation.
d) Impurities not available: Samples stored under relevant stress conditions assay: the two
results are compared impurity test: impurity profiles are compared, Peak purity test, diode array,
mass spectrometry.
2. ACCURACY
General 15 determinations over 3 concentrations covering specified range, upper and
lower concentrations 6 replicates middle one 3 replicates.
Reporting;
% Recovery or
Difference between mean and accepted true value Confidence interval
Drug substance
Application of analytical procedure to analyte of known purity( reference material). Drug product
Placebo + drug substance
Impurities(Quantification)
Adding known quantities of impurities to drug product Placebo + impurities
The individual or total impurities are determined e.g. weight/weight or area percent, in all cases with respect to the major analyte
3. LINEARITY
Linearity should be established across the range.
Minimum 5 concentrations:
dilution standard stock solution
separate weighing of synthetic mixtures Linear relationship, regression analysis
Correlation coefficient y-intercept
Slope of regression line Residual sum of squares.
4. PRECISION
Repeatability:
6 determinations at 100% of test concentration Intermediate precision
Different days Analysts Equipment
Not necessary to study these effects individually (2 x 6 determinations at 100 % of test concentration).
Recommended data Standard deviation
Relative standard deviation Confidence
5 .LIMIT OF DETECTION(LOD) & LIMIT OF QUANTIFICATION(LOQ)
stated experimental conditions. The LOD will not only depend on the procedure of
analysis but also on the type of instrument. (DL) =3.3×σ\ S mcg/ml
Where, σ = standard deviation of the response. S = slope of the calibration curve.
The slope S may be estimated from the calibration curve of the analyte. The estimate of σ may be carried out in a variety of ways.
Limit of quantification of an individual analytical method is the lowest concentration/ amount of analyte in a sample, which can be quantitatively determined with suitable
precision and accuracy under stated experimental conditions. The quantification limit is
used particularly for the determination of impurities and/ or degradation products. The
LOQ will not only depend on the procedure of analysis but also on the type of
instrument.
(QL) =10×σ\ S mcg/ml
Where, σ = standard deviation of the response S = slope of the calibration curve
6. RANGE
Assay of drug substance or finished product; 80 - 120 % of test solution.
Linearity; Reporting threshold to 120 % assay acceptance criterion. Content uniformity; 70 - 130 % of test concentration
Dissolution testing; ± 20% over specified range
Drug release testing; 20% after 1 hour up to 90% after 24 hours 0-110 % of label claim
7.
ROBUSTNESS:
Variations: ·
Stability of analytical solutions · Different equipment ·
Different analysts
HPLC:
Influence of pH in mobile phase Variations in mobile phase Different column
Temperature Rate Flow
8. SYSTEM SUITABILITY PARAMETERS
System suitability tests are most often applied to analytical instrumentation. They are designed to
evaluate the components of the analytical system in order to show that the performance of the
system meets the standard required by the method. After the method has been validated an overall
system suitability tests should be routinely run to determine if the operating system is performing
properly.
System suitability tests are integral part of the gas and liquid chromatographic methods. They are
used to verify that the resolution and reproducibility of the chromatographic system are adequate
for analysis
.The following information furnishes the parameters used to calculate the system performance
values for the separation of two chromatographic components.
Relative rétention (selectivity):
α = (t2-ta) / (t1-ta)
α = Relative retention.
t1 = Retention time of the first peak measured from point of injection.
t2 = Retention time of the second peak measured from point of injection.
ta = Retention time of an inert peak not retained by the column, measured from point of injection.
Theoretical plates: n = 16 (t / w) 2
Where, n = Theoretical plates.
t = Retention time of the component.
w = Width of the base of the component peak using tangent method.
Capacity factor:
K1 = (t2 / ta) – 1
Where K1 = Capacity factor.
Resolution:
R = 2 ( t2 - t1 ) / ( w2 + w1 )
Where, R = Resolution between a peak of interest (peak 2) and the peak preceding it (Peak 1).
W2 = Width of the base of component peak 2.
W1 = Width of the base of component peak 1.
Peak asymmetry: T = W0.05 / 2f
Where, T = Peak asymmetry or tailing factor.
W0.05 = Distance from the leading edge to the tailing edge of the peak, measured at a point 5 %
of the peak height from the baseline.
f = Distance from the peak maximum to the leading edge of the peak.
Where, N = Plates per meter.
L = Column length in meters.
HETP = L / n
Linear fit:
A linear calibration fit determines the best line (linear regression) for a series of calibration points.
A minimum of two calibration points is required to determine a linear fit.
The equation for calibrating the uncorrected amount is:
[Y = a X + b]
Where, Y = Component area or height.
a = Slop of the calibration line.
X = Uncorrected amount.
b = Y- axis intercept of the calibration line.
STATISTICAL ANALYSIS:
Statistical procedures and representative calculations:
The consistency and suitability of the developed method are substantiated through the statistical
analysis like standard deviation, relative standard deviation and theoretical plates per meter.
For Accuracy:
Standar deviation =σ=
Where, x = sample, xi = mean value of samples, n = number of samples
Relative Standard Deviation = σ/xi × 100
Where, A= Absorbance of drug
C= concentration of drug
L= Path length
Sandell’s sensitivity (µg/ cm2/0.001 absorbance units) = C/A×0.001
Where, C= concentration of drug
A= Absorbance of drug
Unit- (mcg/cm2) =0.001 absorbance)
Coefficient of variance (σ) = Σ(x-x) 2/ n-1
Regression Equation y = a+ b x
Slope = y/x
LITERATURE REVIEW
Gefitinib is an orally administered synthetic anticancer drug and few analytical methods found in
literature for the quantitative estimation in bulk drug and pharmaceutical formulations.
K. Ravi Shankar, et al.32
, has reported the development and validation of sensitive
reverse phase HPLC method for the determination of gefitinib in bulk and in its
pharmaceutical formulation. A rapid and sensitive RP-HPLC method with UV detection
at 205 nm for routine analysis of Gefitinib in bulk and pharmaceutical formulations was
developed. Chromatography was performed with mobile phase containing a mixture of
acetonitrile and 0.5% M ammonium dihydrogen phosphate buffer in the ratio of 30 : 70
v/v with flow rate 1.0 ml/min. The calibration curve of Gefitinib was found to be linear
over the range of 0.05 to 0.15 mg/ml with correlation coefficient of 0.99. Sensitivity,
accuracy, range, precision, robustness, ruggedness, stability, specificity, LOD, LOQ and
system suitability parameters were validated for the developed method.
Subhash Chandra Bose, et al 33
, have reported the quanlitative analysis of gefitinib by
quadrupole – time of flight (LCMS) coupled with PDA and ELSD detector, using dual
electro spray ionization (dual ESI ) multistage tandem mass spectrometry (LC-MS) were
used to identify of Gefitinib in tablet dosage form for validated and estimation. Efficient
chromatographic separation of analyte was achieved on Agilent XDB-C18 column ( 4.6 ×
50 mm, 1.8 µm) using an isocratic elution mode with a mobile phase comprised
acetonitrile and 0.1 % formic acid in water (75:25, v/v). The flow rate was 500µl / min .
The developed LC-MS method is validated with a respect to linearity, accuracy, precision,
specificity, limit of detection, limit of quantification and robustness. The method was
observed to be limit of detection and limit of quantification was found to be 5.56 ppm and
11.12 ppm respectively. The method was successfully used for applied the quantitative
P.V.V .Satyanarayana, et al 34
., has reported the development and validation of liquid
chromatography method for the estimation of gefitinib in pharmaceutical dosage form. A simple, specific, accurate and precise reverse phase high performance liquid
chromatographic method was developed and validated for the estimation of Gefitinib in
tablet dosage form. An Inertsil ODS C-18, 5µm column having 250 x 4.6mm internal
diameter in isocratic mode with mobile phase containing acetonit