A STUDY TO EVALUATE THE EFFECTIVENESS OF GUIDED
IMAGERY ON PAIN AND QUALITY OF LIFE AMONG
PATIENTS WITH CANCER IN A SELECTED
HOSPITAL AT COIMBATORE
COIMBATORE
A DISSERTATION SUBMITTED TO THE TAMILNADU
DR. M.G.R. MEDICAL UNIVERSITY, CHENNAI, IN PARTIAL
FULFILMENT OF REQUIREMENT FOR THE DEGREE OF
MASTER OF SCIENCE IN NURSING
A STUDY TO EVALUATE THE EFFECTIVENESS OF GUIDED
IMAGERY ON PAIN AND QUALITY OF LIFE AMONG
PATIENTS WITH CANCER IN A SELECTED
HOSPITAL AT COIMBATORE
BY
MAHESWARI. G
A DISSERTATION SUBMITTED TO THE TAMILNADU
DR. M.G.R. MEDICAL UNIVERSITY, CHENNAI, IN PARTIAL
FULFILMENT OF REQUIREMENT FOR THE DEGREE OF
MASTER OF SCIENCE IN NURSING
A STUDY TO EVALUATE THE EFFECTIVENESS OF GUIDED
IMAGERY ON PAIN AND QUALITY OF LIFE AMONG
PATIENTS WITH CANCER IN A SELECTED
HOSPITAL AT COIMBATORE
APPROVED BY THE DISSERTATION COMMITTEE ON……...
RESEARCH GUIDE ………...………...……… Prof. Dr. Mrs. R. ANNAPOORANI, MA., M.Phil., Ph.D., DSP., D.Sc.,
PROFESSOR IN RESEARCH METHODS, ANNAI MEENAKSHI COLLEGE OF NURSING, COIMBATORE.
CLINICAL GUIDE ………..……… Mrs. S. BALAMANI, M.Sc., (N)
READER,
ANNAI MEENAKSHI COLLEGE OF NURSING, COIMBATORE.
MEDICAL EXPERT ………...……… Dr. P. SUTHAHAR, MD.,RT.,
CONSULTANT CLINICAL ONCOLOGIST, ASHWIN HOSPITAL,
COIMBATORE.
A DISSERTATION SUBMITTED TO THE TAMILNADU DR. M.G.R. MEDICAL UNIVERSITY, CHENNAI, IN PARTIAL
FULFILMENT OF REQUIREMENT FOR THE DEGREE OF MASTER OF SCIENCE IN NURSING
APRIL 2014
VIVA VOICE
1. INTERNAL EXAMINAR………..…………
CERTIFIED THAT THIS IS THE BONAFIDE WORK OF
MAHESWARI.G
ANNAI MEENAKSHI COLLEGE OF NURSING,
COIMBATORE.
SUBMITTED IN PARTIAL FULFILMENT OF THE REQUIREMENT
FOR THE DEGREE OF MASTER OF SCIENCE IN NURSING TO
THE TAMILNADU DR. M.G.R. MEDICAL
UNIVERSITY, CHENNAI.
COLLEGE SEAL:
PROF. MRS. M. MUMTAZ, M.Sc., (N).,
PRINCIPAL,
ANNAI MEENAKSHI COLLEGE OF NURSING,
COIMBATORE,
DEDICATION
*********************
I dedicate this book to the
God almighty who blessed me to finish this work successfully
I dedicate this book to my lovable Parents
Mr.P.GNANASUNDRAM and Mrs.G.VANAJA, and my brother Mr.G. BALASUBRAMANI, DPE.,
those who made my life fruitful and stood as the building stone until the completion of this dissertation.
I dedicate this book to my father in law Mr.N.Murugesh, FORESTER.,and my mother in law Mrs.M.BAGAVATHI.,
those who made my life purposeful and meaningful .
I dedicate this book to my beloved husband Mr.M.AMIRTHAVEL
who stood by me as a rock of purpose to cheer me up I dedicate this book to my daughter Little Flower
A.PRANAVIKA
I dedicate this book to all my friends and colleagues who stood with me when I‟m in need of their help
ACKNOWLEDGEMENT
“GREAT IS THE LORD AND MOST WORTHY OF PRAISE; HIS GREATNESS NO ONE CAN FATHOM”.
It is my greatest privilege to recall many persons to whom I am indebted for their contribution in various ways directly and indirectly with profound sentiments of heartfelt gratitude. I offer my sincere thanks to all those who have contributed to the successful completion of this work.
I praise and thank the LORD ALMIGHTY who has been my source of strength in every step of my life and foundation of my knowledge and wisdom.
I express my sincere thanks to MR.M.PADMANABHAN, M.A, Correspondent of our college, for given me an opportunity to study in this esteemed institution.
Excellent teacher is a complex matrix of builder, moulder, artist, leader and harvester. I would like to express my immense gratitude and whole hearted thanks to our Principal Prof. Mrs. M. MUMTAZ M.Sc.(N) for her insisting support, constructive suggestions and immense encouragement which enabled me to reach my object. I consider it as a great honor and privilege to have completed under her supervision.
I owe my sincere gratitude to Research Guide Prof. R. ANNAPOORANI, MA., M.Phil., Ph.D.,DSP.,D.Sc., Professor in Research methodology, for her excellent guidance.
I am pleased to convey my profound thanks to my Medical Expert Dr.P. SUTHAHAR, MD.,RT., Consultant Clinical Oncologist, Ashwin Hospital, for his
excellent guidance, expert suggestion, encouragement and support that made the study purposeful.
I proudly and honestly express my deep sincere thanks and gratefulness to Dr.L.P.THANGAVELU, MS, FICS, FAIS, Dip(Lap surg), Surgical Oncologist, Ashwin Hospital, for his guidance throughout the commitment of this thesis work.
I honestly express my sincere thanks and gratefulness to MY SAMPLES for their cooperation.
I am forever grateful to my Class Co-ordinator, Mrs.M.DHANALAKSHMI, M.Sc(N)., Reader for her motivation, valuable suggestions and expert guidance to carry out this research successfully.
I am very much thankful to MR. N. CHINNA CHADAYAN, M.Sc (N)., Lecturer, for his help, guidance and valuable suggestions for my study.
I profoundly express my sincere thanks to DR.P.T. SALEENDRAN MBA., Ph.D., MR.ANNASWAMY M.Phil., Ph.D., for their assistance in statistics.
RAJALAKSHMI M.Sc., (N), R. VASUNADH, M.Sc., (N), Mrs. SHONA JACOB M.Sc., (N), for their valuable contribution and suggestion to this thesis.
I wish to express my heartfelt gratitude to all M.Sc.,(N) faculties of Annai Meenakshi College of Nursing for their valuable motivation, guidance, precise advice that gave me strength and determination throughout the course of study.
My special thanks to the experts who validated my tool and for their valuable suggestions and constructive comments.
I would like to acknowledge an immense help and support extended to me by MRS.SULOCHANA, B.L.I.Sc, librarian for her help in collection of literature.
I sincerely thank all the teaching faculty and non-teaching faculty members of Annai Meenakshi College of Nursing for the help rendered in various ways to fulfill my research work.
I think and remember all my friends with gratitude for helping me directly and indirectly in this study.
I submit my grateful thanks to my beloved parents, brother and husband for being the motivated force to the research project.
ABSTRACT
INTRODUCTION: Most patients with cancer experienced pain during treatment and its side effects of treatment. Ignoring this pain can contribute to worsening overall well-being of patients and slowed recovery process.
OBJECTIVE: The objective of this study was to investigate the effectiveness of guided imagery on pain and quality of life among patients with cancer.
DESIGN: A quantitative evaluative approach, a quasi experimental non randomized control group design.
PARTICIPANTS: 60 patients with cancer were selected by using non probability purposive sampling technique in Ashwin Hospital at Coimbatore.
INTERVENTION : Guided imagery twice a day for 20 minutes duration for 5 consecutive days was given to the experimental group.
TOOL: Standardized Verbal Descriptor Pain Assessment scale was used to evaluate the level of pain and modified EORTC QLQ-C30 scale was used to evaluate the quality of life.
RESULT: Analysis and interpretation was done by using independent „t‟ test and paired „t‟ test found significant values for pain 19.25 & 24.03, for quality of life 4.11 & 3.42 respectively at p<0.05 level and „r‟ value was -0.37.
CONCLUSION: Guided Imagery resulted in reduction in level of pain and improved quality of life among patients with cancer.
TABLE OF CONTENTS
CHAPTER
CONTENTS
PAGE NO
I
II
III
INTRODUCTION
Background of the Study Need for the Study Statement of the Problem Objectives
Hypotheses
Operational Definitions Assumptions
Delimitations Projected Outcome
REVIEW OF LITERATURE
Studies Related to Pain and quality of life in cancer among Patients with Cancer.
Studies Related to Guided Imagery.
Studies Related to Effectiveness of Guided Imagery on Pain among Patients with Cancer. Studies Related to Effectiveness of Guided Imagery on Quality of Life among Patients with Cancer.
CONCEPTUAL FRAMEWORK
METHODOLOGY
Research Approach Research Design Variables
Setting of the Study Population
CHAPTER
CONTENTS
PAGE NO
IV
V
VI
Sample
Criteria for Selection of Sample
Inclusion Criteria
Exclusion Criteria Sampling Technique Development of the Tool Description of the Tool Scoring Procedure
Guided Imagery Intervention Validity and Reliability Pilot Study
Data Collection Procedure Plan for Data Analysis Protection of Human Rights
DATA ANALYSIS AND INTERPRETATION
DISCUSSION
SUMMARY,CONCLUSION AND RECOMMENDATIONS
Summary
Major Study Findings
Conclusion
Implications of the Study
o Nursing Practice
o Nursing Education
o Nursing Research
o Nursing Administration
Recommendations
LIST OF TABLES
TABLE
No.
TITLE
PAGE
No.
1
2
3
4.1
4.2
5
Frequency and Percentage Distribution of Demographic Variables among Patients with Cancer in Experimental and Control Group. Frequency and Percentage Distribution on Pain among Patients with Cancer in Experimental Group and Control Group.
Frequency and Percentage Distribution on Quality of Life among Patients with Cancer in Experimental Group and Control Group. Mean, Standard Deviation, Mean Difference and „t‟ Value on Level of Pain among Patients with Cancer in Experimental Group and Control Group.
Mean, Standard Deviation, Mean Difference and „t‟ Value on Quality of Life among Patients with Cancer in Experimental and Control Group.
Mean, Standard Deviation and „r‟ Value on Post-test Score of level of Pain and Quality of Life among Patients with Cancer in Experimental Group.
Frequency, Percentage and
ᵡ
2 Distribution on Level of Pain among Patients with Cancer With Their Selected Demographic Variables in Experimental Group.Frequency, Percentage and
ᵡ
2 Distribution on Quality of Life among Patients with Cancer With Their Selected Demographic Variables in Experimental Group.Frequency, Percentage and
ᵡ
2 Distribution on Quality of Life among Patients with Cancer With Their Selected Demographic Variables in Control Group.6
7.1
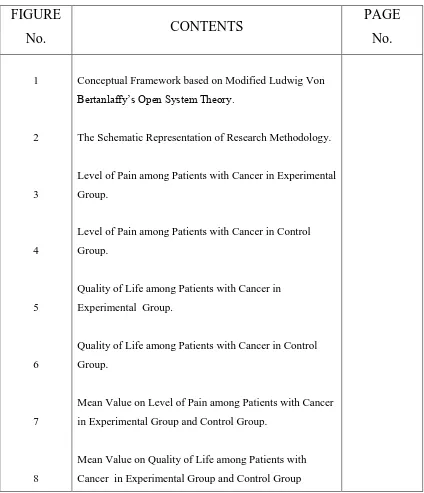
[image:12.595.103.530.86.679.2]LIST OF FIGURES
FIGURE
No.
CONTENTS
PAGE
No.
1
2
3
4
5
6
7
8
Conceptual Framework based on Modified Ludwig Von Bertanlaffy‟s Open System Theory.based on
General System
The Schematic Representation of Research Methodology.
Level of Pain among Patients with Cancer in Experimental Group.
Level of Pain among Patients with Cancer in Control Group.
Quality of Life among Patients with Cancer in Experimental Group.
Quality of Life among Patients with Cancer in Control Group.
Mean Value on Level of Pain among Patients with Cancer in Experimental Group and Control Group.
LIST OF APPENDICES
APPENDIX
TITLE
A
B
C
D
E
F
G
H
I
J
k
Letter Requesting Experts Opinion for Content Validity of the Tools and Intervention.
Certificate of Validation.
Name List of experts who Validated the Tool.
Letter Seeking and Granting Permission to Conduct Study.
Consent Form (English)
Consent Form (Tamil)
Structured Questionnaire(English)
Structured Questionnaire(Tamil)
Scoring Key
Guided Imagery Procedure
CHAPTER I
INTRODUCTION
“The quality of life is more important than life itself”
- Alexis Carrel
Background of the Study
Cancer is a common condition and a serious health problem. More than one in three people will develop some form of cancer during their life time. The origin of the word cancer is credited to the Greek physician Hippocrates, who is considered the “Father of Medicine”. Hippocrates used the terms „carcinos‟ and „carcinoma‟ to describe non- ulcer forming and ulcer-forming tumors. The Roman Physician, Celsus later translated the Greek terms into cancer.
Cancer is a general term used to refer to a condition where the body‟s cells begin to grow and reproduce in an uncontrollable way. These cells can then invade and destroy healthy tissue, including organs. Cancer sometimes begins in one part of the body before spreading to other parts.
Cancer patients often experience significant symptoms due to tumour and cancer treatments. Pain is a common symptom of cancer and experienced both by patients and caregivers. Most cancer pain is caused by the tumour pressing on bones, nerves or other organs of the body. Sometimes pain is related to cancer treatment like chemotherapy drugs that cause numbness and tingling sensation in the hands and feet or a burning sensation at the place where they are injected. Radiotherapy can cause skin redness and irritation. Some of them may have the general aches and pains from time to time.
According to Davis. M, (2010) cancer pain is a complex temporarily changing symptom which is the end result of mixed pain mechanism. It involves inflammatory neuropathic, ischemic and compression mechanism at multiple sites. It is a subjective, heterogeneous experience that is modified by individual genetics, past history, mood, expatiation and culture.
Cancer pain can be acute or chronic. Acute pain is due to damage caused by an injury and tends to last for a short time. Chronic pain is caused by changes to nerves. Nerve changes may occur due to cancer pressing on nerves or due to chemicals produced by a tumour. It can also be caused by cancer treatment.
effectively as possible, a patient‟s quality of life often was the last thing considered. So many researchers are found the challenge of helping patients and survivors maintain or regain a sense of well-being.
World Health Organization (2008) has identified cancer pain as a major international problem and pain control has become a critical element in the comprehensive care of many cancer patients. More patients surviving with cancer are experiencing period of significantly extended life as a result of advances in early diagnosis and treatment.
Tannock I, et al (1989) found that improvement in multiple areas of quality of life and in well being coincided with reduction in pain associated with bone metastasis from prostate cancer.
Padilla, et al (1990) studied cancer patients with chronic pain and identified three dimensions of life affected by the pain experience : physical well-being, psychological well-being and interpersonal well-being.
According to National Cancer Institute (2013) pain can be controlled in most patients with cancer. Although cancer pain cannot always be relieved completely, there are ways to lessen pain in most patients. Pain control can improve quality of life all through cancer treatments and after it ends.
surgery, chemotherapy, radiation therapy, hormone therapy, immunotherapy, gene therapy, along with that complementary and alternative therapy that are used for the cancer treatment. The complementary therapies are mind- body approaches which includes guided imagery, meditation, massage therapy, body-mind practices like Yoga, aerobic exercise etc.
According to Martin Rossman, Diplac, (2007) the two goal of complementary therapies are to kill cancer cells and tumour or reduce their numbers and ability to grow, reproduce and metastasis. The other perhaps best called the healing goal is to support the well-being and resistance of the patient.
Imagery influences the experience of pain by acting as a cognitive distraction. Imagery may function as one of many relaxation techniques. The relaxation effect results in reduction of autonomic activity and the concomitant physiological responses to catecholamine production. In addition, relaxation may facilitate the release of endorphins which bind to opioid receptor sites in the central nervous system and block the transmission of painful impulses.
Alternative and Complementary Medicine, American Health Oncology Consultants (1999) published an article on guided imagery as supportive therapy in cancer treatment. The review results showed that psychological problems and deterioration of quality of life caused by pain, severe nausea, stress are just a few of the hurdles faced by those fighting this disease. Guided imagery, a cognitive intervention has been implemented with increasing frequency as a therapeutic option for many encountering these difficulties.
Imagery involves mental exercises designed to allow the mind to influence the health and well-being of the body. The patient imagines sights, sounds, smells, tastes or other sensations to create a kind of purposeful day dream. It is used with standard medical treatment in people with cancer and other diseases.
According to Cathy Wong, (2012) for people coping with cancer, guided
imagery may help alleviate a number of emotional and physical problems. A technique that involves using visualization to achieve deep relaxation guided
imagery has been found to improve quality of life, reduce pain, ease stress and offer several other health benefits to cancer patients.
John Russo. D (2006) conducted a study on effectiveness of guided imagery as complement pain therapy among 44 patients with chronic pain. The study concluded that guided imagery was an effective supplement to medication therapy.
Battling cancer is one of the complex journey facing by the people throughout their normal life. There is growing recognition that cancer patients benefit from various types of support as they go through their journeys, ranging from informational to decision-making, physical, nutritional, psychological, social, and spiritual support. Guided imagery encourages patients to access their own strengths and resources and tends to lead toward greater autonomy and self efficacy.
Guided imagery in its various forms is becoming quickly and widely accepted as a useful technique in the treatment of people with cancer largely due to its ease of use, low cost and rapid psychological benefits. Because of this reasons the investigator selected guided imagery to reduce pain and improving the quality of life among patients with cancer.
Need for the Study
According to the National Cancer Institute (2013) cancer is the second leading cause of mortality in the United States, accounting for nearly 1 in every 4 deaths and it estimates that 1,660,290 new patients diagnosed with cancer and about 580,350 Americans are expected to die from cancer of all sites in 2013.
12.7 million cancer cases around the world in 2008. The number is expected to rise to 21 million by 2030.
According to Cancer Research UK (2010) more than 324,500 people were diagnosed with cancer in the UK in 2010.
According to National Cancer Institute (2008) over all cancer incidence was 470.1 and death rate was 192.1.
According to World Health Organisation (2013) approximately 47% of cancer cases and 55% of cancer deaths occur in less developed regions of the world. By 2030, if current trends continue, cancer cases will increase by 81% in developing countries. Approximately 50% of cancer in developing countries occurs in individuals less than 65 years of age. This is a tragedy for families and for populations, and has the potential to have a long-term impact on economic development.
According to the Cancer Information Network (2006) between 30% and 50% of cancer patients experience pain and approximately 70% experience severe pain at some point during the course of their disease.
According to Department of Cancer, G.Kuppuswamy Naidu Memorial Hospital in Coimbatore, Tamilnadu, South India, (2011) incidence rate of cancer was nearly 10 lakh cases in 2010.
Walker LG, et al (1999) conducted a comparative study on effectiveness of guided imagery and relaxation on quality of life among 96 breast cancer patients. The study revealed that those who used guided imagery and relaxation were more relaxed during chemotherapy and had a better quality of life. The study concluded that relaxation and guided imagery were “simple, inexpensive and beneficial” for patients
undergoing chemotherapy.
Cathy Wong, (2012) conducted a randomised experimental study on guided imagery for 30 minutes in reducing cancer pain among 126 cancer patients in Taiwan. The study revealed that the experimental group had more pain relief than the control group. It was concluded that guided imagery is effective in pain reduction.
Cathy Wong, (2012) conducted a experimental study to evaluate the effectiveness of guided imagery on pain among 62 hospitalized cancer patients. The study revealed that experimental group had reduced pain intensity. The study concluded that guided imagery was effective in reduction of pain.
So the investigator needs to provide one of the non pharmacological and complementary management (Guided Imagery) to the patients with cancer. It is a simple technique which helps to reduce the level of pain and improve quality of life among patients with cancer.
Statement of the Problem
A Study to Evaluate the Effectiveness of Guided Imagery on Pain and Quality of life Among Patients with Cancer in a Selected Hospital at Coimbatore.
Objectives
To assess the level of pain among patients with cancer. To assess the quality of life among patients with cancer.
To determine the effectiveness of guided imagery on pain and quality of
life among patients with cancer.
To determine the relationship between level of pain and quality of life
among patients with cancer.
To determine the association between level of pain among patients with
cancer and selected demographic variables.
To determine the association between quality of life among patients with
cancer and selected demographic variables.
Hypothesis
H2: There will be significant difference between mean pre and post test quality of life among patients with cancer.
H3: There will be significant relationship between level of pain and quality of life among patients with cancer.
H4: There will be significant association between level of pain among patients with cancer and their selected demographic variables.
H5: There will be significant association between quality of life among patients with cancer and their selected demographic variables.
Operational Definitions
Effectiveness
It means successful in producing the result of an action.
It refers to the outcome of guided imagery in terms of reduction in level of pain and improvement in quality of life among patients with cancer.
Guided Imagery
Merriam - Webser‟s dictionary defines guided imagery as: “any of various techniques (as a series of verbal suggestions) used to guide another person or oneself in imagining sensations and especially in visualizing as image in the mind to bring about a designed physical response (as a reduction in pain, anxiety or stress).”
Pain
Pain is an unpleasant sensory and emotional experience associated with actual or potential tissue damage.
In this study, it refers to unpleasant sensory and emotional feeling experienced by the patients with cancer and its treatments. Pain is measured by using Standardised Verbal Descriptor Pain Assessment Scale.
Quality of Life
The World Health Organization defines Quality of life as “an individual‟s perception of their position in life in the context of the culture and value systems in which they live and in relation to their goals, expectations, standards and concerns. It is a broad ranging concept affected in a complex way by the person‟s physical health, psychological state, personal beliefs, social relationships and their relationship to salient features of their environment”.
In this study, it refers to the self perception of patients with cancer regarding physical, emotional, social and financial dimension. It is measured by using modified European Organisation for Research and Treatment of Cancer Quality of Life Questionnaire Core-30 (EORTC QLQ-C30) scale.
Patients with Cancer
Delimitations
The study was delimited to patients admitted in selected hospital. Data collection was delimited to a period of 6 weeks.
Assumptions
Most of the patients with cancer clients are unfamiliar about the use of
guided imagery.
Guided imagery is useful in reducing the physical, emotional problems
associated with cancer.
Guided imagery is effective in reduction of pain and promoting quality of
life among patients with cancer.
Guided imagery has no side effects on patients with cancer.
Guided imagery is a simple and cost effective measure to reduce pain and
improve quality of life.
Projected Outcomes
The study findings will help the nurses to assess the level of pain and
quality of life by using Standardised Verbal Descriptor Pain Assessment scale and modified EORTC QLQ – C30 scale.
This study findings will identify the benefits of practicing guided imagery
among patients with cancer.
The study findings will help the patients to motivate the practicing of
CHAPTER II
REVIEW OF LITERATURE
Review of literature is a backbone of any research project. According to Polit and Hungler (2004), literature review is a critical summary of research on a topic of interest, often prepared to put a research problem in context.
According to Basavanthappa BT, review of literature is defined as “a broad, comprehensive, in depth, systematic and critical review of scholarly publications, unpublished scholarly print materials, audio-visual materials and personal communications”.
For the study, the literature reviews are divided into following, Studies related to pain and quality of life in cancer. Studies related to guided imagery.
Studies related to effectiveness of guided imagery on pain.
Studies related to effectiveness of guided imagery on quality of life.
Studies related to Pain and Quality of Life Among Patients With Cancer
Yamagishi A, Morita T, Miyashita M, Lgarashi A, Akiyama M, Akizuki N, Shirahige Y, Eguchi K, (2012) conducted a multicenter survey on pain intensity, quality of life, quality of palliative care and satisfaction in Japan among 1493 outpatients with recurrent cancer by adapting survey method by using brief pain inventory, good death inventory, care evaluation scale and a six point satisfaction scale. The study revealed that approximately 20% of patients reported moderate to severe pain, 20% reported that improvement is necessary in physical care, 13% reported some levels of dissatisfaction. The study concluded that a considerable number of outpatients with metastatic or recurrent cancer experienced severe pain and improvement in palliative care.
Heydarnejad MS, Dehkordi A Hassanpour and Dehkordi K Solati, (2011) conducted a cross sectional study on factors affecting quality of life among 200 cancer patients undergoing chemotherapy in Africa by using EORTC QLQ -C30 questionnaire. The study revealed that a significant relationship between the cancer type, pain intensity and fatigue was found when patients with less than or equal to 2 chemotherapy cycles and/or with 3-5 cycles. The study concluded that patients treated with more than 3-5 cycles of chemotherapy had poor quality of life.
of life in all dimensions like physical health, psychological health, social relationship, environmental health and other socio demographic variables.
Nordgren M, Hammerlid E, Bjordal K, Ahlner-Elmqvist M, Abendstein H, Boysen M, Jannert M , (2008) conducted a prospective longitudinal multicenter study on quality of life among 122 patients with oral carcinoma in Sweden by adapting EORTC QLQ-C30, EORTC QLQ-H&N35 scale. The study revealed that health related quality of life has changed based on the year of diagnosis and long-term side effects of the treatment. The study concluded that quality of life was poor after 5 years of oral carcinoma.
Lidgren M, Wilking N, Jonsson B, Rehnberg C, (2007) conducted a study on health related quality of life among 361 breast cancer patients in Sweden by adapting ED-5D self classifier and a direct Time Trade off (TTO) questionnaires. The study revealed that quality of life score was poor in the metastatic stage of breast cancer. The study concluded that patients with metastatic disease have lowest health related quality of life.
are having poor quality of life due to long-term side effects such as dry mouth, problems with teeth and thick secretions.
Arndt V, Merx H, Stegmaier C, Ziegler H, Brenner H, (2005) conducted population based study on quality of life among 439 patients with colorectal cancer in Germany by adapting EORTC QLQ – C30 scale. The study revealed that colorectal cancer patients had a lower quality of life in their physiological, cognitive and global health functioning. The study concluded that quality of life was poor among patients with colorectal cancer.
Cengiz M, Ozyar E, Esassolak M, Altun M, Akmansu M, Sen M, Uzel O, Yavuz A, et al, (2005) conducted a study on assessment of quality of life among 187 nasopharyngeal carcinoma patients in Turkey by using EORTC QLQ - C30 questionnaire and H&N-35 module. The study revealed that concomitant chemotherapy adversely affected the quality of life of the patients compared to adjuvant chemotherapy. The study concluded that nasopharyngeal carcinoma patients had poor quality of life during their treatment.
Tschudi H, Stoeckli S, Schmid S, (2003) conducted a retrospective chart review on quality of life after different treatment modalities for carcinoma of the oropharynx among 99 patients in Switzerland by using EORTC C30 and QLQ-H&N35 questionnaires. The study revealed that there is no significant changes in quality of life score. The study concluded that quality of life was poor after different treatment modalities.
Nordgren M, Abendstein H, Jannert M, Boysen M, Ahlner-Elmqvist M, Bjordal K, Hammerlid E, (2003) conducted a prospective longitudinal multicenter study on health related quality of among 86 laryngeal carcinoma patients in Sweden by adapting standardized health related quality of life questionnaires : EORTC QLQ-C30, EORTC QLQ-H&N35, Hospital Anxiety and Depression Scale (HADS). The study revealed that some significant changes in health related quality of life were found between prior diagnosis and 5 years after diagnosis. The study concluded that the quality of life has changed based on the year of diagnosis and duration of treatment.
Studies related to Guided Imagery
Lai WS, Chao CS, Yang WP, Chen CH, (2010) conducted a pilot study on efficacy of guided imagery with theta music among 53 advanced cancer patients with dyspnea in Taiwan by adapting one group pre test post test research design by using modified Borg Scale (MBS). The study revealed that 90% of the subjects gave positive qualitative results of guided imagery with music. The study concluded that guided imagery with music is an useful intervention for palliative care of patients with dyspnea. Guided imagery with music was more effective than music alone.
Lengacher CA, Bennett MP, Gonzalez L, Gilvary D, Cox CE, Cantor A, Jacobsen PB, Yang C, et al, (2008) conducted a pilot study on immune responses to guided imagery during breast cancer treatment among 28 patients in USA by using pre-test , post-test experimental design. The study revealed that guided imagery could have an effect on natural killer cell cytotoxicity after activation with 1L – 2 in patients undergoing surgery for breast cancer. The study concluded that guided imagery was more effective in improving immune response.
Kolcaba K, Fox C, (1999) conducted an experimental longitudinal randomized study on the effect of guided imagery on comfort of women with early stage breast cancer undergoing radiation therapy among 53 patients in USA by using radiation therapy comfort questionnaire. The study revealed a significant differences between experimental and control groups. The study concluded that guided imagery is an effective intervention for enhancing comfort of women undergoing radiation therapy for early stage breast cancer.
Studies related to Effectiveness of Guided Imagery on Pain
Vasantha G, Almeida Victoria D, Kanagaraj R, (2013) conducted a one group pre-test post-test pre experimental study on effectiveness of guided imagery on intensity of pain and quality of life among 30 patients with cancer in South India by using visual analogue scale and (modified) FACT-G quality of life scale. The study revealed that the mean post intervention intensity of pain and quality of life score was lower than mean pre-intervention intensity of pain and quality of life score. The study concluded that guided imagery is an effective strategy in reducing the intensity of pain and improving the quality of life of cancer patients.
relieve their pain. The study concluded that a majority of patients perceived the guided imagery is relieving pain than the progressive muscle relaxation intervention.
Kwekkeboom KL, Kneip J, Pearson L, (2003) conducted a pilot study to predict success with guided imagery on pain among 62 hospitalized cancer patients by adapting one group pre-test and post-test design by using 0 to 10 numeric pain rating scale. The study revealed that cancer patients experienced reduction of pain after intervention. The study concluded that guided imagery is an appropriate intervention for individual cancer patients.
Syrjala KL, Donaldson GW, Davis MW, Kippes ME, Carr JE, (1995) conducted a controlled clinical trial on relaxation, imagery and cognitive behavioural training on pain during cancer treatment among 94 cancer patients in USA by using visual analogue scale. The study concluded that relaxation and guided imagery training reduces cancer treatment- related pain.
Studies related to Effectiveness of Guided Imagery on Quality of Life
Leon – Pizaro C, et. al, (2007) conducted a randomized trial on effect of training in relaxation and guided imagery techniques in improving psychological and quality of life indices among 66 gynaecologic and breast brachytherapy patients in Spain by using Hospital Anxiety and Depression Scale (HADS) and Cuestionario de Calidad de Vida QL- CA-AFex (CCV) scale. The study revealed that the study group demonstrated a statistically significant reduction in anxiety, depression and body discomfort compared with the control group. The study concluded that relaxation techniques and guided imagery improved the quality of life and psychological well being of patients with cancer.
CONCEPTUAL FRAMEWORK
GENERAL SYSTEM THEORY LUDWIG VON BERTANLAFFY (1968)
Conceptual framework act as building block for the research study. Conceptual framework play several interrelated roles in the progress of a science. The overall purpose is to make research findings meaningful and generalizable.
Tabot (1995) defines the conceptual framework as a “network of interrelated changes that provide a structure for organizing and describing the phenomenon of intersect”. Research studies are based on theoretical or conceptual framework that facilitates visualizing the problem and placing the variables in the logical manner.
The present study aims to evaluate the effectiveness of guided imagery on pain and quality of life among patients with cancer. The conceptual framework for this study is based on modified Ludwig Von Bertanlaffy‟s Open System Theory (1968). System theory is being used increasingly by nurses as a way of understanding not only the biological systems but also systems in families, communities, nursing and health care.
There are two types of systems A closed system
A closed system does not exchange energy, matter or information with its environment; it receives no output from the environment and gives no output to the environment.
A open system
Energy, matter and information move into and out of the system through the system boundary. All living systems such as plants, animals, people, families and communities are open system, since their survival depends on a continuous exchange of energy. They are therefore, in a constant state of change. For its functioning an open system depends on the quality and quantity of its input, output and feedback.
In the present study, the concepts can be interpreted as follows
Open System:
In this present study individual is considered as open system.
Input:
The system uses the input through self regulation to maintain the system‟s equilibrium or homeostasis. Input consists of information, material or energy that enter the system.
Throughput:
Input is processed in a way useful to the system. This process of transformation is called throughput.
In this study, the investigator, administer guided imagery for 20 minutes for twice a day of 5 consecutive days with routine nursing care.
Output:
The system returns the output following the process of input.
Output is reduction in level of pain and improvement in quality of life which is reassess by using Standardised Verbal Descriptor Pain Assessment scale and modified EORTC QLQ – C30 scale.
Feedback:
Fig -1: Conceptual Framework Based On Modified Ludwig Von
Bertanlaffy‟s Open System Theory (1968)
25 Demographic variables
Age
Gender
Educational status
Occupation
Income
Marital status
Duration of Illness
Stage of Cancer
Duration of Treatment
Modality of Cancer
Treatment
Routine
Care
Pre Test -Assessment onLevel of Pain and Quality of Life by using Verbal Descriptor Pain Assessment Scale and EORTC QLQ-C30
Input
Throughput
Output
Intervention on guided imagery for 20 minutes,
2 times a day for 5
consecutive days and routine care
Post Test
Assessment on Level of Pain and Quality
of Life by using Verbal Descriptor
Pain Assessment Scale and EORTC
QLQ-C30 Experimental group Control group No reduction in Level of Pain and Improving Quality of Life Reduction in Level of Pain and Improving Quality of Life
CHAPTER III
METHODOLOGY
According to Basavanthappa B.T (2004) “research methodology is a way to systematically solve the research problem”
According to Denise F. Polit (2011) methodology is defined as “the steps, procedures and strategies for gathering and analyzing data”.
The chapter deals with research approach, research design setting of the study, population, criteria for selection of sample, sample size, sampling technique, description of tool, scoring procedure, data analysis and protection of human rights.
Research Approach
Polit and Hungler (2004) defined the approach as, “a general set of orderly disciplined procedure used to acquire information”.
Research Design
According to Denise F. Polit (2011) research design is defined as, “the overall plan for addressing a research question, including specifications for enhancing the study‟s integrity”.
A quasi experimental non randomized control group design was chosen for this study to evaluate the effectiveness of Guided imagery on pain and quality of life among patients with cancer.
The diagrammatic representations of research design is as follows.
Group
Pre-test Intervention Post- test D5 D1 D2 D3 D4
Experimental O1 X X X X X O3
Control O2 - - - O4
Keys:
O1 : Pre- test assessment of pain and quality of life in experimental group. O2 : Pre- test assessment of pain and quality of life in control group. X : Guided imagery for 20 minutes, twice a day for 5 consecutive days. O3 : Post test assessment of pain and quality of life in experimental group. O4 : Post test assessment of pain and quality of life in control group. O3–O1
Fig. 1.Schematic Representation of Research Methodology
Quasi Experimental Non Randomized Control Group DesignResearch Design
Target Population Patients with Cancer
Accessible Population
Patients with Cancer in Ashwin Hospital at Coimbatore
Sampling Technique
Control Group- 30 Patients with cancer
Experimental Group- 30 Patients with Cancer
Non probability purposive sampling technique (60)
Pre-test assessment on pain and quality of life by using Verbal Descriptor Pain Assessment Scale and Modified EORTC QLQ_C30 Scale
Data Analysis (Descriptive and inferential statistics)
Criterion Measures (Level of pain and quality of life)
Guided Imagery for 20min, twice a day for 5 consecutive days and
Routine Care
Routine care only
Variables
According to Denise F. Polit (2011) variable is defined as, “an attribute that varies, that is takes on different values”.
Dependent Variables
According to Denise F. Polit (2011) dependant variable is defined as, “the variable hypothesized to depend on or be caused by another variable of interest”. In
this study the dependent variables are pain and quality of life among patients with cancer.
Independent Variable
According to Denise F. Polit (2011) independent variable is defined as, “the variable that is believed to cause or inference the dependent variable”.
In this study the independent variable is guided imagery.
Setting of the Study
The study was conducted in Ashwin Hospital at Coimbatore. This hospital has 100 beds with separate male and female ward, special ward, general ward, intensive care unit, operation theatre, post operative ward, chemotherapy and radiation therapy unit, laboratory and pharmacy department.
Population
According the Denise F. Polit (2011) population is defined as, “the entire set of individuals or objects having some common characteristics”.
The target population is determined by the sampling criteria. An accessible population is the portion of the target population to which the researcher has reasonable access. The target population for this study was patients with cancer.
The accessible population for this study includes patients with cancer admitted in Ashwin hospital at Coimbatore.
Sample
According to Denise F. Polit (2011) sample is defined as, “a subset of a population comprising those selected to participate in a study”.
The samples were selected patients with cancer from Ashwin Hospital at Coimbatore.
Sample Size
According to Denise F. Polit (2011) sample size is defined as, ”the number of people who participate in a study”.
Criteria for Sample Selection
Inclusion Criteria
Patients who are diagnosed with cancer 1. Patients at any stage of cancer
2. Those who are able to understand Tamil
3. Those who are willing to participate in the study 4. Those with mild and moderate level of pain
Exclusion Criteria
1. Critically ill patients.
2. Unconscious and terminally ill patients. 3. Mentally ill patients.
4. Those who have brain tumor and underwent surgery in the brain or skull. 5. Those who have neurological and sensory deficit.
Sampling Technique
According to Suresh K Sharma (2007) sampling technique is defined as, “the process of selecting a representative segment of the population under study.
Development of the Tool
Treece and Treece (1986) emphasized that “the instrument selected in research should as far as possible be the vehicle that would best obtain data for drawing conclusion”.
The research tool was developed in English after an extensive review of literature and experts opinion. It was translated into Tamil by language experts. The Standardised Verbal Descriptor Pain Assessment scale and modified EORTC QLQ – C30 scale was used as the instrument to measure the level of pain and quality of life.
Description of the Tool
The Standardised Verbal Descriptor Pain Assessment scale and modified EORTC QLQ – C30 scale and used to assess the pain and quality of life respectively.
The tool consists of three parts.
Part I:
It includes demographic variables of patients with cancer (age, gender, educational status, occupation, monthly income, marital status, duration of illness, stage of cancer, duration of treatment, modality of cancer treatment).
Part II:
It consists of Standardised Verbal Descriptor Pain Assessment Scale to evaluate the pain.
Part III
This includes modified EORTC QLQ – C30 scale to evaluate the quality of life.
The modified EORTC QLQ- C30 scale consist of 28 statements in 4 point likert scale to measure for dimensions of subjective quality of life. The dimensions include physical 20 items (# 1- 20); emotional 5 items (#21-25); social 2 items (#26-27);financial 1 item (#28) to calculate the four subscale/ dimensions and the quality of life.
The minimum possible score for each statement is „1‟ and the maximum possible score for each statement is „4‟.
Scoring Procedures
Part II:
Regarding Standardized Verbal Descriptor Pain Assessment Scale, it consists of 0-7 score that measure level of pain and ranges from no pain to moderate pain.
The scores are classified as, 0 - No Pain 1-2 - Mild Pain 3-7 - Moderate Pain
Part III:
The scores are as follows,
28-49 ---- Good quality of life 50-91 ---- Moderate quality of life 92-112 ---- Poor quality of life
Guided Imagery
Guided imagery is the relaxation technique, by using audio and video script regarding forest scenes for 20 minutes, twice a day for 5 consecutive days.
Content Validity
According to Suresh K Sharma (2007) validity is defined as, “extent to which an instrument accurately reflects the abstract construct (or) concept being examined”.
To ensure the study, the content validity tool was obtained from one medical expert from oncology department and one from a Psychologist and five experts from Medical Surgical Nursing department. Based on the expert opinion the tool and demographic variables are modified.
Reliability
According to Denise F. Polit (2011) reliability is defined as, “the degree of consistency or dependability with which an instrument measures an attribute”.
Pilot Study
According to Denise F. Polit (2011) pilot study is defined as, “a small-scale version or trial run, done in preparation of a major study”.
In order to check the feasibility and practicability, pilot study was conducted among 10 patients with cancer in Guru Hospital, advanced cancer care at Madurai after obtaining the written permission. The pilot study revealed that it was feasible and practicable to conduct the main study
Data Collection Procedure
The data collection procedure was done for a period of 6 weeks in oncology wards of Ashwin Hospital at Coimbatore. Permission to conduct the study was obtained from the Dean, Head of the Department and consultant Oncologist, unit in- charge of oncology ward. The study subjects were informed by the investigator regarding nature and purpose of the study. Informed written consent was obtained from the subjects as per rule on the 1st day. On the same day pre-test was conducted through structured interview technique by using Standardised Verbal Descriptor Pain scale to assess the level of pain and modified EORTC QLQ- C30 scale to assess the quality of life among patients with cancer in both experimental and control group.
Plan for Data Analysis
The demographic variables were analyzed by using descriptive statistics (frequency and percentage).The level of pain and quality of life was analyzed by using descriptive statistics (Mean, standard deviation).The effectiveness of guided imagery on pain and quality of life was analyzed by using inferential statistics (dependent „t‟ test and independent „t‟ test). Relationship between the level of pain and quality of life was analyzed by using Karl Pearson‟s correlation co efficient (r). Association between the level of pain and quality of life among patients with cancer and their selected demographic variables was assessed by using chi- square analysis.
Protection of Human Rights
CHAPTER IV
DATA ANALYSIS AND INTERPRETATION
This chapter deals with analysis and interpretation of data collected from 60 patients with cancer in order to evaluate the effectiveness of guided imagery on quality of life and pain.
Denise F Polit (2011) defined analysis as, “the process of organizing and synthesizing data so as to answers research questions and test hypothesis”.
Denise F Polit (2011) defined data as, “the piece of information obtained in a study”.
The study findings are presented in sections as follows.
Section I : Data on demographic variables of patients with cancer. Section II : Data on level of pain among patients with cancer. Section III : Data on quality of life among patients with cancer. Section IV : Data on effectiveness of guided imagery on level of pain
among patients with cancer.
Section V : Data on effectiveness of guided imagery on quality of life among patients with cancer.
Section VI : Data on relationship between level of pain and quality of life among patients with cancer.
SECTION I :
DATA ON DEMOGRAPHIC VARIABLES OF
PATIENTS WITH CANCER.
Table: 1
Frequency and Percentage Distribution of Patients with Cancer According to their selected Demographic Variables in
Experimental and Control Group.
N=60
S.
No. Demographic Variables
Experimental Group
Control Group Total
n % n % N %
1
2
3
4
Age (in years) a) 20 -35 years b) 36-50 years c) 51-65 years
Gender a) Male b) Female
Educational status
a) No formal education b) Primary education c) Secondary education d) Higher education e) Graduate/Equivalent
Occupation
S.
No. Demographic Variables
Experimental Group
Control Group Total
n % n % N %
5. 6. 7. 8. 9. 10. Monthly Income
a) Rs. 5,000/- -Rs, 10,000/- b) Rs. 10,001/- -Rs. 15,000/- c) Above Rs.15,000/-
Marital status a) Married b) Unmarried
c) Divorced/separated d) Widow/ Widower Duration of Illness
a) < 1 year b) 1-3 years c) > 3 years Stage of Cancer
a) 1st stage b) 2nd stage c) 3rd stage d) 4th stage Duration of treatment
a) Less than 1 year b) 1- 3 years
c) More than 3 years Modality of Cancer treatment
a) Chemotherapy b) Radiation therapy c) Both
d) Surgery therapy
Table 1 reveals that regarding age, majority of the cancer patients 34 (51%), belonged to 51-65 years, out of them 19 (63%) belonged to experimental group and 15 (50%) belonged to control group respectively. 25 (42%) patients were included in the age group of 36-50 years among them 11 (37%) and 14 (47%) belonged to experimental and control group respectively, 1 (1%) belonged to the age group of 20-35 years among them 1 (3%) belonged to control group.
Regarding gender, majority 33 (55%) were females among them 18(60%) were included in experimental group and 15 (50%) were included in control group.
27(45%) were males among them 12(40%) belonged to experimental group and 15 (50%) belonged to control group.
Regarding educational status, 43 (72%) had no formal education, out of them 21 (70%) and 22 (73%) belonged to experimental and control group respectively. 16 (27%) had primary education out of them 8 (27%) and 8 (27%) belonged to experimental and control group respectively. 1 (1%) had secondary education among them 1 (3%) belonged to experimental group.
Regarding occupation, 58 (97%) were self employed out of them 29 (97%) belonged to experimental and 29 (97%) belonged to control group. 2 (3%) were private employee out of them 1 (3%) belonged to experimental and 1 (3%) belonged to control group.
and control group. 8 (13%) were included in the category of Rs. 10001/- – Rs.15000/- among them 5 (17%) and 3 (10%) belonged to experimental and control group respectively.
Regarding marital status, 48 (80%) were married among them 23 (77%) and 25 (83%) belonged to experimental and control group. 12 (20%) were widow / widower among them 7 (23%) and 5 (17%) belonged to experimental and control group.
Regarding duration of illness, 56 (93%) were involved in the category of < 1
year out of them all 28 (94%) belonged to experimental and control group. 3 (5%) were involved in the category of 1-3 years among them 1 (3%) and 2 (6%)
belonged to experimental and control group. 1 (2%) were involved in the category of > 3 years among them 1 (3%) belonged to experimental group.
Regarding stage of cancer, 6 (10%) were in 1st stage, out of them 5 (17%) and 1 (3%) belonged to experimental and control group. 42 (70%) were in 2nd stage, out
of them 17 (57%) and 25 (84%) belonged to experimental and control group. 11 (18%) were in 3rd stage, out of them 7 (23%) and 4 (13%) belonged to
experimental and control group. 1 (2%) were in 4th stage among them 1 (3%) belonged to experimental group.
Regarding modality of cancer treatment, 21 (35%) underwent chemotherapy out of them 8 (27%) and 13 (43%) belonged to experimental and control group. 21 (35%) underwent radiation therapy out of them 12 (40%) and 9 (30%) belonged to experimental and control group. 18 (30%) had both chemotherapy and radiation therapy out of them, 10 (33%) and 8 (27%) belonged to experimental and control group.
SECTION II : DATA ON LEVEL OF PAIN AMONG PATIENTS
[image:57.595.102.531.235.427.2]WITH CANCER.
Table: 2
Frequency and Percentage Distribution on Level of Pain among Patients with Cancer in Experimental and Control Group.
N=60
S. No. Level Of Pain
Experimental Group Control Group Pre Test Post Test Pre Test Post Test
n % n % n % n %
1. 2. 3. No Pain Mild Moderate 0 0 30 0 0 100 13 17 0 43 57 0 0 0 30 0 0 100 0 0 30 0 0 100
The above table 2 shows the level of pain in the experimental and control group among patients with cancer.
Table: 3
Frequency and Percentage Distribution on Quality of Life among Patients with Cancer in Experimental and Control Group.
N=60
S. No. Quality of Life
Experimental Group Control Group Pre Test Post Test Pre Test Post Test
n % n % n % n %
1. 2. 3. Good Moderate Poor 0 21 9 0 70 30 26 4 0 87 13 0 0 18 12 0 60 40 0 22 8 0 73 27
The above table 3 shows quality of life in the experimental and control group among patients with cancer.
Out of 30 subjects among experimental group, 21 (70%) of them had moderate quality of life, 9(30%) of them had poor quality of life in their pre-test assessment. Whereas in the post- test assessment 26 (87%) of them had good quality of life and 4(13%) of them had moderate quality of life.
SECTION IV : DATA ON EFFECTIVENESS OF GUIDED IMAGERY
ON LEVEL OF PAIN AMONG PATIENTS WITH
CANCER.
Table: 4.1
Mean, Standard Deviation, Mean Difference and „t‟ Value on Level of Pain among Patients with Cancer in Experimental and Control Group.
N=60 S.
No Group Mean SD MD „t‟ value
1 2
1 2
Experimental Group Pre test Post test
Control Group Pre test Post test 5 0.66 5.26 5.2 1.15 0.64 0.84 0.79 4.34 0.06 19.25* 0.34NS
[image:63.595.103.530.242.470.2]* - Significant at p < 0.05 level.
Table 4.1 reveals that among experimental group the mean pre-test score was 5 with standard deviation 1.15. The mean post- test was 0.66 with standard deviation 0.64. The mean difference was 4.34. The obtained „t‟ value was 19.25, whereas the table value was 2.045. It was significant at p<0.05 level.
Among control group the mean pre-test score was 5.26 with standard deviation with 0.84. The mean post-test was 5.2 with standard deviation with 0.79. The mean difference was 0.06. The obtained „t‟ value 0.34, was not significant.
Table : 4.2
Mean, Standard Deviation, Mean Difference and „t‟ Value on Quality of Life among Patients with Cancer in Experimental and Control Group.
N=60 S.
No Group Mean SD MD „t‟ value
1 2
1 2
Experimental Group Pre test Post test
Control Group Pre test Post test
90.56 42.8
89.7 89.1
3.3 6.1
4.02 3.93
47.76
0.54
4.11*
1.52NS
* - Significant at p < 0.05 level.
Table 4.2 shows that among experimental group the mean pre-test score was 90.56 with standard deviation 3.3. The mean post- test was 42.8 with standard deviation 6.1. The mean difference was 47.76. The obtained „t‟ value was 4.11, whereas the table value was 2.045. It was significant at p<0.05 level.
Among control group the mean pre-test score was 89.7 with standard deviation with 4.02. The mean post- test score was 89.1 with standard deviation 3.93. The mean difference was 0.54. The obtained „t‟ value 1.52 was not significant.
SECTION V:
DATA ON RELATIONSHIP BETWEEN LEVEL OF
PAIN AND QUALITY OF LIFE AMONG
[image:67.595.101.533.227.351.2]PATIENTS WITH CANCER.
Table: 5Mean, Standard Deviation and „r‟ Value on Post-test Score of level of Pain and Quality of Life among Patients with Cancer in Experimental Group.
N=30
S.
No. Groups
Pain Quality of
Life „r‟ Value Mean SD Mean SD
1 Experimental Group
Post-test 0.66 0.64 42.8 6.1 -0.37
Table 5 shows the relationship between level of pain and quality of life among patients with cancer in post-test. Among experimental group the mean post-test score of pain was 0.66 with standard deviation 0.64 and mean post-test score of quality of life was 42.8 with standard deviation 6.1. The obtained „r‟ value was -0.37 which is statistically significant.
SECTION VI
:
DATA ON ASSOCIATION BETWEEN
LEVEL OF PAIN AMONG
[image:68.595.101.533.262.712.2]PATIENTS WITH CANCER WITH THEIR
SELECTED DEMOGRAPHIC VARIABLES.
Table : 6 Frequency, Percentage and χ2
Distribution on Level of Pain among Patients with Cancer with their selected Demographic Variables in Experimental Group.
N=30
S.
No. Demographic Variable
Level of Pain
ᵡ
2 ValueNo Pain Mild
n % n %
1
2
3
4
Age in years a. 20-35 b. 36-50 c. 51-65 Gender a. Male b. Female Educational status
a. No formal education b. Primary education c. Secondary education
Occupation
a. Self employed b. Private employee
0 5 8 2 11 11 2 0 13 0 0 16 27 7 37 37 7 0 43 0 0 6 11 10 7 10 6 1 16 1 0 20 37 33 23 33 20 3 54 3 0.01NS df=4
5.77 NS df=2
2.51 NS df=8
0.76 NS df=4
S.
No. Demographic Variable
Level of Pain
ᵡ
2 ValueNo Pain Mild n % n %
5 6 7 8 9 10 Monthly income
a. Rs.5000 /–Rs.10000/- b. Rs.10001/-Rs.15000/- Marital status
a. Married
b. Widow / widower Duration of illness
a. < 1 year b. 1-3 years c. > 3 years Stage of cancer
a. 1st stage b. 2nd stage c. 3rd stage d. 4th stage Duration of treatment
a. Less than 1 year
Modality of cancer treatment a. Chemotherapy b. Radiation therapy c. Both 13 0 11 2 12 0 1 1 8 3 1 13 4 5 4 43 0 37 7 40 0 3 3 26 10 3 43 14 16 14 12 5 12 5 16 1 0 4 9 4 0 17 4 7 6 40 17 40 16 54 3 0 14 30 14 0 57 14 22 20
4.56 NS df=4
0.79 NS df=4
2.03 NS df=4
2.48 NS df=4
0 NS df=4
0.17 NS df=6
[image:69.595.104.530.57.653.2]SECTION VII :
DATA ON ASSOCIATION BETWEEN QUALITY
OF LIFE AMONG PATIENTS WITH CANCER
WITH THEIR SELECTED DEMOGRAPHIC
VARIABLES.
Table : 7.1 Frequency, Percentage and χ2
Distribution on Quality of Life among Patients with Cancer with their Selected Demographic Variables in Experimental Group.
N=30
S.
No. Demographic Variable
Quality of Life
ᵡ
2 ValueGood Moderate
n % n %
1
2
3
4
Age in years a. 20-35 b. 36-50 c. 51-65 Gender a. Male b. Female Educational Status
a. No formal education b. Primary education c. Secondary education
Occupation
a. Self employed b. Private employee
0 8 18 12 14 19 6 1 25 1 0 27 60 40 46 63 20 3 83 3 0 3 1 0 4 2 2 0 4 0 0 10 3 0 14 7 7 0 14 0
2.92 NS df=4
3.06 NS df=2
8.04 NS df=8
0.08 NS df=6
S.
No. Demographic Variable
Quality of Life
ᵡ
2 ValueGood Moderate
n % n %
5 6 7 8 9 10 Monthly income
a. Rs.5000/- – Rs.10000/- b. Rs.10001/--Rs.15000/-
Marital status a. Married
b. Widow / widower
Duration of illness a. < 1 year b. 1-3 years c. > 3 years
Stage of cancer a. 1st stage b. 2nd stage c. 3rd stage d. 4th stage
Duration of treatment a. Less than 1 year
Modality of cancer treatment a. Chemotherapy b. Radiation therapy c. Both 21 5 20 6 24 1 1 5 14 6 1 26 6 10 10 70 16 67 20 80 3 3 16 47 20 3 86 20 33 33 4 0 3 1 4 0 0 0 3 1 0 4 2 2 0 14 0 10 3 14 0 0 0 10 3 0 14 7 7 0
0.8 NS df=4
0 NS df=6
0.17 NS df=4
1.09 NS df=6
0 NS df=4
2.57 NS df=6
Table: 7.2 Frequency, Percentage and χ2
Distribution on quality of life among Patients with Cancer with their selected Demographic Variables in Control Group.
N=30
S.
No. Demographic Variable
Quality of Life
ᵡ
2 ValueModerate Poor n % n %
1
2
3
4
5
Age in years a. 20-35 b. 36-50 c. 51-65 Gender a. Male b. Female Educational Status
a. No formal education b. Primary education
Occupation
a. Self employee b. Private employee
Monthly income
a. Rs.5000/- – Rs.10000/- b. Rs.10001/- -Rs.15000/-
1 11 10 10 12 17 5 22 0 21 1 3 37 33 33 40 57 17 74 0 70 3 0 3 5 5 3 5 3 7 1 6 2 0 10 17 17 10 17 10 23 3 20 7
0.85 NS df=4
0.68 NS df=2
0.32 NS df=8
2.87 NS df=6
2.72 NS df=4
S.
No. Demographic Variable
Quality of Life
ᵡ
2 ValueModerate Poor
n % n %
6 7 8 9 10 Marital status a. Married
b. Widow / widower
Duration of illness a. < 1 year b. 1-3 years
Stage of cancer a. 1st stage b. 2nd stage c. 3rd stage
Duration of treatment a. Less than 1 year
Modality of cancer treatment a. Chemotherapy b. Radiation therapy c. Both 19 3 20 2 15 6 1 22 11 7 4 63 10 67 7 50 20 3 73 37 23 14 6 2 8 0 1 4 3 8 2 2 4 20 7 27 0 3 14 10 27 6 6 14
0.52 NS df=6
0.75 NS df=4
9.11 NS df=6
0 NS df=4
[image:73.595.100.547.69.602.2]CHAPTER V
DISCUSSION
The main aim of this study was to evaluate the effectiveness of guided imagery on pain and quality of life among patients with cancer at Coimbatore.
The study was conducted by using a quasi experimental non randomised control group design. Samples were selected from the unit of oncology ward in Ashwin hospital for conducting the study. The samples size was 60, among them 30 were in experimental group and 30 were in control group.
The structured interview questionnai