WITH METABOLIC SYNDROME
Dissertation submitted to
THE TAMILNADU Dr. M.G.R MEDICAL UNIVERSITY
CHENNAI
In partial fulfilment of regulations
For award of the degree of
M.D (GENERAL MEDICINE) BRANCH – I
KILPAUK MEDICAL COLLEGE
CHENNAI 600 010
―This is to certify that dissertation entitled ―A STUDY OF THROID
DYSFUNCTION IN PATIENTS WITH METABOLIC SYNDROME”
is a bonafide work performed by Dr. S.KARTHIKEYAN, post graduate student, Department of Internal Medicine, Kilpauk Medical College,
Chennai-10, under my guidance and supervision in fulfilment of regulations
of the Tamil Nadu Dr. M.G.R Medical University for the award of M.D.
Degree Branch I (General Medicine) during the academic period from 2013
to 2016.‖
PROF. DR.S.USHA LAKSHMI, M.D., FMMC.,
PROFESSOR AND HEAD OF DEPARTMENT DEPARTMENT OF MEDICINE GOVT. KILPAUK MEDICAL COLLEGE
CHENNAI - 10
PROF. DR.R.NARAYANABABU.M.D., DCH
THE DEAN
KILPAUK MEDICAL COLLEGE CHENNAI -10
PROF. DR.C.HARIHARAN, M.D GUIDE FOR THE STUDY
CHIEF UNIT – IV DEPARMENT OF MEDICINE GOVT. KILPAUK MEDICAL COLLEGE
DECLARATION
` ―I declare that the dissertation entitled “A STUDY THYROID
DYSFUNCTION IN PATIENTS WITH METABOLIC SYNDROME” is
done by Dr.S.Karthikeyan at Kilpauk Medical College, Chennai from March
2015 to August 2015 under the my guidance and supervision to be submitted
to The Tamilnadu Dr M.G.R Medical University towards the partial
fulfilment of requirements for the award of M.D DEGREE IN GENERAL
MEDICINE BRANCH-I.‖
Place: Chennai
Place: Chennai PROF.DR.C.HARIHARAN,M.D
Date GUIDE FOR THE STUDY
CHIEF UNIT – IV
DEPARMENT OF MEDICINE GOVT. KILPAUK MEDICAL COLLEGE
DECLARATION
` ―I solemnly declare that the dissertation entitled “A STUDY
THYROID DYSFUNCTION IN PATIENTS WITH METABOLIC
SYNDROME” is done by me at Kilpauk Medical College, Chennai from
March 2015 to August 2015 under the guidance and supervision of Prof.
Dr.C.HARIHARAN, M.D., to be submitted to The Tamilnadu Dr M.G.R
Medical University towards the partial fulfilment of requirements for the
award of M.D DEGREE IN GENERAL MEDICINE BRANCH-I.‖
Place: Chennai
―At the outset, I would like to thank my beloved Dean, Kilpauk
Medical College Prof. Dr.R.NARAYANA BABU .M.D., DCH. for his kind permission to conduct the study in Kilpauk Medical College for having permitted me to conduct the study and use the hospital resources in the study.
I would like to thank to Professor and Head, Department of General medicine Prof. Dr.S.USHALAKSHMI., M.D., FMMC, Kilpauk medical college for permitting me to conduct this study.
I express my heartfelt gratitude to my unit chief Prof. Dr.C.HARIHARAN, M.D., for his inspiration, advice and guidance in making this work complete.
I am ever grateful to Dr.Venkatesvarloo M.D.,Dch, Registrar for his constant support and guidance.
I am extremely thankful to Assistant Professors of Medicine Dr.SRIDHARAN.P, M.D., and Dr.MALARVIZHI.P, M.D., for guiding me.
I would like express my gratitude to the co-operation and constructive criticism shown by my fellow post graduates. Finally, thank all my patients for their active co-operation in this study, without which this would not have
S.NO. TITLE
PAGE
NO.
1
INTRODUCTION
1
2
AIMS AND OBJECTIVES
7
3
REVIEW OF LITERATURE
12
4
MATERIALS AND METHODS
32
5
RESULTS AND OBSERVATIONS
38
6
DISCUSSION
70
7
CONCLUSIONS
74
8
SUMMARY
76
9
BIBLIOGRAPHY
79
10
LIST OF TABLES
85
11
LIST OF FIGURES
87
12
PROFORMA
88
13
INSTITUTE ETHICAL COMMITTEE
90
MS
-
Metabolic Syndrome
WC
-
Waist Circumference
SBP
-
Systolic Blood Pressure
DBP
-
Diastolic Blood Pressure
FBS
-
Fasting Blood Sugar
TC
-
Total Cholesterol
HDL-C
-
High Density Lipoprotein Cholesterol
TGL
-
Triglycerides
LDL-C
-
Low Density Lipoprotein Cholesterol
FT4
-
Free Thyroxine
TSH
-
Thyroid Stimulating Hormone
INRODUCTION
Metabolic syndrome and hypothyroid are both individually risk factors for
coronary heart disease. Relation between them is not established so far
conclusively.
AIM OF THE STUDY
To study the prevalence and to find the types of thyroid dysfunction in
Metabolic Syndrome and to find the association of Thyroid Dysfunction and
Metabolic Syndrome.
MATERIALS AND METHODS
A total of 60 Patients with metabolic syndrome fulfilling IDF criteria were
selected the study. Detailed history of medication, and anthropometric
measurements were noted in a semi-structured proforma. Blood pressure was
recorded in right upper limb in sitting posture. After eight hours of fasting, blood
drawn for fasting blood sugar, lipid profile and thyroid assay in a single sitting.
In this study, thyroid dysfunction prevalence is 18.33% among metabolic
syndrome patients. Subclinical Hypothyroidism is 15% prevalent in metabolic
syndrome patients and Overt Hypothyroidism is 3.3% prevalent. There is no
incidence of either overt or subclinical Hyperthyroidism in our study population.
The prevalence of thyroid dysfunction and hypothyroidism in metabolic syndrome
patients are higher than the prevalence in normal population, which is 5.9% for
thyroid dysfunction and 4.6% for hypothyroidism (0.3% overt and 4.3% sub
clinical hypothyroidism). Incidence of metabolic syndrome in significantly higher
in women (25.8) then in men (8%) with metabolic syndrome
CONCLUSION
Thyroid dysfunction occurs in 18.33% of metabolic syndrome patients.
Prevalence of Subclinical hypothyroidism (15.0%) and Overt Hypothyroidism
(3.33%) in metabolic syndrome patients which is higher than that of general
population. One sixth of metabolic syndrome patients or every sixth metabolic
syndrome had Subclinical Hypothyroidism. Prevalence of thyroid dysfunction is
much more common in Females with thyroid dysfunction than male. Exclude the
INTRODUCTION
Each year mortality due to coronary artery disease and
cerebrovascular disease are on the rise. Though there are multiple risk
factors leading to these terminal illnesses, few of these risk factors appear in
groups. Characteristic of this group is presence of central obesity and insulin
resistance; they also have high blood pressure, high triglyceride levels and
abnormal fasting blood sugar levels.
These groups of risk factors are known as Metabolic Syndrome. There
is high risk of developing cerebrovascular disease and cardiovascular events
in people who have metabolic syndrome. With the changing lifestyle and
food habits, there is a raise in incidence of obesity and Metabolic Syndrome.
Thyroid disease is associated with atherosclerotic cardiovascular
disease. This association may be in part be explained by thyroid hormone’s
regulation of lipid metabolism and its effect on blood pressure.
Thyroid hormones have ubiquitous effects and influence the function of
most organs. This hormone appears to serve as a general pacemaker
accelerating metabolic process and may be associated with metabolic
syndrome.(9)
Both Metabolic syndrome and thyroid dysfunction are associated with
increased risk of atherosclerotic heart disease. Little is known about the
few small studies have been performed.(10,11) In a cross sectional study in
220 metabolic syndrome patients, it was found that subclinical
hypothyroidism was prevalent in 16.4% of metabolic syndrome patients.(10)
In another study, it was found that metabolic syndrome was prevalent in
thyroid dysfunction patients.(11) There is no information available in
literature regarding this association in this part of the country. Therefore, the
association of thyroid dysfunction with metabolic syndrome was evaluated
AIMS AND OBJECTIVES
1. To study the prevalence of thyroid dysfunction in metabolic
syndrome.
2. To find the types of thyroid dysfunction in Metabolic Syndrome.
3. To find the association of Thyroid Dysfunction and Metabolic
REVIEW OF LITERATURE
THE METABOLIC SYNDROME
―The metabolic syndrome is also known as syndrome X, (1) the
insulin resistance syndrome, (12) and the deadly quartet. (13) The
constellation of metabolic abnormalities includes insulin resistance, glucose
intolerance, central obesity, dyslipidemia, and hypertension, as well
documented risk factors for cardiovascular disease‖. When grouped together,
they are associated with increased risk of cardio vascular disease. (14, 15)
The concept of metabolic syndrome exists at least 80 years. (16) That was
first described in the 1920s by Klein, a Swedish physician, as the clustering
of hypertension, hyperglycaemia, and gout.
DEFINING THE METABOLIC SYNDROME
Although Reaven GM already highlighted the concepts of insulin
resistance and metabolic syndrome in 1988, it was not until 1998 before the
first attempt for an internationally accepted definition was put forward. (17)
Since then several expert groups have formulated and adapted definitions.
In an attempt to achieve some agreement on definition, and to provide a tool
for clinicians and researchers, a WHO consultation proposed a set of criteria.
Subsequently, the National Cholesterol Education Program’s Adult
Treatment Panel (NCEP: ATP III) and the European Group for the Study of
agree on essential components – glucose intolerance, obesity, hypertension
and dyslipidaemia – but do differ in the detail and criteria.
WHO 1999(18)
―Diabetes or impaired fasting glycaemia or impaired glucose tolerance
or insulin resistance plus two or more of the following:
1. Obesity: Body mass index >30 kg/m2 or waist: hip ratio >0.9 in males or
>0.85 in females.
2. Dyslipidemia: triglycerides ≥ 1.7 mmol/L or HDL < 0.9(male) or
<1.0(female) mmol/L.
3. Hypertension: Blood pressure ≥ 140/90 mm Hg.
4. Microalbuminuria: albumin excretion ≥ 20 microg/min.‖
EGIR 1999(19)
―Insulin resistance plus two or more of the following:
1. Central obesity: Waist circumference ≥ 94 cm (male) or ≥ 80 cm (female).
2. Dyslipidemia: Triglycerides > 2.0 mmol/L or HDL cholesterol <1.0
mmol/L.
3. Hypertension: Blood pressure ≥ 140/90 mm Hg and/or medication.
4. Fasting plasma glucose ≥ 6.1 mmol/L.‖
ATP III 2001(20)
―Three or more of the following:
1. Central Obesity: Waist circumference >102 cm (male) or >88 cm
2. Hypertriglyceridemia: Triglycerides ≥ 1.7 mmol/L.
3. Low HDL cholesterol: <1.0 mmol/L (male) or <1.3 mmol/L (female).
4. Hypertension: Blood pressure ≥ 135/85 mm Hg or medication.
5. Fasting plasma glucose ≥ 6.1 mmol/L.‖
AHA/NHLBI 2005(21)
―Any three of the five constitute diagnosis of metabolic syndrome.
1. Elevated waist circumference ≥ 102 cm (male) or ≥ 88 cm (female).
2. Elevated TGL ≥ 150 mgs/dl or medication.
3. Reduced HDL cholesterol < 40 in men or < 50 in women.
4. Elevated BP ≥ 130/85 mm Hg or medication.
5. Elevated fasting glucose ≥ 100mgs/dl or medication.‖
IDF 2005
―For a person to be defined as having the metabolic syndrome they must
have:
1. Central obesity – waist circumference ≥ 94 cm for European men and
≥ 80 cm for European women. For South Asians – Waist
circumference ≥ 90 for men and ≥ 80 for women.
plus any two of the following four factors:
2. Raised TG level ≥ 150 mgs/dl or any specific treatment.
3. Reduced HDL cholesterol < 40 mg/dl in males and < 50 mg/dl in
4. Raised blood pressure ≥ 130/85 mm Hg or medication.
5. Raised fasting glucose ≥ 100 mg/dl or previously diagnosed type 2
diabetes.‖
―A major issue for the IDF consensus consultation was the fact that
criteria used for obesity in Asian and other populations could be different
from those used in the west. This issue was supported by International
Obesity Task Force. (24) They noted that in urban Asians, the body mass
index range of 23-24 has an equivalent risk of type 2 diabetes, hypertension,
and dyslipidaemia as a body mass index of 25- 29.9 in white people.‖
PREVALENCE OF THE METABOLIC SYNDROME
A very consistent finding is that the prevalence of the metabolic
syndrome is highly age-dependent and differs with different diagnostic
criteria. ―Females are more prevalent than male all over the world. The
prevalence increased from 7% in aged 20-29 to 44% for those aged 60-69
years. (25) The prevalence of metabolic syndrome in Chennai was 11.2%
and 41.1% using EGIR and ATP III criteria respectively (26, 27).‖
Over the past two decades, a striking increase in the number of people
with the metabolic syndrome worldwide has taken place. This increase is
associated with the global epidemic of obesity and diabetes; with the
elevated risk not only of diabetes but also of cardiovascular disease from the
PATHOPHYSIOLOGY
―The most accepted underlying hypothesis to describe the
pathophysiology of the metabolic syndrome is insulin resistance. A major
contributor to the development of insulin resistance is an overabundance of
circulating fatty acids. (28) Insulin is important to both antilipolysis and the
stimulation of lipoprotein lipase.‖ Of note, the most sensitive pathway of
insulin action is the inhibition of lipolysis in adipose tissue. Thus, when the
insulin resistance develops, the increased amount of lipolysis of stored
triacylglycerol molecules in adipose tissue produces more fatty acids, which
could further inhibit antilipolytic effect of insulin, creating additional
lipolysis. Upon reaching insulin sensitive tissues, excessive fatty acids create
insulin resistance by the added substrate availability and by modifying
downstream signalling. ―Presumably, these biochemical changes in insulin
mediated signalling pathways result in decrease in insulin-mediated glucose
transport and metabolism in the metabolic syndrome as well.‖
OBESITY AND INCREASED WAIST CIRCUMFERENCE
For several definitions of the metabolic syndrome waist circumference
is included. With increase in intra-abdominal or visceral adipose tissue, a
higher rate of adipose tissue-derived free fatty acids go to the liver through
the splanchnic circulation. Whereas increase in abdominal subcutaneous fat
FI
GURE 1
:
P
AT
HOPHY
SI
OL
OGY
OF M
ET
AB
O
LI
C
S
YN
D
ROM
E.
Ref
H
AR
RIS
ON
'S TE
XT
BOO
K
OF
IN
TE
RN
AL
M
ED
ICI
N
effects on hepatic metabolism. Yet, perhaps by a mechanism related to free
fatty acid flux and metabolism, the relative predominance of visceral rather
than subcutaneous adipose tissue with increased waist circumference in
Asians and Asian Indians renders the relative prevalence of the syndrome
higher than African-American men in whom subcutaneous fat predominates.
DYSLIPIDAEMIA
In general, with increase in free fatty acid flux to the liver, increased
production of Apo-B containing triglyceride rich very low density
lipoproteins occur. In the setting of insulin resistance, increased flux of free
fatty acids to the liver increases hepatic triglycerides synthesis; however,
under physiologic conditions, insulin inhibits rather than increase the
secretion of very low density lipoproteins into the systemic circulation.
Hypertrygleridemia is an excellent reflection of the insulin resistant
condition and one of the important criteria for diagnosis of the metabolic
syndrome. The other major lipoprotein disturbance in the metabolic
syndrome is a reduction in HDL cholesterol. This reduction is a consequence
of changes in HDL composition and metabolism. In the presence of
hypertriglyceridaemia, a decrease in the cholesterol content of HDL results
from decreases in the cholesterol ester content of the lipoprotein core with
variable increases in triglyceride making the particle small and dense, a
This leads to increased clearance of HDL from the circulation. In
addition to the clearance of HDL composition of LDL is also modified
which is attributable to relative depletion of unesterified cholesterol,
esterified cholesterol, and phospholipids with either no change or an increase
in LDL triglyceride. ―Small dense LDL might be more atherogenic than
buoyant LDL because (1) it is more toxic to the endothelium; (2) it is more
able to transit through the endothelial basement membrane; (3) it adheres
well to glycosaminoglycans; (4) it has increased susceptibility to oxidation;
and/or (5) it is more selectively bound to scavenger receptors on monocyte
derived macrophages.‖
GLUCOSE INTOLERANCE
The defects in insulin action on glucose metabolism include
deficiencies in the ability of the hormone to suppress glucose production by
the liver and kidney, and to mediate glucose uptake and metabolism in
insulin sensitive tissues (i.e., muscle and adipose tissue). Insulin resistance in
pancreatic islet-beta cells implies that signals that generate glucose
dependent insulin secretion have been adversely modified, and fatty acids
are prime candidates. Although free fatty acids can stimulate insulin
secretion, increasing and prolonged exposure to excessive concentrations
results in fall in insulin secretion.
The mechanism for this alteration has been attributed to lipotoxicity
predispositions to development of diabetes, the presumed stress of the
insulin resistant environment on beta cell function causes glucose intolerance
and ultimately higher risk of diabetes
HYPERTENSION
The relation between insulin resistance and hypertension is well
established, and relates to several different mechanisms.
First, it is important to note that insulin is a vasodilator when given
intravenously to people of normal weight, with secondary effects on sodium
reabsorption in the kidney.
Evidence indicates that sodium reabsorption is increased in white
people but not Africans or Asians with the metabolic syndrome. In the
setting of insulin resistance, the vasodilatory effect of insulin can be lost, but
the renal effect on sodium reabsorption preserved. Fatty acids themselves
can mediate relative vasoconstriction. Insulin also increases the activity of
the sympathetic nervous system, an effect that might also be preserved in the
setting of the insulin resistance.
PROINFLAMMATORY CYTOKINES
The association of the metabolic syndrome with inflammation is well
documented. The increases in proinflammatory cytokines including
interleukin 6, resistin, and tumor necrosis factor (TNF) and C – reactive
protein reflect overproduction by the expanded adipose tissue mass.
tissue and might be at least in part the source of the generation of
proinflammatory cytokines locally and in the systemic circulation. There is
increasing evidence that insulin resistance in the liver, muscle, and adipose
tissue is not only associated with the abundance of proinflammatory
cytokines (and relative deficiency of the anti-inflammatory cytokine
adiponectin), but is a direct result of this burden.
ADIPONECTIN
Adiponectin is an anti-inflammatory cytokine that is produced
exclusively by adipocytes. Adiponectin both enhances insulin sensitivity and
inhibits many steps in the inflammatory process. In the liver, it inhibits both
the expression of hepatic gluconeogenic enzymes and the rate of endogenous
glucose production. In muscle, it increases glucose transport and enhances
fatty acid oxidation, effects that are partly due to the activation of AMP
kinase.
In mice decreased circulating concentrations of Adiponectin could be
important in producing changes in metabolism consistent with the metabolic
syndrome.
CHANGES ASSOCIATED WITH INSULIN RESISTANCE “LIPOPROTEINS
Increased apo B
Decreased apo A-1
Decreased HDL
Increased Apo C-III
PROTHOMBOTIC
Increased Fibrinogen
Increased plasminogen activator inhibitor 1 (PAI - 1)
Increase viscosity
INFLAMMATORY MARKERS
Increased white blood cell count
Increased Interleukin 6
Increased tumor necrosis factor alpha
Increased resistin
Increased C-reactive protein
Decreased adiponectin
VASCULAR
Microalbuminuria
Increased asymmetric dimethyl arginine
OTHER
Increased uric acid
Increased homocysteine
Non-alcoholic steatohepatitis (NASH)
Polycystic ovaries syndrome (PCOS)
MANAGEMENT OF THE METABOLIC SYNDROME
The primary goal of management of the metabolic syndrome is to reduce the
risk for clinical atherosclerotic disease. A closely related goal is to decrease
the risk for type 2 diabetes in those patients who do not yet manifest clinical
diabetes. The first line therapy is to reduce the major risk factors: stop
cigarette smoking and reduce LDL-C, blood pressure and glucose levels to
recommended goals. Lifestyle modifications are the first line interventions to
reduce the metabolic risk factors. The major lifestyle interventions include
weight loss, increased physical activity and modification of diet. For
individuals at higher risk consideration must be given to specific therapies
for the metabolic risk factors. (21) Selective CB1- receptor blockade drugs
like Rimonabant significantly reduces the several metabolic risk factors in
metabolic syndrome. (29,30)
THERAPEUTIC GOALS AND RECOMMENDATIONS Abdominal obesity:
Goal: 10% weight loss first year, thereafter continued weight loss or
maintain weight.
Recommendation: caloric restriction; regular exercise; behaviour
modification
Physical inactivity:
Goal: regular moderate-intensity physical activity.
Atherogenic diet:
Goals: reduced intakes of saturated fats, Trans-fats and cholesterol.
Recommendations: saturated fat 7% of total calories; reduce trans-fat;
Dietary cholesterol < 200 mg daily; total fat 25–35% of total calories.
Cigarette smoking:
Goal and recommendation: complete smoking cessation
LDL-Cholesterol:
“High risk patients are those who have established cardiovascular disease, diabetes, or 10 year risk for coronary heart disease more than 20%.
Moderately high risk patients are those with ten year risk of coronary artery
disease between 10-20%.‖
―The cholesterol guideline defined four statin benefit groups
1. all individuals who have clinical atherosclerotic cardiovascular disease
(ASCVD), therefore considered ―secondary prevention
2. those with LDL cholesterol ≥190 mg/dL without a secondary cause such
as a high intake of saturated or trans fats, various drugs, or certain
diseases;
3. individuals with diabetes without established cardiovascular disease who
are 40–75 years old and have LDL cholesterol of 70–189 mg/dL;
4. those without established ASCVD without diabetes who are 40–75 years
old and who have LDL cholesterol of 70–189 mg/dL and a calculated
Goals:
LDL cholesterol < 100 mg/dl (2·6 mmol/L).
―Recommendations:
I. High-risk patients—lifestyle therapies and LDL cholesterol lowering
drugs to achieve recommended goal. Moderately high-risk patients—
lifestyle therapies; add LDL-cholesterol lowering drug if necessary to
achieve recommended goal when baseline LDL cholesterol < 130
mg/dl (3·4 mmol/L).
II. Moderate risk patients (those with 10-year risk of coronary heart
disease less than 10%) —lifestyle therapies; add LDL-cholesterol
lowering drug if necessary to achieve recommended goal when
baseline LDL cholesterol _1·6 g/L (4·1 mmol/L).‖
High triglyceride:
Goal: insufficient data to establish goal
HDL-Cholesterol:
Recommendation: High-risk patients—consider adding fibrate (Preferably
fenofibrate) or nicotinic acid to LDL-lowering drug therapy
Elevated blood pressure:
Goals:
For diabetes or chronic kidney disease: Blood pressure < 130/80 mm Hg.
Recommendation: lifestyle therapies; add antihypertensive drug(s) when
necessary to achieve goals of therapy.
Elevated glucose:
Goal: maintenance or reduction in fasting glucose if _1 g/L (5·5 mmol/L).
HbA1C < 7.0% for diabetes.
Recommendation:
Lifestyle therapies; add hypoglycaemic agents as necessary to achieve goal
Fasting glucose or HbA1C.
Prothrombotic state:
Goal: reduction of prothrombotic state.
Recommendation:
High-risk patients—initiate low-dose aspirin therapy; consider clopidogrel if
aspirin is contraindicated. Moderately high-risk patients—consider low-dose
aspirin therapy. Proinflammatory state Recommendations: no specific
therapies
THYROID DYSFUNCTION
The thyroid is one of the largest endocrine glands in the body. Thyroid
produces three types of hormones, namely thyroxin (T4), triiodothyronine
(T3) and calcitonin. Among them T3 and T4 are two closely related
development, and maintain metabolic and homeostasis in adults. Up to 40%
of the T4 is converted to T3 by peripheral organs such as the liver, kidney
and spleen.
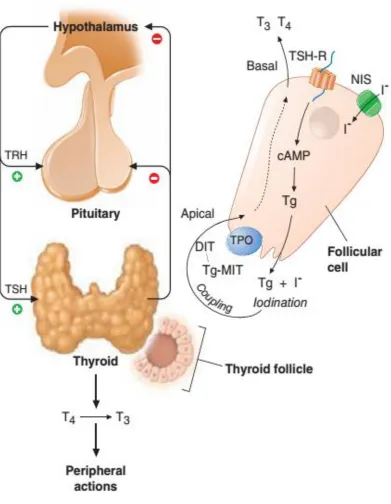
PHYSIOLOGY OF THYROID HORMONES
Thyroid hormone is produced from thyroglobulin (Tg), a large
glycoprotein. Inside thyroid follicle thyroglobulin is iodinated on the
tyrosine residues. They are coupled via ether linkage. The iodinated
thyroglobulin molecules are reuptaked by thyroid follicular cells where they
undergo proteolysis and release the newly formed thyroid hormones T3 and
T4.
The first major step in thyroid synthesis is iodine uptake from the
gut. iodine absorbed in the gut is converted into iodide and is transported in
the blood bound to albumin. It is then actively transferred into the thyroid
follicular cells by "Iodide trapping" by sodium iodide symporter. The
trapped iodide is oxidized to iodine and combines with tyrosine to form
Mono iodotyrosine (MIT) and Diiodotyrosine (DIT) . MIT and DIT are
coupled to form T3 whereas two DIT couple to form T4. Oxidation,
Iodination and coupling reactions are catalyzed by "Thyroid Peroxidase".
Thyroid hormones thus produced are bound with thyroglobulin until
secreted. Once secreted, it is transported in two forms in the blood. One is
bound form in which T3 and T4 are bound to plasma proteins namely
bound to thyroid binding globulin whereas T3 is predominantly bound to
albumin. The other form is free T3 and T4. These free forms are in
equilibrium with bound form.
In the periphery one third of T4 is converted to T3 by 5' Deiodinase
and 45% to rT3 by 5 Deiodinase. They are further metabolized to
Diiodothyronine. Only about 13% of T3 is produced from thyroid gland and
remaining 87% is formed from T4.
The production of thyroxin is regulated by thyroid-stimulating
hormone (TSH), released by anterior pituitary. The thyroid hormones and
thyrotropes form a negative feedback loop: TSH production is suppressed
when T4 levels are high, and vice versa. The TSH production itself is
modulated by thyrotropin-releasing hormone, which is produced by the
hormones in circulation and can be used as a useful tool in detection of
thyroid abnormalities rather than using T4 or T3 levels.
The thyroid dysfunction is simply classified as hypothyroidism,
hyperthyroidism, sub clinical hypothyroidism and sub clinical
hyperthyroidism depending upon the TSH and thyroid hormone levels.
Clinical status TSH level Thyroid hormone
Hypothyroid High Low
Hyperthyroid Low High
Sub clinical Hypothyroid High Normal
Sub clinical Hyperthyroid Low Normal
HYPOTHYROIDISM
Hypothyroidism is the condition resulting from lack of the effects of
the thyroid hormone on body tissues. Hypothyroidism is a common
condition. (31, 32) The overall incidence in the population is approximately
1% to 2 % (33, 34). The serum TSH levels more than 10mU/L and
associated with low values of thyroid hormones. Florid hypothyroidism can
be diagnosed clinically.
―The symptoms of hypothyroidism in descending order of frequency are:
Tiredness, Weakness
Dry Skin
Feeling Cold
Difficulty In Concentrating And Poor Memory
Constipation
Weight Gain With Poor Appetite
Dyspnea
Hoarse Voice
Menorrhagia (Later Amenorrhea)
Paraesthesia
Impaired Hearing
The signs of hypothyroidism in descending order of frequency are as
follows:
Tiredness, weakness
Dry coarse skin
Cool peripheral extremities
Puffy face, hands and feet (myxoedema)
Diffuse alopecia
Bradycardia
Peripheral oedema
Delayed tendon reflex relaxation
Carpal tunnel syndrome
HYPERTHYROIDISM
Hyperthyroidism is the condition resulting from the effect of excessive
amounts of thyroid hormones in the body tissues. Thyrotoxicosis is a
synonym. Grave’s disease is the most common cause of hyperthyroidism.
Approximately 0.5% to 1% of the population suffers from hyperthyroidism.
The TSH levels are suppressed, usually <0.1 mU/L and associated with high
levels of thyroid hormones.
―The symptoms of hyperthyroidism in descending order of frequency are as
follows:
Hyperactivity, irritability, dysphoria.
Heat intolerance and sweating
Palpitations
Fatigue and weakness
Weight loss with increased appetite
Diarrhoea
Polyuria
Oligomenorrhea, loss of libido
The signs of hyperthyroidism in descending order of frequency are follows:
Tachycardia; Atrial fibrillation in the elderly
Tremors
Goiter
Muscle weakness, proximal myopathy
Lid retraction or lid lag
Gynaecomastia.‖
SUB CLINICAL HYPOTHYROIDISM
According to the latest consensus statement by the American Association of
Clinical Endocrinologists, the American Thyroid Association and The
Endocrine Society, sub clinical hypothyroidism is defined as an elevated
serum TSH level (4.5mU/L to10mU/L) associated with normal total or free
T4 and T3 levels. (35) Several alternative names have been proposed to
describe this condition and include compensated hypothyroidism, mild
thyroid failure, and mild hypothyroidism. The overall prevalence is 2% to
8% in the general population. (33, 34, 36)
SUB CLINICAL HYPERTHYROIDISM
Sub clinical hyperthyroidism is defined as low serum TSH levels (0.1mU/l
to 0.4mU/L) associated with normal free T4 and free T3 levels. Sub clinical
hyperthyroidism is much less common than sub clinical hypothyroidism.
The prevalence is about 2%; it is more common in women, blacks, and the
elderly.
NON THYROIDAL ILLNESS
Alteration in serum thyroid hormones occurs in wide variety of illness which
predominantly affects the T3 level and no intrinsic disease of thyroid gland
syndrome, Non thyroidal illness syndrome and Thyroid hormone adaptation
syndrome. This syndrome occurs in wide variety of illness as follows:
a) Acute critical illness and febrile illness such as infections,
b) Myocardial infarction etc.
c) Injuries such as burns, trauma, etc.
d) Surgery
e) Fasting
f) Diabetes mellitus
g) Liver disease
h) Renal disease
i) Ketogenic diet
j) Drugs such as glucocorticoids, dopamine, phenytoin and beta
k) blockers
l) Malignancy
m)Psychiatric illness
In non-thyroidal illness state, initially there is decrease in serum T3 level,
both total and free T3 (FT3). This is associated with increase in reverse T3
(rT3).
As illness progresses, there is decrease in serum T4 also, a state called
"Low T3, T4 syndrome". Although total T4 level decreases, the free T4
(FT4) remains normal or slightly reduced. In spite of this reduced T3 and T4
differentiated from primary hypothyroidism. But many studies have showed
slight elevation of TSH level in Non thyroidal illness in the absence of
hypothyroidism.
THYROID FUNCTION AND THE METABOLIC SYNDROME
It is well documented that hypothyroidism is associated with all the
parameters of metabolic syndrome, (32) except increase in fasting blood
glucose.
OBESITY
The obesity (increase in waist circumference) is the important symptom and
sign of hypothyroidism. More than 60% of hypothyroid patients have obesity
(increase in waist circumference). (37) There is decrease in basal metabolic
rate and energy metabolism in hypothyroidism.
HYPERTENSION
In hypothyroidism, the hemodynamic alterations cause narrowing of pulse
pressure, prolongation of circulation time and decrease in blood flow to the
tissues. (38) Systemic vascular resistance is increased in hypothyroidism and
results in hypertension. (39) Rotterdam study(6) suggested that there was a
LIPID PROFILE
Both the synthesis and degradation of lipid are depressed in hypothyroidism,
the latter especially so, the net effect being one of the lipid accumulation,
especially of low-density lipoprotein cholesterol and triglycerides. (40) The
increase in serum cholesterol in hypothyroidism is accompanied by
increased levels of serum phospholipids, serum triglycerides, and the low
density lipoprotein cholesterol. The activity of cholesterol ester transfer
protein is decreased in hypothyroidism, thus high density lipoprotein
cholesterol level reduced in hypothyroidism. (41)
PREVIOUS RELATED STUDIES
Thyroid function is associated with components of the metabolic
syndrome in euthyroid subjects. (42) In this population based study there
was a negative correlation between thyroid hormone levels (free T4 and free
T3) and metabolic syndrome components, Apo B and insulin resistance
levels in people with euthyroid state. Free T4 was very significantly related
to four of five metabolic syndrome components - waist circumference,
fasting glucose, high density cholesterol and triglycerides and insulin
resistance level, which assessed by the homeostasis model assessment
(HOMA) model. i.e. low normal free T4 was associated with higher
triglycerides, lower high density lipoprotein cholesterol, increased fasting
glucose and higher waist circumference. Free T3 levels correlated well with
individuals are more susceptible to the association of TSH with higher low
density lipoprotein cholesterol and lower high density lipoprotein
cholesterol. (43) The morbid obese subjects have higher level of T3, T4 and
TSH, probably of the reset of their central thyrostat at higher levels. (44) In a
study done by Uzunulu et al., at Japan they have analyzed the prevalence of
sub clinical hypothyroidism among 220 metabolic syndrome patients. They
found that sub clinical hypothyroidism was 16.4% prevalent in metabolic
syndrome patients. (10) One sixth of metabolic syndrome patients had sub
clinical hypothyroidism and more prevalent in female gender.
In a study from Nepal, done by Chandra L et al., found that the
metabolic syndrome prevalent in 21.1% of thyroid dysfunction patients. (11)
They have assessed the association of metabolic syndrome and its
components with thyroid dysfunction in 100 female patients. This study
found that the prevalence of overall metabolic syndrome was 32%, more in
euthyroid group (21/48) than hyperthyroid group (5/24) and hypothyroid
METHODS
AND
METHODS AND MATERIALS
Study group : Patients with metabolic syndrome attending
Medical, diabetic and hypertensive opd.
Study design : Single Center Non-randomized cross-sectional study
Place Of Study : Govt. Kilpauk Medical College and Hospital
Duration of study : 6 months
Conflict of interest : Nil
Hazards of study : Nil
SETTING:
The study was conducted on the out patients attending the Institute of
Internal Medicine, Department of Diabetology and Hypertension OPD in
Kilpauk Medical College and l Hospital, Chennai.
METHODOLOGY
Detailed history of medication, and anthropometric measurements like
height, weight, waist circumference were noted in a semi-structured
proforma. Blood pressure was recorded in right upper limb in sitting posture.
After eight hours of fasting, blood drawn for fasting blood sugar, lipid
SELECTION OF STUDY SUBJECTS
The patients who fulfilled the criteria for metabolic syndrome by IDF were
taken into the study.
―For a person to be defined as having the metabolic syndrome they must
have:
1. Central obesity – waist circumference ≥ 90 cm for men and ≥
80 cm for women.
Plus any two of the following four factors:
2.Raised TG level ≥ 150 mgs/dl or any specific treatment.
3. Reduced HDL cholesterol < 40 mg/dl in males and < 50 mg/dl
in females.
4.Raised blood pressure ≥ 130/85 mm Hg or medication.
5. Raised fasting glucose ≥ 100 mg/dl or previously diagnosed type 2 diabetes‖
INCLUSION CRITERIA
The patients who fulfilled the criteria of metabolic syndrome as defined by
IDF 2005 were taken up for this study.
EXCLUSION CRITERIA
3. Taking Steroids 4. Severely ill patients 5. Pregnant Women
6. Individuals below 18 Yrs.
CONSENT
Informed consent will be obtained from all participants.
DATA COLLECTION
The data of each patient will be collected on a proforma specially designed
for this study and which includes demographic details, past medical history,
clinical data and biochemical results will be analysed for statistical
significance and correlation.
SAMPLE SIZE
DEFINITIONS
Euthyroidism
is defined as
TSH – 0.4 mU/L to 4.5mU/L
FT4 – 0.70 ng/dl to 1.80 ng/dl
Sub-clinical hypothyroidism
TSH – 4.51 mU/L to 10.0 mU/L
FT4 – 0.70 ng/dl to 1.80 ng/dl
Hypothyroidism
TSH – > 10.0 mU/L
FT4 – < 0.70 ng/dl
Sub-clinical Hyperthyroidism
TSH – 0.1 mU/L to 0.4 mU/L
FT4 – 0.70 ng/dl to 1.80 ng/dl
Hyperthyroidism
TSH – < 0.1 mU/L
FT4 – > 1.80 ng/dl
STATISTICAL ANALYSIS
SPSS 12 and Excel were used for data analysis
Small no of study subjects.
FT3 levels not assessed.
CONFLICT OF INTEREST
Results and Observations
.POPULATION CHARACTERISTICS
Total of 60 patients included in the study based on the inclusion and
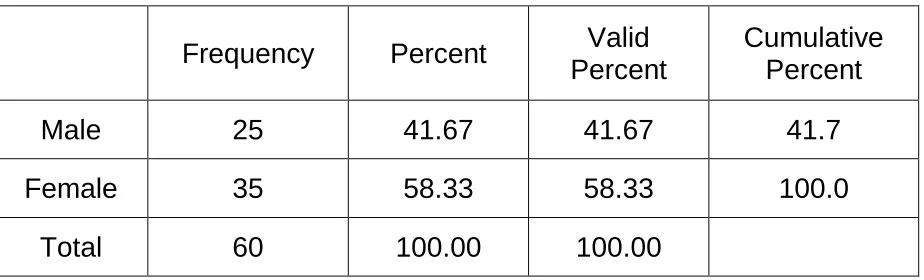
exclusion criteria of metabolic syndrome. Among them 33 were women and
27 were men. Women constitute around 55%of total cases and rest 45% by
men.
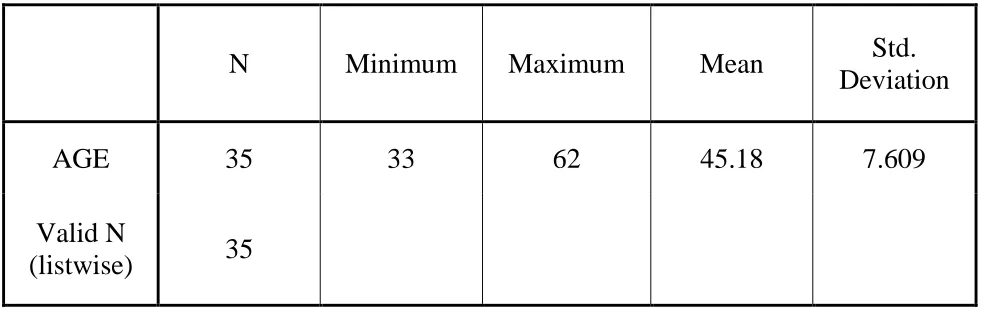
Age of the women ranges from 33 to 62 years with mean age 45.1 and
Standard Deviation 7.6. Age of the men ranges from minimum of 30 to
maximum of 67 with mean of 46.5 and Standard deviation of 9.7.
According to age, 7 patients were less than 35 years old. 24 patients
were in the age 35-45 age group, 19 were in 45-55 age group and 10 patients
were above 55 years. Population characteristics were shown in the Table 1.
Table 1: Descriptive statistics: SEX-MALE
N Minimum Maximum Mean Std.
Deviation
AGE 25 30 67 46.59 9.775
Valid N
(listwise) 25
Table 2: Descriptive statistics: SEX-FEMALE
N Minimum Maximum Mean Std.
Deviation
AGE 35 33 62 45.18 7.609
Valid N
(listwise) 35
a. SEX = Female
Table 3: Population Characteristics
AGE GROUP TOTAL NO PERCENTAGE CUMULATIVE
PERCENTAGE Male Female Up to 35 yrs. 7 11.7% 11.7% 3 4
36 - 45 yrs. 24 40.0% 51.7% 8 16
46 - 55 yrs. 19 31.7% 83.3% 8 11
Above 55 yrs. 10 16.7% 100.0% 6 4
[image:50.595.75.554.388.687.2]Table 4 Frequency table: SEX in study population
Frequency Percent Valid Percent
Cumulative Percent Male 25 41.67 41.67 41.7 Female 35 58.33 58.33 100.0
Total 60 100.00 100.00
As we cansee most of patients fall in the middle age group from 36 to
55 years, consistent with the changing lifestyle patterns and raising obesity
in the middle age group.
Among the sixty study subjects, twenty eight members (47%) fulfilled
three parameters for metabolic syndrome, twenty members (33%) fulfilled
four parameters and twelve members (20%) fulfilled all criteria for
metabolic syndrome.
Table 5: Frequency table: No of criteria positive for MS in subjects
Criteria for metabolic
syndrome Frequency Percent
Cumulative Percent
3 parameters 28 46.7 46.7
4 parameters 20 33.3 80.0
5 parameters 12 20.0 100.0
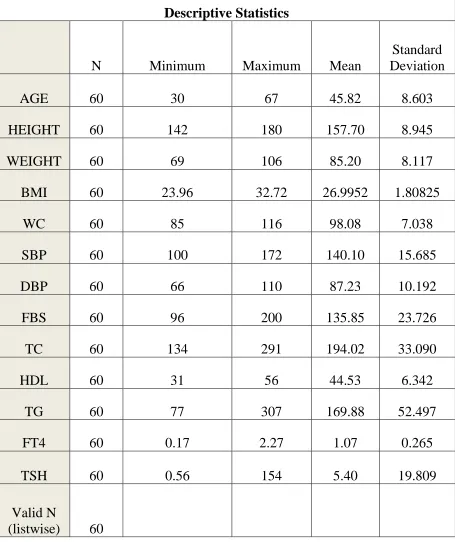
[image:51.595.71.544.562.740.2]Table 6: Descriptive statistics of the variables in study population
Descriptive Statistics
N Minimum Maximum Mean
Standard Deviation
AGE 60 30 67 45.82 8.603
HEIGHT 60 142 180 157.70 8.945
WEIGHT 60 69 106 85.20 8.117
BMI 60 23.96 32.72 26.9952 1.80825
WC 60 85 116 98.08 7.038
SBP 60 100 172 140.10 15.685
DBP 60 66 110 87.23 10.192
FBS 60 96 200 135.85 23.726
TC 60 134 291 194.02 33.090
HDL 60 31 56 44.53 6.342
TG 60 77 307 169.88 52.497
FT4 60 0.17 2.27 1.07 0.265
TSH 60 0.56 154 5.40 19.809
Valid N
As waist circumference is absolute criteria to define metabolic
syndrome, it is present in all subjects. The following tables show frequency
distribution of the other criteria of metabolic syndrome.
Table 7: Frequency table- Diabetes in study subjects
Frequency Percent Cumulative Percent
Absent 2 3.3 3.3
Present 58 96.7 100.0
Total 60 100.0
Table 8: Frequency table- Hypertension in study subjects
Frequency Percent Cumulative Percent
Absent 15 25.0 25.0
Present 45 75.0 100.0
Total 60 100.0
Table 9: Frequency table- Triglycerides in study subjects
Frequency Percent Cumulative Percent
Absent 24 40.0 40.0
Present 36 60.0 100.0
Total 60 100.0
Table 10: Frequency table- HDL in study subjects
Frequency Percent Cumulative Percent
Absent 35 58.3 58.3
Present 25 41.7 100.0
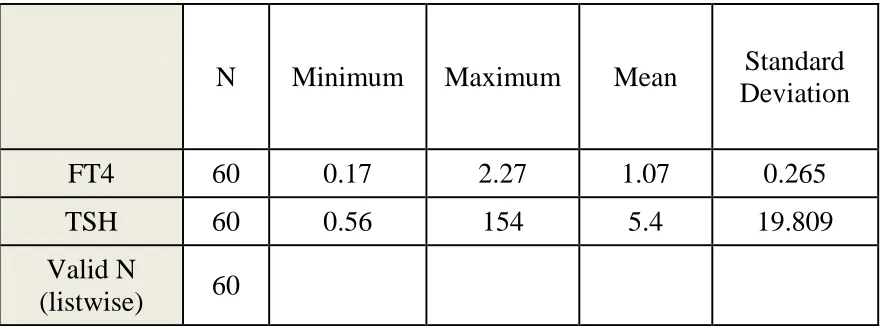
THYROID FUNCTION TEST RESULTS
The TSH in this study was ranging from 0.56mU/L to 154 mU/L and
free T4 levels ranging from 0.17ng/dl to 2.21ng/dl. Patients were grouped
into four groups according to the definitions based on TSH and FT4 levels
and further statistical analysis was done based on these groups. According to
our definitions, 49 patients found to be euthyroid and two patients were
hypothyroid. Nine patients had sub clinical hypothyroidism. There were no
[image:54.595.72.512.393.556.2]overt hyperthyroid or sub-clinical hyperthyroidism patients in our study.
Table 11: Distribution thyroid parameters
N Minimum Maximum Mean Standard
Deviation
FT4 60 0.17 2.27 1.07 0.265
TSH 60 0.56 154 5.4 19.809
Valid N
(listwise) 60
The TSH in this study was ranging from 0.56mU/L to 154 mU/L and
free T4 levels ranging from 0.17ng/dl to 2.21ng/dl. Patients were grouped
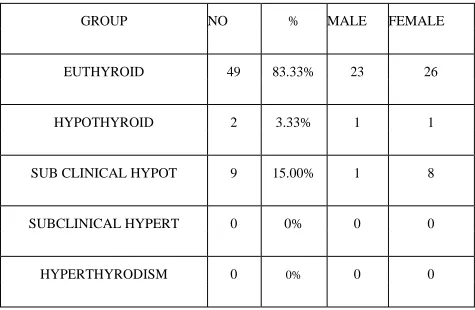
Table 12 : Thyroid status of the study population
GROUP NO % MALE FEMALE
EUTHYROID 49 83.33% 23 26
HYPOTHYROID 2 3.33% 1 1
SUB CLINICAL HYPOT 9 15.00% 1 8
SUBCLINICAL HYPERT 0 0% 0 0
HYPERTHYRODISM 0 0% 0 0
and further statistical analysis was done based on these groups. According to
our definitions, 49 patients found to be euthyroid and two patients were
hypothyroid. Nine patients had sub clinical hypothyroidism. There were no
overt hyperthyroid or sub-clinical hyperthyroidism patients in our study.
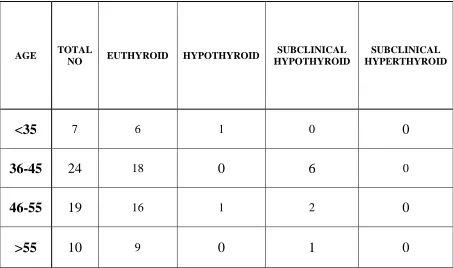
According to the age, among patients age less than 35, there were
seven subjects. Six were Euthyroid and one is Overt hypothyroid. No
subclinical hypo or hyperthyroid in this group.
In the age group 36-45 there were 24 subjects, among them eighteen
were no overt hypo or hyperthyroid in this group
Table - 13. Age Wise Thyroid Dysfunction
AGE TOTAL
NO EUTHYROID HYPOTHYROID
SUBCLINICAL HYPOTHYROID
SUBCLINICAL HYPERTHYROID
<35 7 6 1 0 0
36-45 24 18 0 6 0
46-55 19 16 1 2 0
>55 10 9 0 1 0
In the age group 46-55, there were 19 members. Among them sixteen
were Euthyroid; one is overt hypothyroid and other two were Subclinical
hypothyroid. There was no subclinical hyperthyroid in this group.
In the subjects more than 55 years, there were ten members. Among
them nine were Euthyroid and remaining one is Subclinical Hypothyroid.
There were no overt hypothyroid or subclinical hyperthyroid in this group.
Based on the metabolic syndrome criteria, of those twenty eight
dysfunction (2-hypothyroid and 1-subclinical hyperthyroid); of the twenty
patients who had four risk factors three had thyroid dysfunction (all
subclinical hypothyroid); of the twelve patients who had all five risk factors
five had thyroid dysfunction (one overt hypothyroid and four subclinical
hypo thyroid).
Table 14: Metabolic Syndrome Parameters Wise Thyroid Dysfunction
MS CRITERIA FULFILLED
TOTAL
NO EUTHYROID HYPOTHYROID
SUBCLINICAL HYPOTHYROID
SUBCLINICAL HYPERTHYROID
3 28 25 1 2 0
4 20 17 0 3 0
5 12 7 1 4 0
TOTAL 60 49 2 9 0
(P valve = 0.36 not significant)
Presence of thyroid dysfunction based on number of criteria present is statistically significant in our study possibly due to limited number of study
subjects.
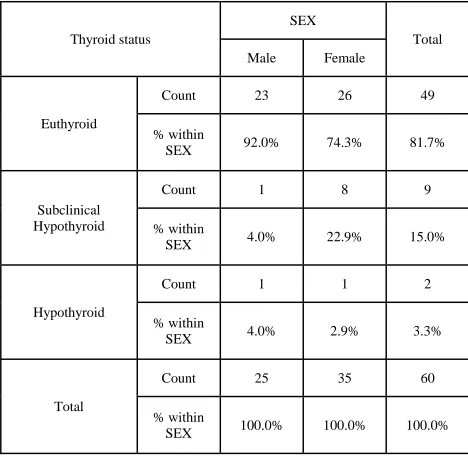
Table 15: Crosstab Thyroid Status With Respect Sex Distribution
Thyroid status
SEX
Total
Male Female
Euthyroid
Count 23 26 49
% within
SEX 92.0% 74.3% 81.7%
Subclinical Hypothyroid
Count 1 8 9
% within
SEX 4.0% 22.9% 15.0%
Hypothyroid
Count 1 1 2
% within
SEX 4.0% 2.9% 3.3%
Total
Count 25 35 60
% within
SEX 100.0% 100.0% 100.0%
Women has higher incidence of thyroid dysfunction when compared
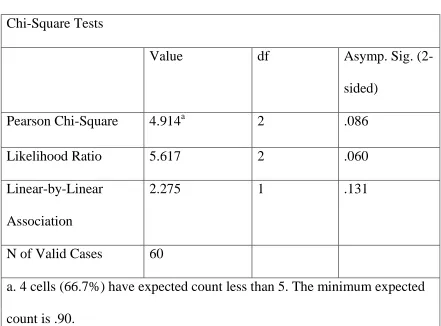
Table 16: Chi-Square Tests – thyroid status vs sex
Chi-Square Tests
Value df Asymp. Sig.
(2-sided)
Pearson Chi-Square 4.914a 2 .086
Likelihood Ratio 5.617 2 .060
Linear-by-Linear
Association
2.275 1 .131
N of Valid Cases 60
a. 4 cells (66.7%) have expected count less than 5. The minimum expected
count is .90.
Chi-square tests did not any significance of thyroid status distribution
with respect to sex in study subjects possibly due to limited number of study
subjects.
Analysis of study subjects with respect to number of criteria fulfilled
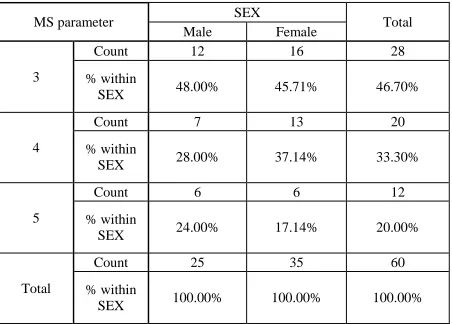
Table 17: Distribution Number of MS parameter with respect to sex
MS parameter SEX Total
Male Female
3
Count 12 16 28
% within
SEX 48.00% 45.71% 46.70%
4
Count 7 13 20
% within
SEX 28.00% 37.14% 33.30%
5
Count 6 6 12
% within
SEX 24.00% 17.14% 20.00%
Total
Count 25 35 60
% within
SEX 100.00% 100.00% 100.00%
Table 18: Chi-Square test – MS parameter vs Sex Chi-Square Tests
Value df
Asymp. Sig. (2-sided)
Pearson Chi-Square .346a 2 .841
Likelihood Ratio .347 2 .841
Linear-by-Linear Association
.004 1 .947
N of Valid Cases 60
[image:60.595.68.527.520.748.2]Distribution of MS parameter with respect to sex in not significant in
our study.
Analysis of thyroid status of the study subjects against number of
[image:61.595.74.550.296.683.2]criteria fulfilled for Metabolic Syndrome by the subjects.
Table 19: Distribution- Thyroid status with respect to no. of MS parameter
Thyroid status
MS parameter
Total
3 4 5
Euthyroid
Count 25 17 7 49
% within MS
parameter 89.3% 85.0% 58.3% 81.7%
Subclinical Hypothyroid
Count 2 3 4 9
% within MS
parameter 7.1% 15.0% 33.3% 15.0%
Hypothyroid
Count 1 0 1 2
% within MS
parameter 3.6% 0.0% 8.3% 3.3%
Total Count 28 20 12 60
% within MS
Table 20: Chi-square test- thyroid status vs MS parameter
Chi-Square Tests
Value df
Asymp. Sig. (2-sided)
Pearson Chi-Square 6.439a 4 .169
Likelihood Ratio 6.500 4 .165
Linear-by-Linear Association
3.479 1 .062
N of Valid Cases 60
a. 6 cells (66.7%) have expected count less than 5. The minimum expected count is .40.
Association between thyroid status and number of criteria positive for
metabolic syndrome is not significant in our study
Now finally correlation of the individual parameters of metabolic
syndrome in thyroid dysfunction and euthyroid in metabolic syndrome is
studied.
Table 21: Frequency table- thyroid dysfunction and euthyroid in metabolic syndrome in study subjects
Frequency Percent Cumulative Percent Euthyroid 49 81.7 81.7
Table 22: Distribution of MS parameters in Euthyroid and Thyroid dysfunction
Thyroid status N Mean Std. Deviation Std. Error Mean
WC
Euthyroid 49 98.2 6.7 0.961
Thyroid
Dysfunction 11 97.6 8.7 2.609
SBP
Euthyroid 49 140.7 15.7 2.246
Thyroid
Dysfunction 11 137.6 16 4.83
DBP
Euthyroid 49 87.2 10.5 1.5
Thyroid
Dysfunction 11 87.5 9.1 2.751
FBS
Euthyroid 49 138 25.4 3.622
Thyroid
Dysfunction 11 126.1 10.3 3.111
TC
Euthyroid 49 193.3 34.5 4.934
Thyroid
Dysfunction 11 197.4 26.8 8.086
HDL
Euthyroid 49 43.9 6.3 0.902
Thyroid
Dysfunction 11 47.3 6 1.799
TG
Euthyroid 49 171.8 54.7 7.808
Thyroid
Table 23: Independent sample test
Levene's Test for Equality of Variances
t-test for Equality of Means
F Sig. t df
Sig. (2-tailed) Mean Difference Std. Error Difference 95% Confidence Interval of the
Difference
Lower Upper
WC
Equal variances
assumed
0.562 0.456 0.231 58 0.818 0.547 2.367 -4.191 5.286
Equal variances
not assumed
0.197 12.848 0.847 0.547 2.78 -5.466 6.56
SBP
Equal variances
assumed
0.007 0.932 0.573 58 0.569 3.017 5.263 -7.519 13.552
Equal variances
not assumed
0.566 14.65 0.58 3.017 5.327 -8.361 14.395
DBP
Equal variances
assumed
0.23 0.633 -0.079 58 0.937 -0.271 3.429 -7.136 6.594
Equal variances
not assumed
-0.086 16.528 0.932 -0.271 3.134 -6.897 6.356
FBS
Equal variances
assumed
11.391 0.001 1.527 58 0.132 11.95 7.828 -3.72 27.62
Equal variances
not assumed
2.502 40.124 0.017 11.95 4.775 2.3 21.6
HDL
Equal variances
assumed
0.006 0.938 -1.606 58 0.114 -3.354 2.088 -7.534 0.825
Equal variances
not assumed
-1.666 15.46 0.116 -3.354 2.013 -7.634 0.925
TG
Equal variances
assumed
0.493 0.486 0.58 58 0.564 10.21 17.615 -25.05 45.469
not
Due to small number of study subjects correlation of metabolic
syndrome parameters between euthyroid and thyroid dysfunction is not
significant.
Lastly correlation between TSH and FT4 is analysed against metabolic
syndrome parameters in euthyroid and thyroid dysfunction is analysed.
Table 24: correlation between TSH and FT4 and MS parameters in Euthyroid
FT4 TSH
Spearman's rho
WC
Correlation Coefficient .139 .049
Sig. (2-tailed) .341 .740
N 49 49
SBP
Correlation Coefficient .015 .106
Sig. (2-tailed) .921 .467
N 49 49
DBP
Correlation Coefficient .067 .028
Sig. (2-tailed) .650 .848
N 49 49
FBS
Correlation Coefficient -.080 -.082
Sig. (2-tailed) .584 .574
N 49 49
TC
Correlation Coefficient -.066 .103
Sig. (2-tailed) .654 .481
N 49 49
HDL
Correlation Coefficient -.007 -.013
Sig. (2-tailed) .960 .928
N 49 49
TG
Correlation Coefficient .146 .003
Sig. (2-tailed) .317 .985
Table 25: correlation between TSH and FT4 and MS parameters in Thyroiddysfunction
.
FT4 TSH
Spearman's rho
WC
Correlation Coefficient .150 -.044
Sig. (2-tailed) .659 .897
N 11 11
SBP
Correlation Coefficient .400 -.331
Sig. (2-tailed) .223 .320
N 11 11
DBP
Correlation Coefficient .253 -.080
Sig. (2-tailed) .452 .814
N 11 11
FBS
Correlation Coefficient -.200 -.014
Sig. (2-tailed) .555 .967
N 11 11
TC
Correlation Coefficient -.301 -.096
Sig. (2-tailed) .369 .779
N 11 11
HDL
Correlation Coefficient .202 .125
Sig. (2-tailed) .551 .714
N 11 11
TG
Correlation Coefficient .400 -.140
Sig. (2-tailed) .223 .682
TABLE 26: DISTRIBUTION OF INDICES
EUTHYROID THYROID DYSFUNCTION
MEAN SD MEAN SD
AGE 46.35 8.82 43.45 7.49
HEIGHT 158.49 9.02 154.18 8.05
WEIGHT 85.67 7.78 83.09 9.62
BMI 27.01 1.59 26.94 2.68
WC 98.18 6.73 97.64 8.65
SBP 140.65 15.72 137.64 16.02
DBP 87.18 10.5 87.45 9.13
FBS 138.04 25.36 126.09 10.32
TC 193.27 34.54 197.36 26.82
HDL 43.55 6.24 47.27 5.97
TGL 171.76 54.65 161.55 42.76
FT4 1.13 0.24 0.82 0.24
TSH 1.75 0.79 21.6 44.25
(P valve > 0.05 not significant at 5% level)
As there were small no of patients with very high variants, statistically
Figure 3: Sex distribution of study subjects
MALE, 25, 42% FEMALE, 35, 58%
GENDER DISTRIBURION
Figure 4: MS parameter distribution
3 PARAMETER 47% 4 PARAMETER
33%
5 PARAMETER 20%
MSPARAMETER DISTRIBUTION
Figure 5: Age distribution of study subjects
0 5 10 15 20 25
Upto 35 yrs 36 - 45 yrs 46 - 55 yrs Above 55 yrs
n
o
.of su
b
jec
ts
Age groups
Figure 6: Frequency of MS parameters in study subjects
Table 27: Frequency table – MS parameters in study subjects.
WAIST
CIRCUMFERENCE DIABETIC TRIGLYCERIDES HYPERTENTION HDL
Absent 0 2 24 15 35 Present 60 58 36 45 25
0 2
24
15
35 60 58
36
45
25 0
10 20 30 40 50 60 70
WAIST CIRCUMFERENCE
Figure 7: Thyroid status of study subjects
49 9 2 0 0
10 20 30 40 50 60
Figure 8: MS parameter – Sex Distribution
13
8
6 15
12
6 0
2 4 6 8 10 12 14 16
III PARAMETERS IV PARAMETERS V PARAMETERS
Figure 9: Thyroid status – Age Distribution
7
6
1
0 0 24
18
0
6
0 19
16
1
2
0 10
9
0
1
0 0
5 10 15 20 25 30
TOTAL NO EUTHYROID HYPOTHYROID SUBCLINICAL HYPOTHYROID
SUBCLINICAL HYPERTHYROID
Chart Title
Figure 10: Thyroid status vs. MS parameter
28
20
12 25
17
7 1
0 1 2 3
4 0 0 0 0
5 10 15 20 25 30
III PARAMETERS IV PARAMETERS V PARAMETERS TOTAL NO EUTHYROID HYPOTHYROID
Figure 11: Thyroid status sex distribution
0 5 10 15 20 25 30 35 40 45 50
EUTHYROID SUBCLINICAL HYPOTHYROID
HYPOTHYROID FEMALE 25 8 1 MALE 23 1 1
25
8
1
N
0.
Figure 12: Mean MS parameter in Euthyroid and Thyroid Dysfunction
Euthyroid Thyroid Dysfunction WC 98.2 97.6 SBP 140.7 137.6 DBP 87.2 87.5 FBS 138 128.1 TG 193 197 HDL 43.9 47.6
98.2 97.6 140.7
137.6 87.2 87.5
138
128.1 193 197
43.9 47.6 0
50 100 150 200 250
DISCUSSION
―The metabolic syndrome is a cluster of metabolic abnormalities wherein
people are obese and have hypertension, high triglyceride level, low high
density lipoprotein cholesterol and abnormal fasting glucose levels. (4) People
with metabolic syndrome are at high risk for developing cardiovascular disease
and type-2 diabetes.‖ Hypothyroidism is associated with lipid abnormalities
like high triglycerides and low high density lipoproteins, weight gain, glucose
intolerance and hypertension. (32) Thus hypothyroidism mimics the parameters
of metabolic syndrome.
In this study, thyroid dysfunction prevalence is 18.33% among metabolic
syndrome patients. Subclinical Hypothyroidism is 15% prevalent in metabolic
syndrome patients and Overt Hypothyroidism is 3.3% prevalent. There is no
incidence of either overt or subclinical Hyperthyroidism in our study
population. The prevalence of thyroid dysfunction and hypothyroidism in
metabolic syndrome patients are higher than the prevalence in normal
population, which is 5.9% for thyroid dysfunction and 4.6% for
hypothyroidism (0.3% overt and 4.3% sub clinical hypothyroidism)(34). This
study is consistent with study done by Uzunulu et al, as 16.4% of metabolic
syndrome patients had hypothyroidism in (35, 44, 46) Japan. (10) In this study
prevalence of subclinical hyperthyroidism is 1.7% and there is no overt or
clinical hyperthyroidism.
patient with metabolic syndrome has Subclinical hypothyroidism. And one in
every 30 patients has overt hypothyroidism. In these hypothyroidism patients,
treatment with levothyroxine replacement reverses the symptoms and signs of
hypothyroidism, thereby those factors which mimic metabolic syndrome.
It is well known and proven that, by treating with levothyroxine
replacement in all overt or clinical hypothyroid patients, we can reduce all the
metabolic parameters and cardiovascular risk. (32) Controversy in treating
sub-clinical hypothyroidism patients.
Managements of patients sub clinical hypothyroidism remain
controversial because the body of scientific evidence available to guide clinical
decision is limited. The risk of progression from subclinical hypothyroidism to
overt hypothyroid is 2-5% per year. (46) A meta-analysis report shows that
levothyroxine therapy in individuals with sub clinical hypothyroidism lowers
mean serum total and low density cholesterol concentration significantly and
the reduction in serum cholesterol may be larger in individuals with higher
pre-treatment cholesterol levels. (47) Another double blind placebo-controlled trial
(Basal Thyroid Study) shows that an important risk reduction of cardiovascular
mortality of 9 – 31% possible by improvement in low density lipoprotein
cholesterol in sub clinical hypothyroidism patients treated with levothyroxine
therapy. (48, 51) Surks et al., recommends treating sub clinical hypothyroidism
associated with type 2 diabetes and hypertension in his scientific review. (46)
As the metabolic syndrome patients have hyperlipidaemia, diabetes,
metabolic syndrome patients having sub clinical hypothyroidism by
levothyroxine replacement therapy. While there appears to be no adverse
effects of initiating levothyroxine treatment in this setting, inadvertent
overtreatment occurs in 14-21% of levothyroxine treated patients,(49, 50)
carrying potential risks of osteoporosis and atrial fibrillation when serum TSH
falls below 0.1 mU/L.(52) These patient need frequent thyroid function tests to
avoid this complication.
This study shows that the prevalence of thyroid dysfunction in metabolic
syndrome patients is higher than in normal subjects. One sixth of metabolic
syndrome patients or every sixth metabolic syndrome had hypo