Community Based Forest Management Systems in
Developing Countries and Eligibility for the CDM
Tek Narayan Maraseni1, Geoff Cockfield2 and Armando Apan3
1
PhD Student, University of Southern Queensland (USQ), Toowoomba, 4350, Australia, Phone: 07-4631-1274, Email: [email protected]
2
Head, Department of Economics & Resources Management, USQ, Toowoomba, 4350, Australia 3
Senior Lecturer, Geospatial Information & Remote Sensing, USQ, Toowoomba, 4350, Australia
Abstract
Concerns have been raised among the scientific communities about the increased atmospheric concentration of carbon dioxide (CO2). Carbon sequestration rates can be maintained or
increased by afforestation, reforestation, avoided deforestation, forest preservation and particular tending and cultural operations on existing forests. Of these, afforestation and reforestation are the only eligible project activities under the Clean Development Mechanism (CDM). Of the three market-based mechanisms of the Kyoto Protocol (KP), CDM is the only one designed for developing countries where, coincidently, community based forest management systems (CBFMS) are becoming the main form of forest management. Under these systems, enhanced natural regeneration, forest preservation and wise utilization through different sets of cultural and tending operations are widely practiced in Africa, Asia and Latin America. These systems are often more compatible with the essence of the Convention on Biological Diversity (CBD) than are alternative management systems.
Using Nepal as a case study, this paper highlights the importance of community forests in developing countries and then explains why many of them may not be eligible for CDM project activities. After that, some reasons why enhanced natural regeneration and forest preservation activities should be considered under the CDM project activities will be discussed. If community forests contribute to achieving the main objectives of CDM program as well as providing biodiversity benefits, and if they are the only socially acceptable and economically viable option, then they should be eligible under the CDM project activities. In particular, the CDM forest definition (>10% crown cover) should not be a barrier to their eligibility.
1. Introduction
The atmospheric concentration of carbon dioxide (CO2) has increased rapidly since the
beginning of industrialization (Kirschbaum, 2003). This phenomenon has been linked to several detrimental effects and so reducing the atmospheric concentration of CO2 is becoming
a target of global communities. In the forestry sector, it can be reduced by afforestation, reforestation, avoided deforestation, forest preservation and particular tending and cultural operations. For the first commitment period (2008-2012) of Kyoto Protocol, afforestation and reforestation are the only eligible project activities under the Clean Development Mechanism (CDM). CDM is designed for developing countries where, coincidentally, community based forest management systems (CBFMS) are becoming more popular. At least 22 percent of the total forest area is either community reserved or owned by communities in developing countries, compared with only three percent in developed countries (White and Martin, 2002). Sooner or later the forest management regimes in developing countries could be dominated by CBFMS, with enhanced natural regeneration and forest preservation being the dominant management strategies (Smith and Scherr, 2002).
The objectives of this review are to analyze: the current body of literature about the eligibility of enhanced natural regeneration and forest preservation activities of CBFMS under the CDM project activities; the role of CBFMS for carbon sequestration; and the reasons why such activities could or should be eligible for CDM project activities. The review study is organized as follows: Section two analyses the history of CDM and related definitions in forestry sector. Section three presents the concept of community based forest management system taking the case example of Nepal. Section four describes why enhanced regeneration and forest preservation activities should be considered under CDM. Finally, Section five presents the key conclusion of the study.
2. Context of CDM in Forestry Activities
The United Nations Framework Convention on Climate Change (UNFCCC) and the subsequent Conferences of Parties (COPs) raised the level of concern about stabilizing greenhouse gas concentrations in the atmosphere so as to avoid climatic calamities. The Kyoto Protocol (UNFCCC, 1997) was to be a milestone in that for the first time the Parties would accept legally binding constraints on greenhouse gas emissions. In the Protocol, individual nations were allocated differentiated targets, ranging from an eight percent reduction for the European Union to a ten percent increase for Iceland, to achieve the collective target of greenhouse gas reduction by at least 5.2 percent of 1990 levels by the first commitment period (2008-2012). To achieve these targets in a cost-effective manner, the Protocol adopted three mechanisms: Emissions Trading, Joint Implementation and Clean Development Mechanism (CDM). Of those, CDM is the only mechanism related to developing countries and the main objective is to help Annex I countries to meet their quantified emission reductions obligations at lower cost while helping Non-Annex I countries in achieving sustainable development.
the first commitment period (2008-2012) with a cap of one percent of the developed country’s 1990 level for each year of the first commitment period. Avoided deforestation and forest preservation activities were categorically excluded from the CDM agenda.
2.1 CDM Related Definitions in Forestry Sector
The COP9 (UNFCCC, 2003) set out several important definitions and rules. Most notable is that…. ‘forest is a minimum area of land of 0.05-1.0 hectares with tree crown cover of more than 10-30 percent with trees with the potential to reach a minimum height of 2-5 meters at maturity in situ’. Each Party shall select a single minimum value of crown cover, height and area from the given ranges but it should be consistent with the information that has historically been reported to FAO or other international bodies, and if the criteria used differ from that reporting then any disparity must be justified. The FAO (2000), United Nation Environment Program (UNEP) and the Convention of Biological diversity (CBD) define forest as having a land area of more than 0.5 ha with a canopy cover of more than 10 percent (FAO, 2001). The legal definition of forest in Nepal (any land declared as a forest under the forest Act (1993) is not compatible with the definitions of the FAO, UNEP or CDM.
According to CDM, all land which does not qualify as ‘forest’ is therefore ‘non-forest’ land. This means that some degraded forest areas of Nepal which have less than 10 percent crown cover will not qualify as CDM ‘forest’. They could however, be easily developed into CDM forest (>10% crown cover) once they are protected from fire and grazing. On the other hand, ‘young natural stands which have yet to reach a crown density of 10-30 per cent or tree height of 2-5 meters are included under CDM forest’ (UNFCCC, 2003). This definition is trying to cover the degraded forest area as a CDM ‘forest’. Moreover, time is another important factor. In Nepal, the government is making management plan to recuperate the degraded lands. There is dilemma whether or not that management plan activity is eligible under the CDM.
A second definition is that…‘reforestation is the direct human-induced conversion of non-forested land to non-forested land through planting, seeding and/or the human-induced promotion of natural seed sources, on land that was forested but that has been converted to non-forested land’ (UNFCCC, 2003). Some confusion arises about natural seed sources as to whether this definition incorporates coppice systems which are the major regeneration mechanism in broadleaf species in Nepal. Once the area is protected from fire and grazing, many coppices come from the roots and stumps of harvested trees.
3. Community Based Forest Management System (CBFMS)
Though the terminology, definition and modalities of each category of CBFMS are different, they share certain characteristics, including: commitment of people to the conservation and management of resources, decentralization of power to the locals, achieving the objectives of social, economic and environmental benefits, defined property right and inclusion of traditional values and ecological knowledge in resource management (Kellert et al., 2000).
3.1 The Growing Importance of Community Based Management in Developing Countries
Forests cover 26.6 percent (3454 Mha) of the total land area of the world of which developing countries account for 56.8 percent. The comparison of forest cover in the period 1990-1995 indicated a net loss of 56.3 Mha forest area, representing a decrease of 65.1 Mha (0.65% per annum) in developing countries and an increase of 8.8 Mha (0.06% per annum) in developed countries (FAO, 1999). According to White and Martin (2002), about 77 percent of the world’s forests are owned and administered by governments and at least 11 percent either reserved for, or owned by, communities. Around 57 percent of the area owned or reserved for communities, has been transferred to them in the last 15 years
At least 10 countries (Australia, 1996; Bolivia, 1996; Brazil, 1988; Colombia, 1991; Indonesia, 2000; Mozambique, 1997; Philippines, 1997; Tanzania, 1999; Uganda, 2000 and Zambia, 1995) have enacted new legislation to strengthen indigenous ownership during the period of 1988-2000 (White and Martin, 2002). Several other countries, such as Chad, the Comoros, Congo, Kenya, Morocco, the Niger, Nigeria, Swaziland and Togo have drafted new forest legislation in line with participatory management systems during 2002 (Wily, 2003). Among others, corruption and illegal logging are the main reasons why many countries are shifting to the community system. Illegal logging on public forest land is estimated to cost governments at least $10-15 billion per year (White and Martin, 2002) which is equal to more than 700 years of Nepalese budget outlays.
Around 32 percent of the total forest area of Benin and Cameroon, 37 percent of Burkina Faso, 46 percent of Zimbabwe and 90 percent of The Congo is under community based management system (Potters et al., 2003). Similarly, in the Philippines more than three million ha of forestland is under community control while in India, 14 million ha (18.42 percent of total legally defined forest land (76.63 million ha) is managed as a Joint Forest Management system where 63618 Forest Protection Committees are involving (Government of India, 2002). Nepal, a pioneer country in community forestry, has handed over one million ha of forestland to around 13,000 Forest User Groups (34% of the total Nepalese households) and plans to handover 61 percent (3.5 M ha) of the total forest to the community (CFDP Database, 2003).
3.2 Community Forestry in Nepal
From 1845 to 1951, Nepal was ruled by the Rana family and the forestry sector was administered under a feudal system. As there were no sources of income, the forests of the
Nationalization Act in 1957 but with ineffective management such forests tended to become open access. Consequently, there was widespread indiscriminate, cutting of forest and conversion of forestland into non-forest land (DoF and DRFS, 2002).
Consequently, the government tried an alternative approach with the National Forestry Plan of 1976. In line with the Plan, the government introduced new rules in 1978, and handed over national forest to local elected bodies (Bartlett and Malla, 1992). Since then, community forestry has been the mainstream of forest policy and programs in Nepal (Chapaigai et al, 1999). The greatest focus on CF followed the development of a 21-year master plan for the forestry sector, whereby 46.6 percent of the total forestry budget (US$ 1.74 billion) has been allocated for CF along with private forestry sector (HMG Nepal, 1988). The original purpose of the program was to protect the forests and to fulfill the basic needs of the local people with regard to forest products (Shrestha and Amatya, 2000). After the implementation of the more democratic Forest Act (HMG Nepal, 1993) and Forest Regulation (HMG Nepal, 1995), the handover process is being accelerated.
Because of the high deforestation rate (2.1% annually) during 1964-1978, it was said that “there is no better place to begin examination of deteriorating mountain environment than Nepal” (Gilmour, 1988 cited Eckholm, 1975). About 240 million metric tons of soil was washed out each year from Nepal during the early 1980s (Thapa and Weber cited WRI and IIED, 1987). The frequent and disastrous floods of the Ganges River and its delta in India and Bangladesh have been blamed on deforestation in Nepal (Sofield, 2002). A World Bank report (1978) suggested that if the then rate of deforestation continued, hill areas would be completely deforested by 1993 and the Terai (the relatively flat and low land area in southern Nepal) would face a similar fate by 2003 (Sofield, 2002 cited World Bank, 1978). Instead, the deforestation rate (both forest and shrub) decreased to an annual rate of 0.5 percent during the period of 1979-94 (MFSC, 1999). This is most probably because of the community forestry program (Awasthi et al., 2002; Brown and Shrestha, 2000; Fox, 1993; Gilmore and Nurse, 1991 and MFSC, 2003).
The forecast of the World Bank did not eventuate, although the claim of impending full deforestation created wide interest among the donors and multilateral agencies to assist in the community forestry programs of Nepal (Gilmour, 1988 and Sofield, 2002). The international donor communities have been investing substantial amounts of money to implement the CF policy in Nepal. About 45 percent of the total development budget allocated to the Ministry of Forest and Soil Conservation (MFSC) for the fiscal year 1997/1998 was funded by donors (Chapagai et al., 1999).
3.2.1 The Role of Community Forestry of Nepal in Carbon Sequestration
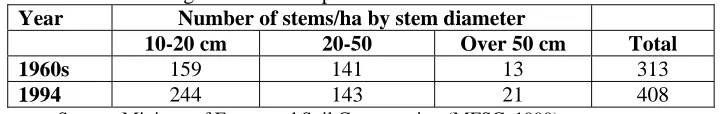
Table 1: Change in forest composition
Year Number of stems/ha by stem diameter
10-20 cm 20-50 Over 50 cm Total
1960s 159 141 13 313
1994 244 143 21 408
Source: Ministry of Forest and Soil Conservation (MFSC, 1999)
Although there was an intensive forest survey in 1960s, the most accurate land use and land cover assessment was made by the Land Resources Mapping Project in 1978, based on aerial photo interpretation (Gilmour, 1988). Thus the land use and land cover data of 1978 and 1994 are more worthy for comparison but for the forest inventory, the 1960 and 1994 reports are more commendable for comparison. To develop the discussion, it is assumed that the number of stems and volume per ha for 1978 are the same as for 1960s, though the figure should be much lower than that as the following discussion concludes. In the hilly areas there was no detectable loss in the total area of forest land between 1964 and 1978 but there was a marked declined in the number of stems (Nield, 1985). During the same period the area of Terai forest declined by 191,000 ha (Sofield, 2003) due to the conversion of forest land to agricultural land.
Comparing land-use data for 1994 and 1978/79, the total forest area decreased from 38 percent of the national land area to 29 percent (5616.8 thousand ha to 4268.8 thousand ha) while shrubland increased to 10.6 percent from 4.7 percent (1559.2 thousand ha from 689.9 thousand ha). On the other hand, the number of stems and mean stem volume increased dramatically during the period 1978-94 (Table 2). Extrapolating from the changes in forest density and volume, the change in sequestered carbon stocks can be estimated, as shown in Table 2. Between 1978 and 1994, the carbon in standing stock in forests increased from 151 megaton to 176.9 megaton with the net increase of 25.9 megaton. Moreover, if we consider the carbon sequestered in under-storey trees of less than 10 cm diameter (which were not counted during inventory) and shrubland, whose area increased by 869.3 thousand ha during the same period (1978-94), the actual amount would be higher than this. Furthermore, if the amount of carbon retention in varieties of harvested products1 and pools from 1978-94 was counted the net sequestration would be higher again.
Micro-level studies in different community forests show that the crown cover is increasing, greenery is replenished and the degraded environment is recuperating. For example, an analysis of the land-use change between 1978 and 1996 in two small watersheds (total area of 12,300 ha) of the Kaski district of Nepal, where more than 400 CF user groups have been formed (CFDP, 2003), revealed that a net increase in forest area of 3.9 percent (484 ha). At the same time the class one (<10% crown cover) area of forest decreased by 484 ha and class 3 (20-40% crown cover) area increased by 391 ha (Awasthi et al., 2002). Similar results were reported from Sindhupalchowk and Kavrepalanchowk districts (Gilmour, 1988), mid-hill area of Gorkha district (Fox, 1993) and Jhiku Khola watershed of Kathamandu district (Brown and Shrestha, 2000).
1 Consumed products: like paper, plywood, wood-based panels, timber etc, and stocked products: 52,549 m3
Table 2: Comparison of carbon sequestration in Nepalese standing forest (except shrubland) Year Forest2
(‘000 ha)a
MSV up to 10 cm diam.
(m3/ha)a
Total MSV (mega m3)
Above ground biomass (dm Megaton)b
Above & below ground biomass)c
Total Carbon (Megaton)d
1978/79 5616.8 85 477.428 238.7 302.0 151.0
1994 4268.8 131 559.213 279.6 353.7 176.9
Change (78-94)
- 1348 + 46 + 81.785 + 40.9 +51.7 + 25.9
MSV: Mean stem volume, dm: dry matter and - sign indicate decreasing and + sign indicates increasing
a Adopted from: MFSC, 1999, MSV for 1978/79 is assumed as that of the 1960s b The MSV (m3/ha) is multiplied by 0.5 to convert into biomass (IPCC, 1996)
c Aboveground biomass is multiplied by 1.265 to get above and belowground biomass (Haripriya, 2000) d The total biomass is multiplied by 0.5 to convert to total carbon (IPCC, 1996)
In contrast, developing countries such as Brazil and Indonesia have very high net carbon emission rates. The continued annual deforestation rate of these two countries alone would equal 80 percent of the emissions reductions targets for Annex I countries of the Kyoto Protocol in its first commitment period (Santilli et al., 2003). Similarly, India, neighboring Nepal, acted as a net source of 12,723 giga gram of carbon during 1993-1994 through the forestry sector (Haripriya, 2003). Nepal, where 42 percent of people are below poverty line, the per capita income is just above $200, the literacy rate is just about 54 percent (CBS, 2002) and which has been placed in 140th position in human development report in 2004, may be the only developing country where the net carbon sequestration rate is positive in the forestry sector. This is a result of the implementation of the community forestry policy in 1978.
3.2.2 Incompatibility of Nepalese Community Forests for CDM Project Activities
When community forestry started in the 1970s, completely degraded forests were handed over to elected local bodies (then, Panchayat Forest and Panchayat Protected Forest). The main management effort was concentrated on the reforestation program, with the support of the Terai Community Forestry Project and the Hill Community Forestry Project, which were sponsored by the World Bank. On the other hand, with protection from fires and grazing, most of the degraded areas regenerated naturally with original plants even dominate planted species. The regenerating materials either came from nearby areas or coppices from the stumps and roots of harvested trees. Realizing the cost effectiveness of the enhanced regeneration, and the importance of indigenous species to the complex farming system and biodiversity value, the Nepalese government changed its reforestation policy in line with the enhanced natural regeneration and protection system in the early 1990s (DoF & DFRS, 2002).
Because of the way in which land use has changed in response to national policy, many of the community forests of Nepal are not eligible for CDM afforestation projects. For the first commitment period (2008-2012), eligible reforestation is that which starts from the year 2000 onwards on those lands that did not contain forest as of 31 December 1989. Since most of the handed over community forests had already qualified as ‘CDM forests’ (>10% crown cover) they are not eligible for CDM projects activities. On the same ground many of the current and planned handing over area will not qualify for CDM projects. Since the Conferences of Parties
2 Forest is defined as the land with a forest cover, i.e. with trees whose crown cover more than 10 percent of the
already denied forest preservation from the eligible CDM project categories, which is the only suitable mechanism in Nepalese context, most of the community forests of Nepal are not eligible for CDM.
However, each Party can select single minimum value of crown cover to be qualified for CDM ‘forest’ provided with strong justification (UNFCCC, 2003). If they select 30 percent crown cover to be a CDM ‘forest’, those communities that increased the crown cover of their forest from 10 to 29 percent will be excluded from the CDM projects benefits. Moreover, Nepal has a great potential in agroforestry system which is eligible for CDM projects. For the agroforestry to be successful the spacing between trees and between rows should be far (5m x 5m) and the crown cover should be low. If 30 percent crown cover is only eligible for CDM ‘forest’, the agroforestry will not be qualified for CDM project activities and Nepal would lose the opportunity of earning incentives through the agroforestry system.
If we strictly consider the 10 percent crown cover to be eligible for CDM ‘forest’ definition, the land which has less than 10 percent crown cover will not be considered as forestland. If people increased the crown cover of that land to a higher percent by applying silvicultural means they will qualify as CDM ‘forests’. Thus, they could be eligible and can claim for CDM benefit for the whole sequestered amount. In fact, the incremental carbon sequestration could be far less than their claimed amount. Hence, if we stuck with the strict forest definition, there is a higher chance of overestimation of the carbon sequestration amount which has a great implication in meeting the main CDM objective of additionality.
The analysis concludes that if community forestry is contributing positively to the carbon sequestration it should not be disqualified for CDM project activities on the basis of absolute value of crown cover. The net positive contribution to the carbon sequestration should only be a deciding factor.
3.2.3 Losses and Gains from Community Forestry of Nepal
Community forestry entered into force in Nepal in 1978 when serious flooding in Bangladesh (downstream) in 1970s focused the worlds’ attention on the rapid depletion and degradation of forests in upstream Nepal (Brown et al., 2002). However, the original documented purpose of the program was to protect the forests and to fulfill the basic needs of the local people with regard to forest products. Thus the community forestry policy, so far, is protection oriented. Although many community forests are established and matured, in many cases thinning, pruning and harvesting of mature trees has been delayed. This has limited the potential tangible benefits of community forests as it is said that the “…cow’s producing more milk than being milked” (Shrestha and Amatya, 2000). According to the World Bank report (Hill, 1999), the cost of not having active forest management and silvicultural operation in Nepal is NRs 560 (US$ 80.00) per household per year. An unpublished report of the World Bank (1994) said that the economic benefit of community forests would increase fourfold if there was more active management. The report further said that community forests cost NRs 3.1 billion per year for Nepal in foregone output.
system has reduced the total tangible benefits by not utilizing the full potential production possibilities and on the other hand it is added costs to some users. It has, however, increased global environmental services like carbon sequestration and biodiversity conservation, as well as local and regional services such as soil protection and flood control. Therefore, community forestry of Nepal is benefiting the global communities and regional communities while adding costs to poor people.
4. Reasons for the Inclusion of Enhanced Regeneration Activities under the CDM
This Section discusses some important reasons why enhanced natural regeneration and forest preservation activities should be considered under the CDM project activities.
4.1 Cost Effectiveness
The first reason is that enhanced natural regeneration is a cost effective means of sequestering carbon. Although the modalities and procedures for afforestation and reforestation projects activities is approved in COP9 (UNFCCC, 2003), no CDM project activity has yet been registered by the Executive Board (EB). However, there are some carbon sequestration projects that are being implemented as Activities Implemented Jointly (AIJ) Pilot Phase Projects and are supported by USA, Norway, and Netherlands. Under AIJ project activities, 27 Land Use, Land-Use Change and Forestry (LULUCF) greenhouse gas mitigation projects were implemented in 19 countries covering about 3.5 million ha of land (IPCC, 2000). Although there are some complications in comparison of costs of these projects there is clear distinction among the different categories of projects. The costs of forest preservation and enhanced natural regeneration projects are much lower than the cost of reforestation projects (IPCC, 2000). Proffenberger (1996) found that the forest regeneration costs are only five percent of plantation cost. Similarly, Xu et al, (2001) reported that the costs (includes initial, operations, maintenance and monitoring costs) of regeneration forests are 8.7, 7.6 and 9 percent respectively, of their short rotation plantation forests of Northeast, Southeast and Southwest China. The meta-regression analysis of 55 studies showed that the costs of creating carbon offsets using forest conservation are US$ 12.7-70.99/t CO2 whereas in tree planting and agroforestry activities the costs increased by more than 200 percent (Kooton et al., 2004).
Some people claim that the transaction costs (cost of information, establishing additionality, registration, verification and certification) are higher in small scale projects such as community based forest management systems (CBFMS), but simplified rules and regulations are being developed to address such issues. Because the CBFMS are national programs, governments can change the guidelines in line with CDM objectives and can offer incentives on its compliance. For this, there is no need of extra efforts as current governmental and non-governmental organizations can facilitate at the different levels. It reduces the transaction and implementation costs and increases the chances of success.
4.2 Compatibility with the Convention on Biological Diversity
It is stipulated that the CDM projects should be compatible with multilateral environmental agreements such as the Convention on Biological Diversity (CBD). During the meeting of Conference of Parties, many groups opposed the inclusion of forestry in the CDM because of the risk of encouraging monoculture species plantations. For example, in 1990, eucalyptus alone accounted for 23 percent of the total planted area in the tropical regions (FAO, 1997). The Asia-Pacific region, which is a key player in plantation, accounting for 61 percent (113.2 Mha) of the world’s plantation forests, has six tree species comprising 43 percent (Pinus, 13.7%, Eucalyptus, 9.8%, Hevea 8%, Acacia, 7% and Teak, 4.8% ) of the total planted area (Brown and Durst, 2003). A limited number of species may reduce biodiversity, both directly and indirectly.
The intermediate level of productive land has more floral and small faunal diversity than highly productive land, and the intermediate level of disturbed forest has more diversity than highly disturbed and undisturbed (late successional) forest (Hutson and Marland, 2003). In developing countries, forests usually are on low productive land and communities are causing intermediate level of disturbance so that natural regenerations are being promoted. Therefore, enhanced natural regeneration types of CBFMS may result in a relatively high level of diversity, at least far greater than clear felled and planted area. Hence, communities are providing further general biodiversity benefits for free.
In other jurisdictions, land managers receive payments for contributions to biodiversity, for example, the Bush Tender initiative in Victoria, Australia and the Environmental Service Scheme in New South Wales, Australia (Cacho et al., 2003). The Costa Rican government, by establishing the National Forestry Finance Fund in 1991, has been directly paying the smallholder owners of natural forest and forest plantation for the environmental services (such as carbon sequestration, water protection for drinking and hydropower generation, protection of biodiversity, preservation of scenic beauty for tourism) (Zuniga, 2003). Landholders in critical watershed areas are paid between US$ 30 and 50 per ha per yr and similar levels of payment are planned in Mexico (Scherr and White, 2004). In New Zealand, an Emission-Biodiversity Exchange Project for the 21st Century (EBEX21) was implemented in 2001 to encourage indigenous forest regeneration on privately owned land and, as such, provides incentives for involvement in an integration of carbon sink biodiversity goal (Carswell et al., 2003). A recent global survey found that 72 cases of biodiversity markets in 33 countries, of these 70% markets were international (Scherr and White, 2004).
4.3 Alignment with CDM Objectives
forest management system which has been enhancing regeneration and contributing for net carbon sink definitely meets the objective of ‘additionality’.
Since there are no any legally defined criteria, the host countries are accountable for defining their sustainable development (SD) criteria under the broad universally accepted framework of social, economical and environmental categories. In particular, social criteria covers poverty alleviation and equity, economic criteria covers total financial benefit to local entities, and environmental criteria covers reduction of greenhouse gas emission. Although the three criteria of SD are nominally treated at an equal level, the ecological criteria dominate over the others for the forestry sector. The forestlands are generally less productive in developing countries, which is not suitable for fast growing species which needs huge amount of nutrients and water. Especially the fast growing broadleaf (high surface area) evergreen trees are less efficient in dry areas as they lose water by duel mechanism of transpiration and evaporation throughout the year. So from the users’ perspective, fast growing species are ecologically unsuitable. Hence, enhanced natural regeneration and forest preservation is the best alternative.
Most of the developing countries are agriculture-based and people often have to depend upon the single piece of forest land for their multiple needs, such as fodder, fuelwood, timber, thatched material, agricultural implements, water sources and several other varieties of non-timber forest products. Because of the capability of providing these multiple needs, new forestry (combination of timber and non-timber benefits at the stand level) is more socially desirable than specialized (stand-by-stand) management systems. Investigators claim that under the limited efforts, specialized management is economically more efficient than new forestry systems (Boscolo and Vincent, 2003; Ficklin et al., 1996 and Vincent and Brinkley, 1993). However, in some cases, soil protection and water sources are the major concern along with other tangible benefits, where people do not accept the clear felling and plantation system. Moreover, if we consider all tangible and intangible benefits of forests under the local ecological, topographical and livelihood setting, new forestry would outweigh the specialized forestry. Most probably, this may be the reason why forest users of Nepal prefer multiple use forests to plantation forest. Although it is yet to be proved, the new forestry system seems the best alternative socially, economically and environmentally in the contexts of community forestry. It is hoped that the work, of which this review is part, will reveal more about the optimal management system for community forestry in Nepal.
4.4 Reduction in Leakages
heavily using the community forests for their daily needs and earning money. Alternatively people may change to the eligible, easy-going approach of plantation on their private land under the CDM project activities. Thus, to address the leakage problem and to create a more secure environment of carbon sequestration in their community forest, enhanced regeneration and forest preservation should be eligible activities under CDM project. Otherwise, highly valuable indigenous species of community forests will decrease gradually with the cost of very few fast growing exotic species on their private land.
4.5 Social Justice and Equity
Countries that deforest and degrade their forest before 1990 and are now planting, are eligible for CDM benefits under the reforestation projects. More interestingly, those countries that have been very responsible with the global environment and do their best to maintain net carbon sink may not be eligible for CDM benefit simply because the land where they have been practicing forestry activities are already qualified as CDM ‘forest’ definition (>10% crown cover). Moreover, the enhanced natural regeneration has been achieving both objectives of CDM namely sustainability and additionality and at the same time they have been complying with the Convention on Biological Diversity by conserving native species.
In the national and international levels, there are several specific laws for specific purposes. In formulating the specific laws, we should always respect the social justice and equity. However, it could be violated by applying a strict CDM forest definition. Therefore, on the ground of social justice and equity, those nations which are responsible to Kyoto target and contributing positively for the net carbon sequestration should be internalizing their contribution.
5 Conclusions
This study concludes that if enhanced natural regeneration and forest preservation activities address the main objective of additionality of CDM, and if it is the only socially acceptable and economically viable option and relatively compatible with Convention on Biological Diversity, then it would be eligible under the CDM project activities. If all conditions are satisfied, the CDM forest definition should not be a barrier for the eligibility of such activities. Otherwise, social justice and inter-national equity could be violated and leakage problem could result.
Acknowledgements
References:
Activities Implemented Jointly (AIJ) 2002, Activities Implemented Jointly under the Pilot Phase, http://maindb.unfccc.int/aij, Viewed 12/06/04.
Aukland, L, Moura, CP, Bass, S & Carr, R 2002, Laying the Foundations for Clean Development:
Preparing the Land Use Sector. A Quick Guide to the Clean Development Mechanism, IIED, London.
Awasthi, KD, Sitaula, BK, Singh, BR & Bajacharaya, RM 2002, 'Land-Use Change in Two Nepalese Watersheds: GIS and Geomorphometric Analysis', land Degradation & Development, vol. 13, p. 495– 513.
Bartlett, AG & Malla, YB 1992, 'Local forest management and forest policy in Nepal', Journal of
World Forest Resource and Management, vol. 6, pp. 99-116.
Boscolo, M & Vincent, JR 2003, 'Nonconvexities in the Production of Timber, Biodiversity, and Carbon Sequestration', Journal of Environmental Economics and Management, vol. 46, pp. 251-68. Brown, S & Shrestha, B 2000, 'Market Driven Land-use Dynamics in the Middle Mountains of Nepal',
Journal of Environmental Management, vol. 59, pp. 217-25.
Brown, D, Malla, Y, Schreckenberg, K & Springate-Baginski, O 2002, 'From Supervising 'Subjects to Supporting Citizens': Recent Developments in Community Forestry in Asia and Africa', Natural
Resource Perspectives, ODI, London, vol. 75, p. 4.
Brown, C & Durst, PB 2003, State of the Forest in Asia and Pacific, Asia Pacific Forestry Commission, RAP Publication 2003/22. FAO Regional Office for Asia and the Pacific, Bangkok, Thailand.
Cacho, OJ, Hean, RL & Wise, RM 2003, 'Carbon Accounting Methods and Reforestation Incentives',
the Australian Journal of Agricultural and Resource Economics, vol. 47, no. 2, pp. 153-79.
Carswell, F, Frame, B, Matin, V & Turney, I 2003, 'Exchanging Emissions for Biodiversity: In Pursuit of an Integrated Solution in New Zealand', Ecological Management & Restoration, vol. 4, no. 2, pp. 85-93.
Central Bureau of Statistics 2002, Statistical Year Book of Nepal, HMGN, National Planning Commission Secretariat, Kathmandu, Nepal.
Chapagai, DP, Kanel, KR & Regmi, DC 1999, Current Policy and Legal Context of the Forestry
Sector with Reference to the Community Forestry Program in Nepal, A working over view, Nepal-UK
Community Forestry Project, Kathmandu, Nepal.
Community Forestry Development Program 2003, Database in Community Forestry in Nepal, Department of Forest, Kathmandu, Nepal.
Department of Forest and Department of Research and Forest Survey (DoF and DRFS) 2002, National Forest Policy Review (An Assessment of the Effectiveness and Efficiency of the Forest Policy of Nepal),
EC-FAO Partnership Project, GCP/RAS/173/EC, Department of Forests and Department of Forest
Research and Survey, Kathmandu, Nepal.
Dev, OP, Yadav, NP, Springate-Baginski, O & Soussan, J 2003, 'Impact of Community Forestry on Livelihoods in the Middle Hills of Nepal', Journal of Forest and Livelihood, vol. 3, no. 1, pp. 64-77. FAO 1992, Community Forestry, Ten Years in Review, Food and Agricultural Organization of the United Nations, Rome.
FAO 1997, Recent Trends and Current Status of Forest Resources, http://www.fao.org/docrep/W4345E/w4345e03.htm, viewed on 17/06/04.
FAO 1999, State of the World's Forest: The Status of Forest Resources.
FAO 2001, Comparative Framework and Options for Harmonization of Definitions, http://fao.org/DOCREP/005, Viewed on 11/05/04.
Ficklin, RL, Dunn, EG & Dwyer, JP 1996, 'Ecosystem Management on Public Lands: An Application of Optimal Externality to Timber Production', Journal of Environmental Management, vol. 46, pp. 395-402.
Fox, J 1993, 'Forest Resources in a Nepali Village in 1980 and 1990: The Positive Influence of Population Growth', Mountain Research and Development, vol. 13, pp. 89-98.
Gilmor, DA 1988, 'Not Seeing the Trees for the Forest: A Re-Appraisal of the Deforestation Crisis in Two Hill Districts of Nepal', Mountain Research and Development, vol. 8, no. 4, pp. 343-50.
Gilmor, DA & Nurse MC 1991, 'Farmers Initiatives in Increasing the Tree Cover in Central Nepal',
Mountain Research and Development, vol. 11, pp. 2329-37.
Government of India 2002, Joint Forest Management: A Decade of Partnership, Ministry of Environment and Forests, New Delhi, India.
Haripriya, GS 2000, 'Estimates of Biomass in Indian Forests', Biomass and Bioenergy, vol. 19, pp. 245-58.
Haripriya, GS 2001, Carbon Budget of Indian Forest (Revised Version Submitted to Climate Change
on 20.6.2001), Andhra Pradesh, India, Viewed 23/1/2004
<http://www.beijer.kva.se/publications/pdf-archive/Disc143.pdf>.
Haripriya, GS 2003, 'Carbon Budget of the Indian Forest Ecosystem', Climate Change, vol. 56, pp. 291-319.
Hill, I 1999, Forest Management in Nepal: Economic and Ecology, World Bank Technical Paper No. 445, World Bank, Washington DC.
HMG Nepal 1988, Main Report, Master Plan for the Forestry Sector in Nepal, His Majesty's Government of Nepal, Ministry of Forests and Soil Conservation, Kathmandu, Nepal.
HMG Nepal 1993, Forest Act, Ministry of Forest and Soil Conservation, Kathmandu, Nepal. HMG Nepal 1995, Forest Regulation, Ministry of Forest and Soil Conservation, Nepal.
Hutson, MA & Marland, G 2003, 'Carbon Management and Biodiversity', Journal of Environmental
Management, vol. 67, pp. 77-86.
Intergovernmental Panel on Climate Change (IPCC) 1996, 'Chapter 5, Land-Use Change & Forestry in Revised 1996 IPCC Guidelines for National GHG Inventories: Reference Manual'.
IPCC 2000, 'Land use, Land-use Change and Forestry', in RT Watson, IR Noble, B Bolin, NH Ravindranath, DJ Verardo & DJ Dokken (eds), A Special Report of the Intergovernmental Panel on
Climate Change, Cambridge University Press, Cambridge, UK.
Jodha, NS 1990, 'Rural Common Property Resources: Contributions and Crisis.' Economic and
Political Weekly, 21:A65-A78.
Kellert, SR, Mehta, JN, Ebbin, SA & Lichtenfeed, LL 2000, 'Community Natural Resource Management: Promise, Rhetoric, and Reality', Society and Natural Resources, vol. 13, pp. 705-15. Kirschbaum, MUF 2003, 'To Sink or Burn? A Discussion of the Potential Contributions of Forests to Greenhouse Gas Balances Through Storing Carbon or Providing Biofuels', Biomass and Bioenergy, vol. 24, pp. 297-310.
Kooten, G.C.V., Eagle, A.J., Manley, J., and Smolak, T. 2004 How costly are carbon offsets? A meta-analysis of carbon forest sinks, Environmental Science & Policy 7 (4): 239-251
Malla, YB, Hari, RN & Branney, PJ 2003, 'Why aren't Poor People Benefiting More from Community Forestry', Journal of Forest and Livelihood, vol. 3, no. 1, pp. 78-92.
Ministry of Forest and Soil Conservation (MFSC) 1988, Master Plan for Forestry Sector, Kathmandu, Nepal.
MFSC 1999, Forest Resources of Nepal, Department of Forest Research and Survey, Ministry of Forest and Soil Conservation, Kathmandu, Nepal.
MFSC 2003, National Report to the Third Session of the United Nations Forum on Forests, Ministry of Forest and Soil Conservation, Singhdurbar, Kathmandu, Nepal.
Nield, RS 1985, Fuelwood and Fodder-Problems and Policy, Working Paper for the Water and Energy Commission Secretariat, Kathmandu, Nepal.
Potters, J, Reeb, D & Crollius, MR 2003, 'The Process of Participatory Forestry in Africa', paper presented to Second International Workshop on Participatory Forestry in Africa.
Proffenberger, M 1996, Communities and Forest Management: A Report of the IUCN Working Group on Community Involvement in Forest Management, with Recommendations to the Intergovernmental
Panel on Forests, the World Conservation Union, Cambridge, UK.
Richards, KR & Stokes, C 2004, 'A Review of Forest Carbon Sequestration Cost Studies: A Dozen Years of Research', Climate Change, vol. 63, pp. 1-48.
Santilli, M, Moutinho, P, Schwartzman, S, Nepstad, D, Curran, L & Nobre, C 2003, Tropical
Scherr, S & White A 2004 ‘For services rendered’, Tropical Forest Update: A Newsletter from the ITTO to Promote the Conservation and Sustainable Development of Tropical Forests, vol. 14, number 2, pp 11-14
Shrestha, K & Amatya, D 2000, 'Protection Versus Active Management of Community Forests: In Community Forestry in Nepal: Proceeding of the Workshop on Community Based Forest Resource Management, Nov 20-22, 2000, pp 3-17, Joint Technical Review Committee, Kathmandu, Nepal'. Smith, J & Scherr, SJ 2002, Forest Carbon and Local Livelihoods: Assessment of Opportunities and
Policy Recommendations, CIFOR Occasional Paper No 37, Indonesia.
Sofield, THB 2002, 'Forest Tourism and Recreation in Nepal', in F Xavier & T John (eds), Forest
Tourism and Recreation: Case Studies in Environmental Management, CABI Publishing, High
Wycombe, UK.
Thapa, GB & Weber, KE?, 'Population and Environment in the Hills of Nepal', Asia-Pacific
Population Journal, vol. 4, no. 2, pp. 41-71.
UNEP 2003, CDM Information and Guide Book, UNEP Riso Centre, Denmark.
UNFCCC 1997, The Kyoto Protocol to the United Nations Framework Convention on Climate
Change, UNEP/WMO.
UNFCCC 1997, Kyoto Protocol, UNFCCC, Information Unit for Conventions, UNEP, Geneva.
UNFCCC 2003, Decision-/CP.9, Modalities and Procedures for Afforestation and Reforestation
Project Activities under the CDM in the First Commitment period of Kyoto Protocol.
UNFCCC 2004, List of Signatories & Ratification of the Convention.
UNFCCC 2004, United Nations Framework Convention on Climate Change, Clean Development
Mechanism, http://cdm.unfccc.int/, Viewed on 15/5/04.
United Nations Forum on Forest 2003, Economic Aspects of Forests. Report of the Secretary-General, E/CN. 18/2003/7, United Nations Economic and Social Council, Geneva.
Vincent, JR & Binkley, CS 1993, 'Efficient Multiple-Use Forestry May Require Land-Use Specialization', Land Economics, vol. 69, no. 4, pp. 37--376.
White, A & Martin, A 2002, Who Owns the World's Forests? Forest Tenure and Public Forests in
Transition, Forest Trend, Washington DC.
Wily, LA 2003, 'Participatory Forest Management in Africa: An Overview of progress and Issues', paper presented to Second International Workshop on Participatory Forestry in Africa.
Xu, D., Zhang XQ., and Zuomin (2001), Mitigation Potential for Carbon Sequestration Through Forestry Activities in Southern and Eastern China, Mitigation and Adaptation Strategies for Global Change 6, 313-232, 2001