The Mechatronic Bakery
Bradley J Schultz, John Billingsley
Faculty of Engineering and Surveying, University of Southern
Queensland
Thomas Adamczak
BRI Australia Ltd
,
\Abstract
When integrated data-gathering and closed-loop control pass a certain
level, an industrial manufacturing process can be regarded as a
mechatronic system. This paper takes the example of a bakery and from
practical experience explores new objectives and outcomes which are
made possible by an integrated approach.
Keywords:
Bread Baking, Oven Control, Food Processing.
1 Introduction
A bakery is not the most obvious example of a mechatronic system. In its usual form a bread bakery is simply a series of processes that are unrelated in terms of control. Bakery operators take care of their section of production and use predetermined empirical settings for the process. Adding instrumentation to each process and deducing advanced control algorithms will improve operation. However, each process still operates on its own, with no information from other parts of the bakery.
If information from every process is combined into one main computing centre, a step towards a mechatronic system is achieved. The information must then be processed in an intelligent way that integrates effects from all baking processes. Once advanced control strategies are implemented using the processed data, all the requirements to create a mechatronic system are satisfied.
1.1 Internet Possibilities
A bakery is an example of 'Just in Time' manufacturing. Loaves of bread need to be delivered to the point of sale as soon as possible after baking. With a ful1y automated, Internet-connected bakery, retailers could dynamical1y order bread over the Internet. The production schedule would then be optimised to satisfy al1 order requirements in the most efficient means. This could then be extended to automatic ordering of ingredients according to future production schedules.
Ingredients
~
Mixing~
Dividing~
RoundingI-l
Intermediate~
!Moulding~
Panning~
ProofProof
f-l
Baking~
De-~
Cooling~
Slicing~
Packaging [image:2.851.33.377.138.312.2]Panning
Fig 1. Rapid Dough Method of Baking Bread
2 Baking Bread
A large bread bakery may produce 30 to 60 thousand loaves of bread per day. These may include up to 30 different varieties, each requiring different ingredients and baking conditions. Total production time is in the order of 3 hours.
Large bakeries general\y use the Rapid Dough method of baking bread. This method is shown in Figure 1. There are 13 separate processes that the bread must pass through. Bread baking involves manipulating a living organism - the yeast in the dough. If the cultures are treated incorrectly in any of these processes, there may be adverse effects on the resulting product.
Producing bread in large-scale bakeries using the Rapid Dough method is not a simple, straightforward task. Assuming the dough has been mixed properly and suitable ingredients have been used, there is still a plethora of other problems that may occur.
Control systems found in large bakeries general1y involve simple direct control of processes. Set points for products are not necessarily optimised and few other factors are taken into account.
3 Data Gathering
Data that are relatively straightforward to gather include initial and final weights of loaves, temperature and humidity of processes, product counts at various points
(
and operation of processes (eg oven shelf loading or the movement of shelves in the cooler). Loaf height may be also measured fairly easily.
Image analysis may be used to measure several characteristics such as loaf colour, shape, volume and the extent to which they are dappled. Another possibility is to examine bread quality by viewing the interior of the loaf with a camera directly after slicing. It should be possible to determine the size and number of 'bubbles' in the dough, resulting in the loaf quality being known. Various approaches to loaf image analysis are discussed in [1], [2], [3], [4] and [5].
4 Processing Data
Masses of data may be col1ected and stored, however, something intelligent must be done with the data to use it to the bakery's advantage. The baking process takes around three hours to complete from mixing to packaging. An average product run may be from between five minutes to an hour. This means that it is general\y impossible to feed loaf quality data directly back to processes such as the oven, prover or mixer. Data from al\ processesmust be stored and processed to calculate improved approaches for baking the next day.
With al1 the instrumentation involved, there are still many advantages to processing the data in real time. Such possibilities include control1ing a section of the bakery according to the variety of bread and the amount of loaves inside.
1000
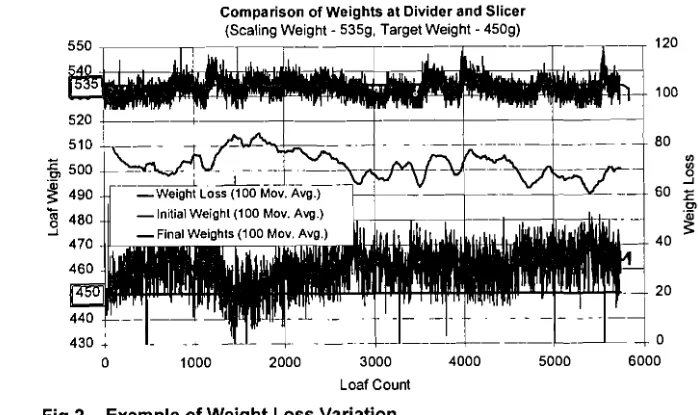
Comparison of Weights at Divider and Slicer (Scaling Weight - 535g. Target Weight - 450g)
2000 3000
Loaf Count
4000
Fig 2. Example of Weight Loss Variation
5 Loaf Quality and Customer Satisfaction
5000
120
100
80
If)
~
...J
60 :E
0>
~
40
20
0 6000
[image:2.851.449.798.301.509.2]5.1 Weight Variation
Figure 2 shows an example of the weight variation within a single product. As the plot demonstrates, to ensure loaves satisfy minimum legal weight requirements, operators are directed to keep the final weight above the target value. For the product shown, an estimated 50 kilograms of dough was 'given' away (representing about 1.5% of the total dough). A bakery stands to save hundreds of thousands of dollars a year if production is controlled in a way that allows dough use to be minimised.
5.2 Consumer Acceptability
In addition to weight constraints, correlation of the final characteristics of a product with consumer acceptability should be performed. Does every consumer want a loaf of bread that is exactly the same shape, colour and texture as the next one? Or (as is more likely), each customer may have an individual preference pertaining to a particular type of loaf.
The process of determining the qualities of the 'ultimate' loaf is an exercise involving both marketing and engineering. Objective measurements taken from the loaves need to be translated into a set of states to describe the product (eg crispness, firmness, and moisture content). These then need to be related to subjective measurements obtained from consumers (eg taste, texture and appearance ).
To achieve this, a consumer survey program would be commenced. This would involve measuring a quality (or qualities) of a loaf as it is being packaged. For example, image processing may be used to produce a coefficient that indicates the brownness of a loaf. This coefficient would be printed on the seal of the loaf. The packaging would have a survey form on it that asks the consumer to give their opinions on the loaf in several categories (eg colour, texture and taste). The consumer would be required to include the seal from the loaf when returning the survey. The consumer data gathered could then be correlated with actual quantifiable loaf qualities.
Consumers generally will not return survey forms just to be helpful however. Some sort of reward must be offered to entice the return of surveys. For example, for every 5 forms completed and returned, a free soft toy or loaf of bread could be given to that consumer.
5.3 Quality Variation
In the end, the aim of controlling a bakery may not be to produce a product where every single loaf is identical, meeting exacting standards. Variation is healthy - to a point. Of course certain considerations must be met - such as the weight of the loaves. Legally, loaves must satisfy what their label claims their weight is. But even this may be negotiable - underweight loaves, instead of being discarded may be labelled as underweight and offered to the consumer at a suitably reduced price. This concept may also be extended to labelling other out-of-specification loaves with their characteristics (eg extra crunchy, extra chewy etc.). Marketing
techniques (may then be used to 'sell' their particular features. This means that consumers will still purchase the product and be satisfied, which, after all, is the aim at the end of the day.
6 The Oven
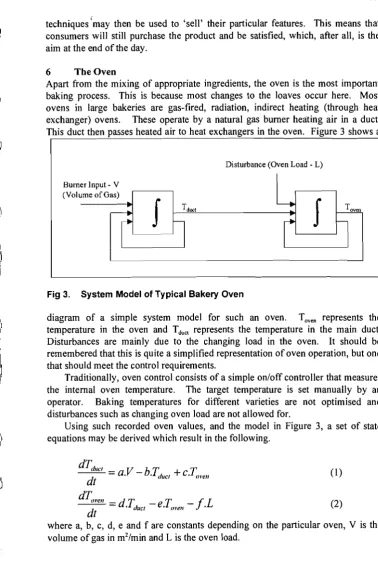
Apart from the mixing of appropriate ingredients, the oven is the most important baking process. This is because most changes to the loaves occur here. Most ovens in large bakeries are gas-fired, radiation, indirect heating (through heat exchanger) ovens. These operate by a natural gas burner hea:ting air in a duct. This duct then passes heated air to heat exchangers in the oven. Figure 3 shows a
Burner Input - V (Volume of Gas)
f
Disturbance (Oven Load - L)
[image:3.848.420.799.34.608.2]J
Fig 3. System Model of Typical Bakery Oven
Toven
diagram of a simple system model for such an oven. Toven represents the temperature in the oven and Tduct represents the temperature in the main duct.
Disturbances are mainly due to the changing load in the oven. It should be remembered that this is quite a simplified representation of oven operation, but one that should meet the control requirements.
Traditionally, oven control consists of a simple on/off controller that measures the internal oven temperature. The target temperature is set manually by an operator. Baking temperatures for different varieties are not optimised and disturbances such as changing oven load are not allowed for.
Using such recorded oven values, and the model in Figure 3, a set of state equations may be derived which result in the following.
dT
dllcl=
aV - b T
T
• • duel
+
c.
ovelldt
(1)
dT
ovelldT
T
IL
--- = .
duel-e.
(well - •dt
(2)
[image:3.848.461.802.178.317.2]Instead of the current method of controlling oven temperature, an improved approach would be to control the duct temperature (TducJ according to a demanded value of oven temperature (Toven). The actual position that the measurement is taken from should be optimised as well.
Feed-forward and feedback control are two apparent methods used to improve oven control. These methods involve not only maintaining a target temperature, but also calculating what the value of the target should be.
Problems with traditional feedback methods of control arise due to several factors. Many varieties only run for a short time - around ten minutes. Baking time is around 30 minutes, so if product quality is measured at the end of baking, it is too late to feedback data that may improve oven conditions. In practice, feedback times can be further increased because the product generally undergoes an hour of cooling before qualities may be measured.
7 Product Tracking
Rather than directly feeding data back into the oven, quality data from one day's production may be recorded and used the following day. Values may then be 'hill climbed' to their optimum value. In order to predict improved values, data from all processes must be recorded and analysed.
A problem that arises with customising control for each variety is the difficulty in determining the location they have reached within the process. Different varieties may look very similar, yet require different production conditions. Furthermore, to effectively control the oven according to the load of product inside it, the weight of product inside the oven must be known. It is relatively straightforward to count tins entering and exiting the oven and to estimate the load from this data, but the actual weight of loaves inside may vary quite extensively even with the same amount of tins inside.
Product tracking is useful for several other reasons as well. Firstly, the bakery operators would like to have an idea when a variety is approaching the end of production so that bags for the loaves may be changed (a procedure which should be automated in the future). Having loaf counts for each variety at various points allows loaf losses in each process to be determined. Useful information produced includes weight loss of loaves (due to moisture loss in cooking) and time/temperature profiles.
Products are passed between many different conveyors, are in and out of tins and are subjected to various non-deterministic events such as conveyor splits and buffers. This means it is impossible to track them using any simple means such as barcodes on tins.
The most potential for tracking products seems to be given by following loaf counts, the gaps in production and the operation of mechanical processes (eg oven shelf movements). By automatically analysing such data, the times that loaves were at various points in the system may be determined.
Feed-forward control may then be applied to the oven. Certain specifics about loaves such as their weights are known. This data may be fed forward to prepare the oven (or other process). For example, currently, if the oven's load decreases,
the tempe;ature will increase noticeably due to the decreased thermal load. Predicting the load in the oven and altering burner operation in preparation for this load will reduce the chance of products either side of the gap being over-cooked.
8 Temperature History Customizing
Controlling the oven so that its temperature is steady and correct is one challenge, however, a steady temperature may not be the ideal profile for a particular variety of bread. A steady temperature may not even be possible if another variety requiring different oven conditions enters directly behind. , Tailoring the oven's temperature so as to customize a product's temperature profile is another avenue to
be pursued.
The possibility of using a higher temperature later in the baking process in a standard oven is presented in [6]. Difficulties occur in commercial ovens since the bread is on a conveyor. A change in temperature in the oven will change the temperature history of loaves in different ways depending on their position. This may be overcome to an extent by introducing separately controlled zones in the
oven.
9 Oven Shelf Variation
Variation in loaf quality occurs in three different ways: variation across the oven shelf, variation within a production run and variation from day to day. Variation across the shelf is more of an oven design issue, but its effects on the production run need to be considered. Previously, to determine the oven shelf profile, manual weighing of loaves before and after baking has been performed. However, to produce a reliable profile that is unrelated to normal variations in loaf weight, this would have to be performed hundreds of times over - an arduous task.
A voiding manual measurements should be possible by utilising the scales that weigh the loaves at the beginning and end of production. However, as discussed in the 'Product Tracking' section, it is extremely difficult, if not, impossible to work out the individual weight loss of a loaf across the whole of production.
A novel approach that may be taken is to 'emboss' a pattern on the end of a tin. This pattern would be transferred to the loaf during baking. Using a simple image analysis technique at the end of production would allow the loaf to be recognised and the weight recorded.
Using two of these 'marked' tins (each marked differently) and sending them through the oven on the same shelf (or nearly the same shelf) would allow the weight loss of at least two of the loaves on the shelf to be reliably calculated. The relative weight losses could then be determined. Over time, as the two marked tins enter the oven at different relative positions, a profile of the weight loss (and corresponding quality) across a shelf would be developed.
It would be desirable to have a weight loss profile that is level across the oven shelf. Once the current profile is known, oven modelling techniques such as those discussed in [7] may be used to determine causes and possible remedies to the
10 Conclusion
As has been shown here, when a commercial bread bakery is regarded as a mechatronic system, the possibilities for control and automation are almost endless. There is the potential to save hundreds of thousands of dollars per year in lowered divider weights and reduced product rejection. It may be impossible to completely eliminate product variation. However, if the variation can be correlated with consumer wishes, it is actually to the bakery's benefit.
Acknowledgments
The authors would like to acknowledge the support from CRC Wheat Research.
References
1. Chung, O.K., Application of Machine Vision to Pup Loaf Evaluation.
Proceedings of SPIE - The International Society for Optical Engineering, 1996. 2907: p. 241-252.
2. Coles, G.D. and 1. Wang. Objective Determination of Bread Crumb Visual Texture by Image Analysis. in International wheat quality conference. 1997.
Manhattan, KS: Grain Industry Alliance.
3. Kim, K.M. and 1.K. Chun, Video image analysis of bread during baking.
ENGINEERING AND FOOD AT ICEF, 1997: p. 65-67.
4. Sapirstein, H.D., Quality Control in Commercial Baking: Machine Vision Inspection of Crumb Grain in Bread and Cake Products. ASAE PUBLICATION,
1995: p. 23-33.
5. Zayas, l.Y. and O.K. Chung. Digital Imagingfor Bread Assessment. in International wheat quality conference. 1997. Manhattan, KS: Grain Industry Alliance; 1997.
6. Kim, S. and S.I. Cho, Neural network modeling andfuzzy control simulation for bread-bakingproce. Transactions of the ASAE, 1997.40(3): p. 671-676.