COMPARISON OF A DGPS SYSTEM AND CONVENTIONAL
GUIDANCE FOR SPRAYING APPLICATIONS.
Kevin McDougall, Peter Gibbings and Ivan Wolski Faculty of Engineering and Surveying
University of Southern Queensland Toowoomba, Q, 4350.
Tel: 617 4631 2546 Fax: 617 4631 2526 Email: [email protected] Abstract
A recent project undertaken by the University of Southern Queensland in association with Trimble Navigation Australia assessed and compared the accuracy of a DGPS based guidance system with a conventional guidance system for the application of agri-chemicals. The system being tested comprised a Trimble AgGPS 132 configured to allow drivers to follow a light bar of LED’s to enable them to accurately follow a series of parallel tracks.
A series of tests were carried out at seven different sites using a variety of experienced and inexperienced operators. Data was collected in order to compare the GPS guidance against the conventional system of foam marking. Processing of the data required the generation of parallel swaths that replicated the coverage of the spraying rig. This was achieved through a process of buffering of the data in the geographic information system (GIS), ArcView. By generating these polygons for each successive run, the areas of missed spray (skip), and double spray (overlap) could be identified. Through a process of GIS overlays the resulting areas could be readily identified.
The results of the project indicate that the particular GPS guidance system was of comparable accuracy to the conventional guidance by foam marking under ideal conditions. The results also indicated that GPS guidance is superior to conventional guidance where conditions for foam marking, eg wind and crop height are not optimal. The study found that both GPS and conventional guidance operators had a tendency to overspray their runs to ensure that they did not miss any areas.
Background
In 1997, Trimble released the AgGPS 132, a sub-metre differential GPS sensor. In early 1998, Trimble released a Parallel Swathing Option (PSO) for the AgGPS 132. The PSO is marketed as an add-on option to the AgGPS 132 and consists of a light bar that is connected to the AgGPS 132. This enables guidance functionality to be displayed to the user through Light Emitting Diodes (LEDs) on the light bar. Various patterns such as parallel straight lines, parallel curved lines, skip and headland patterns are available for the user to select and follow.
Project Objectives
The objective of the research project was to assess the actual in-field accuracy of the AgGPS 132 under a variety of agricultural equipment, operator and environmental conditions. The research also aimed to quantify the actual in-field accuracy of conventional guidance systems so that comparisons between the systems could be drawn.
The objectives were to:
• Quantify the guidance accuracy normally achieved using conventional guidance techniques such as foam marking.
• Quantify the actual guidance accuracy achievable in the field using the AgGPS 132 PSO technology.
• Carry out an in depth analysis of the data including differences between absolute and relative accuracy of the system.
• Compare the accuracy of traditional guidance methods with the AgGPS 132 system.
To achieve these objectives, a comprehensive testing program of both DGPS and conventional farm guidance systems was undertaken to evaluate the actual in-field accuracies.
Overview of Testing of Guidance Systems
Investigation into research completed on the accuracy assessment of precision farming systems reveals that a wide range of testing has been undertaken. The majority of the research appears to have focussed on specific applications with very few definitive results being reported on the accuracy of GPS assisted guidance systems.
A number of techniques have been developed and used for the guidance of machinery for broad-acre farming including:
• Dead reckoning techniques • Foam marking
• Differentially corrected GPS (DGPS)
• High precision real-time kinematic GPS (RTK)
Dead Reckoning
Foam Marking
Foam marking guidance relies on the dropping of coloured foam “blobs” at the end of spray booms which are then used to assist in aligning the end of the boom to the next spray run. This technique is simple and works well in good spraying conditions, ie. little or no wind and clear cropping. The system relies also on the skill of the operator and their ability to align the end of a boom to a line of foam.
Differential GPS (DGPS)
Differential GPS or DGPS is a system that relies on the transmission of a differential correction to improve the absolute or relative accuracy of the in-field GPS system. A number of commercial and free-to-air radio and satellite transmission systems for the DGPS corrections are now available in Australia. DGPS systems will typically provide accuracies from 1-5m depending on the receiver and the distance from the nearest correction station. The reliability of DGPS systems has been questioned by a number of researchers. Hellebrand et al. (1997) and Le Bars et al. (1997) found that although DGPS provided acceptable accuracies for many applications, outages caused by loss of correction, poor satellite constellations and multi-pathing must be considered.
Others are more confident in the application of DGPS. Mack (1997) identifies that a well engineered and installed DGPS system can achieve accuracies less than 1m (95%). Mack also found that the progressive de-correlation of errors with increasing baseline length from the base station was unexpectedly benign. In fact he found that the technique produced useful accuracy enhancements up to the point where reference and mobile satellite constellations were no longer common. This separation could be several hundreds of kilometres. These results are supported by Willmott (1999), in his testing of the differences in operation, accuracy and coverage area limits of four public real time differential services.
Real Time Kinematic (RTK) GPS
Real-time kinematic (RTK) GPS provides centimetre accuracy in both static and dynamic applications. It relies on the use of a more sophisticated GPS receiver and a base station with a radio transmission facility located within 10-15km of the work area. In recent years RTK GPS has been coupled with other onboard sensors (such as gyros and inertial systems) to the machine’s steering system to provide driverless or machine guidance for precision farming applications. Depending on the particular circumstances and conditions these systems can achieve accuracies from to 2-10cm.
Data Collection
Field testing was undertaken on farms on the Darling Downs region and the Springsure area in Central Queensland under typical farming conditions. The equipment for the project was provided by Trimble Navigation Limited and included:
• Trimble AgGPS 132 with the Parallel Swathing Option (PSO) with differential correction input and LED light bar guidance, and
The AgGPS 132 can utilise either free-to-air or subscription based private differential correction services to provide sub-metre positional data in real-time. The AgGPS 132 consists of a 12 channel, single frequency (L1) GPS receiver. The system utilises atmospheric models and a virtual reference station (VRS) to minimise degradation of accuracy from the fixed reference stations. The 7400MSi is a high precision real-time GPS receiver that offers low latency and fast-update centimetre accuracy positioning. It is designed specifically for dynamic machine control applications and includes a range of advanced patented technology to enhance the accuracy and performance of the system. The 7400MSi is a 9 channel dual frequency (L1/L2) GPS receiver with a stated horizontal accuracy of 3cm + 2ppm in the 5 Hz positioning mode depending on the satellite geometry and selective availability errors.
Differential corrections for the AgGPS 132 were obtained from two sources during the study.
• A free-to-air correction was available from the Australian Maritime Safety Authority (AMSA) beacons that are situated along the east Australian coastline. For the Darling Downs region, the Brisbane-Bribie Island beacon was utilised where appropriate, whilst the Mackay beacon provided the corrections for testing in the Springsure area.
[image:4.595.121.473.434.675.2]• The OmniSTAR service, a subscription based private differential correction provider, was also utilised.
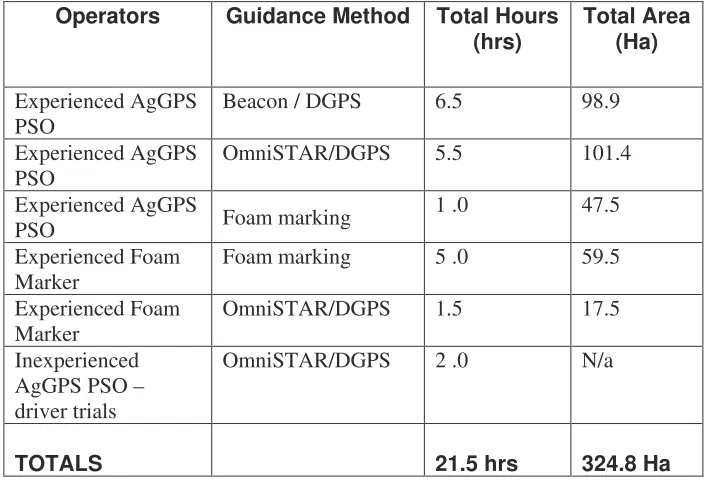
Table 1 details the data collected from different guidance systems during the study.
Operators Guidance Method Total Hours
(hrs) Total Area (Ha)
Experienced AgGPS
PSO Beacon / DGPS 6.5 98.9
Experienced AgGPS
PSO OmniSTAR/DGPS 5.5 101.4
Experienced AgGPS
PSO Foam marking 1 .0 47.5
Experienced Foam
Marker Foam marking 5 .0 59.5
Experienced Foam
Marker OmniSTAR/DGPS 1.5 17.5
Inexperienced AgGPS PSO – driver trials
OmniSTAR/DGPS 2 .0 N/a
TOTALS 21.5 hrs 324.8 Ha
Table 1: Data Collected By Different Guidance Techniques
The GPS antennae for both systems were mounted to a purpose built bracket that was then attached to the roof of the spray vehicle. The bracket was positioned so that both of the GPS antennae were aligned to the direction of travel and centred across the vehicle. The distance between the two antennae was 0.3 metres with the RTK system antennae situated further forward on the vehicle. Due to the different spray rigs and systems tested, the position of the antennae relative to the boom varied with the different vehicles. It was assumed that the boom would accurately follow the path of the spray vehicle and that any error or offset would be systematic. Data was collected on board the vehicle on laptop computers and later downloaded for processing.
[image:5.595.154.442.292.526.2]Parallel swaths were then completed according to the guidance from the AgGPS 132 PSO light bar. At the same time, the RTK system recorded the positions of the vehicle at a rate of five times per second (5 Hz) and these were used as 'absolute positions' for comparisons during the data analysis.
Figure 1: GPS and Radio Antennae on Spray Rig
During the collection of foam marking guidance data it was only necessary to install the RTK system on the spray vehicle. Foam marker operators utilised the edge of the crop or fence lines to establish their initial swath path and then followed the foam “blobs” as a means of guidance over the remainder of the cultivation.
Data Reduction
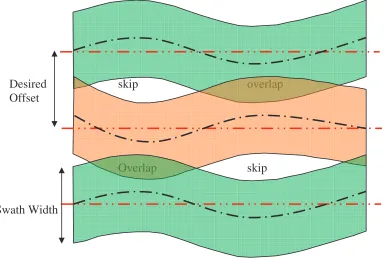
For the project the swath width is defined as the width that is covered by a spray boom during the application of agri-chemical. The measurement of this width has been found to a matter of considerable debate as to whether this width is a reflection of the actual boom width, foam marker locations on the boom or the distance to points beyond the boom where the spray will hit the crop. The offset width is defined as the desired distance between consecutive runs. Often, operators deliberately set this distance to be less than the swath width to minimise missing (skipping) areas. For the purpose of the analysis the swath width and the offset have been considered to be the same.
The term skip was defined as that area between two consecutive spray lines that is not covered by the swath of either spray lines. It occurs as a result of the offset between consecutive spray lines being greater than the swath width and/or the variability in the guidance system utilised. Conversely overlap is defined as that area between two consecutive spray lines that receive double coverage by consecutive swaths. It occurs as a result of the offset between two consecutive spray lines being less than the swath width and/or the variability of the guidance system utilised.
Desired skip overlap
Offset
Overlap skip
[image:6.595.90.474.317.575.2]Swath Width
Figure 2: Conceptual Diagram of Skip, Overlap, Offset and Swath Width
Due to the quantity and format of the data, specific software was written to perform some of the initial data reduction. The data reduction software performed a number of specific tasks including:
• Error checking – for incomplete data and RTK fixed mode positions • Reduction of either AgGPS 132 or 7400MSi
• Filtering of data by time and/or distance
• Conversion of latitude and longitude to a local cartesian system (E,N) of coordinates at ground height
In the first instance the data was transferred into AutoCAD to enable the initial editing and exclusion of the raw data. The drawing facilities in AutoCAD were used to edit the lines to exclude areas where overlap or skip occurred due to field obstacles. The ends of the lines were also trimmed to approximately 30 metres from the turning points to exclude the headland turns, which are normally controlled by the operator without reference to any of the guidance methods.
GIS Processing
After the editing work in AutoCAD was completed, five drawing files were created to generate shape files in ArcView. The swath widths were used to create buffers along each of the odd numbered spray lines and then each of the even numbered spray lines. The combination of the odd and even numbered buffers enable the skip and overlap to be derived. The resulting buffers were then clipped to ensure that all of the buffers lay within the previously defined extents.
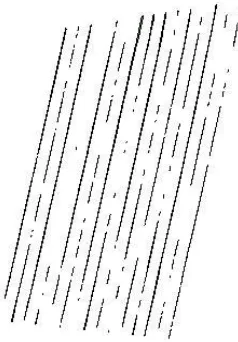
[image:7.595.258.377.339.510.2]The intersection of these buffers provides the overlap between each consecutive swath line. (See figure 3)
Figure 3: ArcView Drawing of the Overlap Between Each Consecutive Spray Line
The combined area of all the polygons in the above figure represents the total overlap. A similar process determines the total area of skip.
Analysis of Data
The data analysis examined a number of operator and systems issues including: (i) the ability to generate a consistent relative offset,
(ii) the ability to maintain a defined offset from an initial line, and (iii) the quantification of skip and overlap.
the vegetation type and the general ground conditions. Some operators were able to provide field data using several different guidance types.
[image:8.595.119.498.189.396.2]Ability to Generate a Consistent Relative Offset
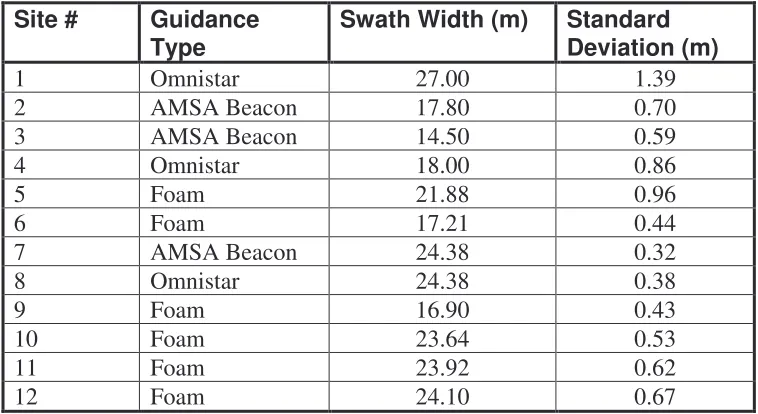
Table 2 provides a summary of the results achieved at each of the sites. One site was excluded from the analysis due to poor ground conditions.
Site # Guidance
Type Swath Width (m) Standard Deviation (m)
1 Omnistar 27.00 1.39
2 AMSA Beacon 17.80 0.70
3 AMSA Beacon 14.50 0.59
4 Omnistar 18.00 0.86
5 Foam 21.88 0.96
6 Foam 17.21 0.44
7 AMSA Beacon 24.38 0.32
8 Omnistar 24.38 0.38
9 Foam 16.90 0.43
10 Foam 23.64 0.53
11 Foam 23.92 0.62
12 Foam 24.10 0.67
Table 2: Comparison of Standard Deviations for Different Sites and Guidance Type.
The standard deviation of the offsets between consecutive spray lines provides a measure of the accuracy with which the second line was run parallel to, and at a constant distance from, the first line. It is not a measure of how closely a straight line can be run. Comparing the standard deviations achieved at different project sites enables a comparison to be made of the consistency of the different spray units. A spray unit includes the spray vehicle, the guidance system and the operator.
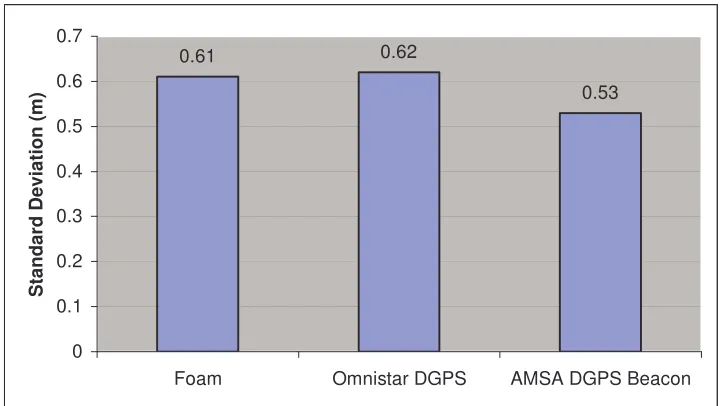
The standard deviations of the five project sites that used the DGPS guidance ranged from 0.32m to 0.86m with an average of 0.56m.
Figure 4: Average Standard Deviation of Line Offsets by Guidance Types
Figure 4 illustrates the average standard deviations for each of the three guidance types. The average standard deviations for each guidance type are not considered to be significantly different with respect to their ability to provide a consistent parallel offset. Buick and Lange (1998) and further by Buick and White (1998) compared traditional guidance systems i.e. foam marking with both RTK DGPS with light bar guidance and a centimetre accuracy RTK GPS system. This research also found that the accuracies achieved by foam marking and DGPS were similar when comparing the relative positioning capabilities of the two systems.
Ability to Maintain a Defined Offset from an Initial Line.
To test this hypothesis, the DGPS project sites were compared to the foam marking sites to firstly, evaluate if there was any skewing or divergence from the initial line and secondly, to identify if there was any significant “creep” which may result in increased skip or overlap. In the case of the GPS guidance, this was achieved by comparing the swath width entered into the guidance system with the actual swaths that were measured in the field. For the foam marking guidance, this comparison was a little more complicated as individual operators make personal decisions on where to position the boom with respect to the foam marks.
Therefore to treat the operators and conditions equally it was decided to use the average of the first three swaths as the intended or defined swath. This decision was justified on the basis that:
• during the first three swaths the operator is unlikely to be tired and thus would provide a realistic estimate of their intended swath width, and
• the high sample rates of the RTK GPS over the three lines, would provide a valid statistical sample.
The swath width for the sites tested with the Ag132 varied in width from 14.50m to 27.0m. Over the five DGPS sites the averages for all the swaths did not vary from the
0.61 0.62
0.53
0 0.1 0.2 0.3 0.4 0.5 0.6 0.7
Foam Omnistar DGPS AMSA DGPS Beacon
S
ta
nd
ar
d
D
ev
ia
tio
n
(m
input swath by more than .04m and resulted in a 95% probability that the desired offset for any one line would be within 0.15m of its true offset from the initial line. In addition, there is little or no skew accumulated in the swaths as the GPS system, when used in the same locality, is not dependent on the distance it is away from the initial line. The results indicate that GPS guidance can eliminate a significant proportion of the operator errors that may accumulate over multiple swaths.
From the six foam marker sites assessed, the results vary from operator to operator and site to site. As opposed to the GPS guidance the foam marker operators tended to both skew the line and “creep” or “drift”. These increased the further away from the initial line they were operating. In most cases there was a tendency to ensure that there was more overlap and minimal skip. This unintentional overlap ranged from 0.2% to 3.4% across the sites and averaged 1.5%. At the larger end of the scale this could effectively result in the operator spraying an additional full swath.
As foam marking relies on following successive rows of foam “blobs” it is expected that any error with respect to the parallel nature of the lines will be accentuated the more runs that are completed. This may be measured by assessing the skew of the line from the initial line. The skew angles measured ranged from 0.2-0.6 degrees which, when translated to distance, represents between 3-10m over 1000m.
Skip and Overlap
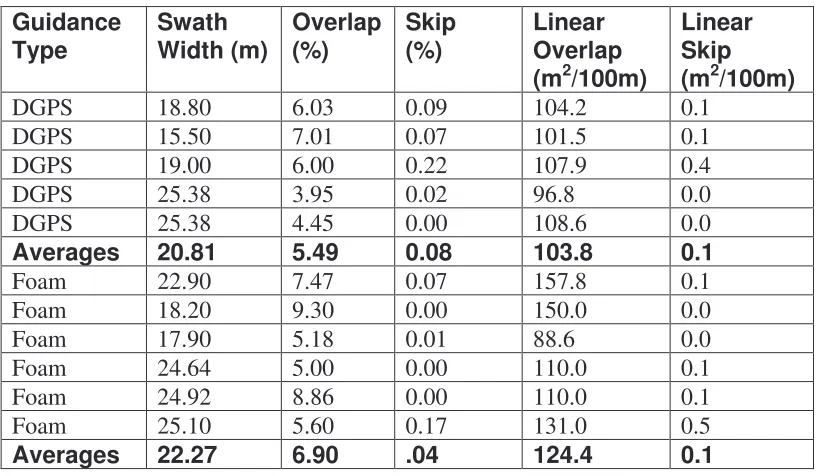
Calculations were made to determine the amount of skip and overlap which would have occurred using the defined swath widths. Areas of skip and overlap were calculated using the swath width keyed into the AgGPS 132 for the GPS guidance and the averaged foam marker width. In both cases the width was increased by 1.0m to account for the spray areas beyond the outer nozzles. The skip and overlap are expressed as percentages of the total areas for each site. Care must be exercised in using these percentages, as, although they reflect the actual areas of skip and overlap, they cannot form the basis of comparison of different spray units with varying boom widths.
Guidance
Type Swath Width (m) Overlap (%) Skip (%) Linear Overlap (m2/100m)
Linear Skip (m2/100m)
DGPS 18.80 6.03 0.09 104.2 0.1
DGPS 15.50 7.01 0.07 101.5 0.1
DGPS 19.00 6.00 0.22 107.9 0.4
DGPS 25.38 3.95 0.02 96.8 0.0
DGPS 25.38 4.45 0.00 108.6 0.0
Averages 20.81 5.49 0.08 103.8 0.1
Foam 22.90 7.47 0.07 157.8 0.1
Foam 18.20 9.30 0.00 150.0 0.0
Foam 17.90 5.18 0.01 88.6 0.0
Foam 24.64 5.00 0.00 110.0 0.1
Foam 24.92 8.86 0.00 110.0 0.1
Foam 25.10 5.60 0.17 131.0 0.5
[image:11.595.94.502.96.334.2]Averages 22.27 6.90 .04 124.4 0.1
Table 3: Comparisons of skip and overlap for foam and DGPS guidance.
The results indicate that both GPS guided operators and foam marking operators tend to err on the side of caution to ensure that any areas of skip are minimised or eliminated. This results in increased overlap or over-application of chemicals and may be seen as wastage or inefficiency. Both the area and linear comparisons indicate that the foam marker operators over-applied by approximately 20-25% more than the GPS guided operators. Expressed in area this may account for up to 1.5% of the total spray area and could be translated into savings in chemical, fuel and time. This finding supports the results of the skew and offset analysis that indicate that “creep” or “drift” may have resulted a similar percentage of overlap.
Conclusions
It was recognised that the maintenance of correct distance between one run and the next, although repetitive, is one of the most difficult operations for an operator. This is particularly so when wide equipment is used.
The results of the project indicate that the particular DGPS guidance system was of comparable precision to the conventional guidance by foam marking under ideal conditions. The study also found that GPS guidance can provide a more reliable system for maintaining parallel swaths and eliminate the tendency of swaths to skew due to the accumulation of operator errors. It was found that both GPS and conventional guidance operators had a tendency to overspray their runs to ensure that they did not miss any areas. However, it was evident that the foam marking operators in the study, on average, generated approximately 20% more overlap.
farming is now increasingly competitive, the interests of farmers, consumers and the environment have converged, with an increasing demand for consistent, quality products. The responsible application of chemicals is not only environmentally sound, but makes good business sense. Technologies such as GPS and GIS do not only provide scientific support for research into agricultural systems but now also provide operational tools to support improvements in farm management and efficiency.
Acknowledgements
The authors wish to acknowledge the support of Trimble Navigation Australia for the use of the GPS equipment used in this project.
References
Balsari, P. and Tamagnone, M. (1997), Directional control of agricultural vehicles, In Proceedings of the First European Conference on Precision Agriculture, September 1997, The SCI Agriculture and Environment Group, Warwick University Conference Centre, UK.
Buick, R. and Lange, A.F. (1998), Assessing efficiency of agricultural chemical application with differential GPS, ArcView and Spatial Analyst, URL: http://www.esri.com/library/userconf/proc98/PROCEED/TO650/PAP622/P622.HTM
Buick, R. and White, E., (1998), Comparing GPS and foam marker guidance, Research paper compile by Available from Trimble Navigation.
Hellebrand, H. Beuche, (1997), Multicomponent positioning for site-specific farming, Proceedings of the First European Conference on Precision Agriculture, September 1997, The SCI Agriculture and Environment Group, Warwick University Conference Centre, UK.
Le Bars, J.-M. and Boffety, D., (1997), Location improvement by combining a DGPS system with on field vehicle sensors, Proceedings of the First European Conference on Precision Agriculture, September 1997, The SCI Agriculture and Environment Group, Warwick University Conference Centre, UK.
Mack, G., (1997), Precise positioning for agriculture, Proceedings of the First European Conference on Precision Agriculture, September 1997, The SCI Agriculture and Environment Group, Warwick University Conference Centre, UK.
Willmott, T., (1999), GPS accuracies using free-to-air and subscription DGPS signals, Proceedings of the 4th International Symposium on Satellite Navigation Technology & Applications, Organisers Australia, Brisbane, Australia July 20-23, 1999.