Stability Impact on Wake Development in Moderately
Complex Terrain
D Infield and G Zorzi
Wind Energy and Control Centre, University of Strathclyde, Royal College Building, 204 George Street, Glasgow G11XW, UK
Abstract. This paper uses a year of SCADA data from Whitelee Wind Farm near Glasgow to investigate wind turbine wake development in moderately complex terrain. Atmospheric stability measurements in terms of Richardson number from a met mast at an adjoining site have been obtained and used to assess the impact of stability on wake development. Considerable filtering of these data has been undertaken to ensure that all turbines are working normally and are well aligned with the wind direction. A group of six wind turbines, more or less in a line, have been selected for analysis, and winds within a 2 degree direction sector about this line are used to ensure, as far as possible, that all the turbines investigated are fully immersed in the wake/s of the upstream turbine/s. Results show how the terrain effects combine with the wake effects, with both being of comparable importance for the site in question. Comparison has been made with results from two commercial CFD codes for neutral stability, and reasonable agreement is demonstrated. Richardson number has been plotted against wind shear and turbulence intensity at a met mast on the wind farm that for the selected wind direction is not in the wake of any turbines. Good correlations are found indicating that the Richardson numbers obtained are reliable. The filtered data used for wake analysis were split according to Richardson number into two groups representing slightly stable to neutral, and unstable conditions. Very little difference in wake development is apparent. A greater difference can be observed when the data are separated simply by turbulence intensity, suggesting that, although turbulence intensity is correlated with stability, of the two it is the parameter that most directly impacts on wake development through mixing of ambient and wake flows.
1. Introduction
validation against wind farms located in complex terrain. This paper aims to help fill this gap through study of wind turbines in moderately complex terrain. Efforts have been made to identify the effect of atmospheric stability on the wake data, but also as will be seen, these effects turn out to be relatively modest in this case.
2. Site characteristics and turbine selection
[image:2.595.198.418.281.446.2]Whitelee wind farm is located 15 km south of Glasgow on an area of partially forested upland. The site area is 55 km2 and accommodates a total of 215 turbines with a total installed capacity of 539 MW. Of these 140 are Siemens 2.3 MW rated turbines comprising a mix of SWT-2.3-82 and SWT-2.3-93 turbines having rotor diameters of 82 m and 93 m respectively. The terrain is moderately complex with changes in elevation that have a distinct impact on wind speeds. The prevailing wind direction is south-westerly as shown clearly in the wind rose shown in Figure 1 depicting data measured at turbine hub height on mast 81, which is located to the west of the wind farm.
Figure 1: Wind rose from met mast 81
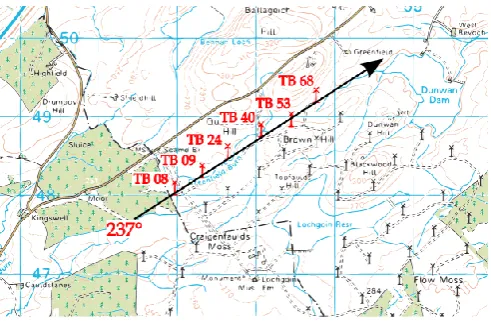
Because of the complexity of the terrain, the wind farm does not follow a regular grid structure. This makes the selection of turbines for wake analysis purposes more difficult. A group of six SWT-2.3-93 wind turbines, all with a hub height of 63.5 m, which lie more or less along a line at 237o have been selected due to their open and consistent exposure to the prevailing wind direction. These turbines are highlighted in Figure 2 showing a map of this part of the wind farm, taken from digimap, [4].
[image:2.595.181.427.546.707.2]Table 1 gives the distances between adjacent wind turbines and also the exact angle between the pairs of turbines. It is apparent that the turbines are not equally spaced, and that there are minor, but perhaps, in terms of wake impact, significant departures from the 237o line.
Turbine pair 08 - 09 09 - 24 24 - 40 40 - 53 53 - 68
Distance between turbines (m) 377 423 465 421 457
Distance between turbines (rotor diameters) 4.05 4.55 5.00 4.53 4.91 Angular alignment (degrees) 240.8 227.1 238.4 249.4 226.1
Table 1: Separation and angular alignment of the selected turbines
Along the wind direction of 237o the turbines lie on a steady upward slope. The ground elevation for the six turbines is given in Table 1 below.
Turbine number 08 09 24 40 53 68
Terrain elevation (m asl) 263 264 267 275 279 272
Table 2: Elevations of the selected turbines
3. Data processing and direction re-calibration
SCADA data for the complete wind farm has been made available by the site operator, Scottish Power Renewables, for the period 1st January 2012 to 1st January 2013. This includes all 140 turbines plus wind speed data from the two site met masts at a range of measurement heights together with wind direction, air temperature and pressure. Amongst other parameters, the individual turbine SCADA measurements include 10 minute averages of: nacelle wind speed; rotor angular velocity; blade pitch angle; active power output; and yaw position, together with maximum, minimum and standard deviation. These data has been imported into MATLAB for analysis. Since the met masts are some distance from the selected turbines, it was decided, considering the irregularity of the intervening terrain, not to rely on wind direction measurements made at the masts, but rather to identify wind direction from the yaw position sensor for the first turbine in the line, namely turbine 08.
3.1. Yaw angle re-calibration
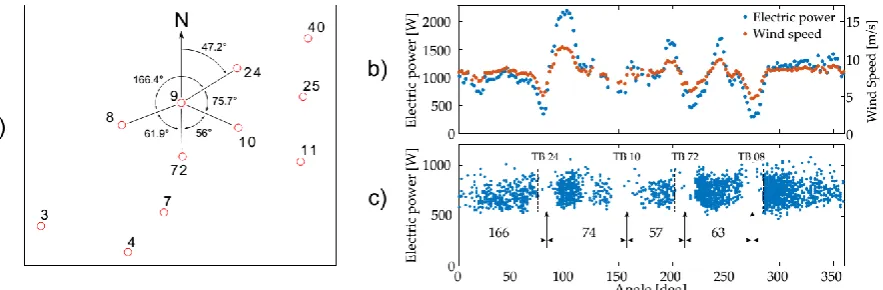
Figure 3: a) Relative angular position of TB 09 with surrounding turbines. b) Power and wind speed as a function of yaw angle position for TB 09. c) Power from TB 09 for wind speeds 6.7 to 7.6 m/s
3.2. Data selection
Three nacelle wind speed signals are available in Siemens SCADA data sets with different designated sensor names (in fact reflecting different ways in which the raw anemometer signals have been processed by the SCADA software): active; primary; and secondary wind sensors. The first of these has been chosen because it showed the highest correlation with the hub height wind speeds measured at met mast 81. For reliable wake assessment, it is essential that all the turbines selected are working properly, and not for example cutting in or out within the ten minute averaging period, or operating in a curtailed mode. Such unwanted data have been removed by applying a sequence of filters. Wind speeds below 4 m/s and power values below 100 kW have been filtered out as these are of no interest for wake analysis. In addition the known pitch characteristics of the Siemens turbine (ie the dependence of blade pitch angle on average wind speed) have been used to identify any curtailment and to remove such data.
In addition to the data reduction outlined above, data have been further filtered to ensure that all six turbines are operating, and that they are all reasonably aligned with the wind direction (defined as being within ±10o). The result of this data processing was to eliminate 67% of the total number of data points. Finally, a very narrow wind directing sector of 237 ±1o has been adopted for the wake analysis.
4. Experimental results
The data has been analysed with several key objectives in mind: to explore the wake spread and confirm the yaw angle re-calibration procedure; to investigate the cumulative wake superposition effect and its interaction with terrain effects; and to explore the impact of atmospheric stability.
4.1. Assessment of wake spread
[image:4.595.81.523.119.264.2]cause concern regarding the wind direction calibration, but actually this reflects the fact that turbines TB 08 and TB 09 do not lie exactly along the 237o line, but are displaced by 4o, in accord with Figure 4.
Figure 4: Wake spread for turbine TB 08 for wind speed interval [7.5 8.5] m/s
Figure 5: Thrust coefficient as a function of wind speed
4.2. Cumulative wake superposition and interaction with terrain effects
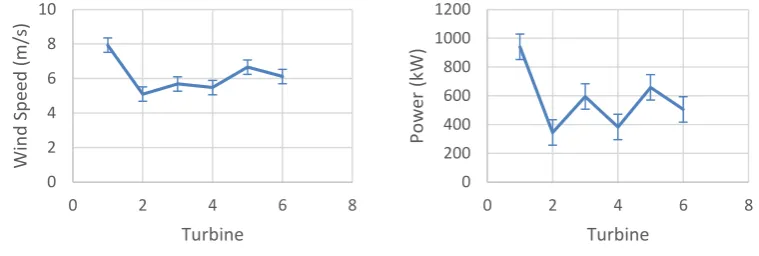
[image:5.595.136.466.340.487.2]Figure 6: Wake development from TB 08 to TB 68 (left for wind speed, right for power)
4.3. Impact of atmospheric stability
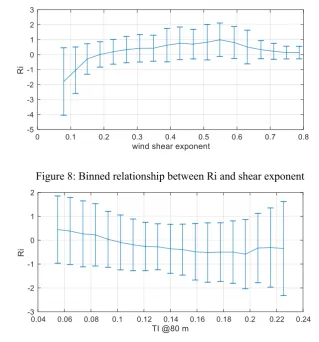
Concurrent estimates of the bulk Richardson number (Ri) have been made available based on data collected by NEL at an adjoining site. The raw data was not supplied but it is known that Ri was calculated according to Equation 1, where ΔT, z and U are the differences in temperature (Kelvin), height (m), and wind speed (m/s) respectively, and that measurements were made at 1 m and 76 m height for temperature, and 10 m and 80 m for wind speed (the fact that the heights used for temperature and wind speed did not coincide exactly will result in some minor error in the estimation). Although Richardson number is a convenient measure of atmospheric stability, it is difficult to estimate accurately due to expected errors in measuring small temperature difference. To give some confidence to the estimates, correlations with wind shear and turbulence intensity at met mast 81 have been calculated derived from average values at each hour of the day that reflect the expected consistent changes in stability through the 24 hour period. These are presented in Figure 7 and show well defined and expected relationships; ie turbulence intensity increases with atmospheric instability (negative Ri), and wind shear (given by the shear exponent) increases with stability (positive Ri). However, if the Ri is plotted directly against shear or turbulence intensity for the individual time points, the result is widely scattered with no correlation apparent, indicating poor accuracy for individual estimates of stability. To contrast with Figure 7, and provide a more balanced assessment of the relationships, the data has been binned by shear exponent and turbulence intensity to create Figures 8 and 9 respectively. The results are not nearly as linear and very wide confidence limits are apparent reflecting the scatter mentioned; despite this the expected tendencies in the relationships are generally apparent.
𝑅𝑖 =
𝑔.( ∆𝑇∆𝑧)
𝑇.(∆𝑈∆𝑧) (1) 0 2 4 6 8 10
0 2 4 6 8
Win d Sp ee d (m/ s) Turbine 0 200 400 600 800 1000 1200
0 2 4 6 8
Po
w
er
(kW)
Figure 7: Correlations between Ri and shear exponent (left) and turbulence intensity (right)
Figure 8: Binned relationship between Ri and shear exponent
Figure 9: Binned relationship between Ri and turbulence intensity
It can be seen from Figures 7, 8 and 9 that atmospheric conditions at the windfarm range from unstable to neutral to slightly stable as might be expected for an onshore site near to the west coast of the UK. To explore whether changes in stability impact significantly on wake development at this site, the data filtered by power in the range 400 to 1700 kW to give the maximum amount of data consistent with near constant thrust coefficient has been split by positive and negative Ri, and the normalized power with respect to the power of TB 08, plotted for each of the turbines as shown in Figure 10. Very little difference can be identified; this is assumed to be due to the scatter between the raw hourly values of the parameters that is apparent in Figures 8 and 9. Regrettably, it has not been possible to present the
-1 -0.8 -0.6 -0.4 -0.2 0 0.2 0.4
0 0.1 0.2 0.3 0.4
Ri
wind shear exponent -1
-0.8 -0.6 -0.4 -0.2 0 0.2 0.4
0 0.1 0.2 0.3
Ri
[image:7.595.127.447.268.611.2]errors bars for Figure 10, but these will be comparable to those shown in the corresponding plot of Figure 6.
Figure 10: Wake development for positive and negative Ri
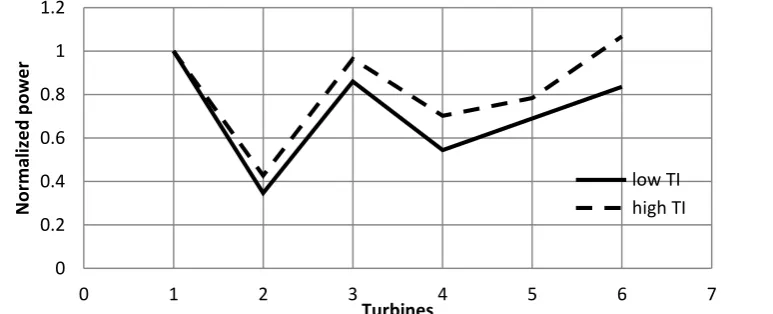
[image:8.595.113.500.456.613.2]As an alternative to analysis by Richardson number, the same data has been plotted but this time separated into high and low turbulence intensity as measured at met mast 81. The result is shown in Figure 11, and shows a much clearer dependency. This suggests that it is the ambient turbulent level that is known to determine wake mixing and decay that is more important, although of course changes in turbulence intensity are related to changes in stability as shown above. The turbulence intensity was measured closer to the turbines than the mast used to calculate Ri but whether this might in part explain the result is unclear.
Figure 11: Wake development for high and low turbulence intensity
5. Provisional wake model comparisons
Two commercial CFD codes have been used to model the wake development of the selected turbines: WindModeller (based on ANSYS/CFX), [5], and STAR-CCM+, [6]. Only a single wind direction has been used in the results presented here and so variations in wind speed within the 10 minutes averaging period of the SCADA data are not accounted for. Both CFD codes employ an actuator disk representation for the wind turbine rotor, and both have represented the atmospheric boundary layer as neutral. There are however differences in the way the codes as applied in this instance have dealt with stratification above the boundary layer. STAR-CCM+ accounts for the stable stratification that typically occurs in a
0 0.2 0.4 0.6 0.8 1 1.2
0 1 2 3 4 5 6 7
N o rm al ize d p o we r Turbines +ve Ri -ve Ri 0 0.2 0.4 0.6 0.8 1 1.2
0 1 2 3 4 5 6 7
free atmosphere above the boundary layer, from around 1 km above the ground, whilst although CFX has this capability, this option has not been invoked in this particular application. This is not considered to have a significant impact on the results presented. As mentioned, no attempt has been made in this provisional application of the CFD codes to take account of expected wind direction changes within the 10 minute averaged data (the standard deviation of wind directions was calculated as 8.83o from the wind vane on met mast 81). The results (Figure 12) show reasonable agreement between the models and data, and reflect, but to different extents and in different ways, the impact of the terrain and the differences in turbine alignment.
Figure 12: Comparison of wake models with SCADA data results
6. Conclusions
A year of SCADA data from Whitelee wind farm has been carefully processed to exclude potentially misleading data points and has been examined for a very narrow wind direction sector to examine the wind speeds and power production of 6 turbines, and thus the wakes of five turbines. The data has been split into two sets according to bulk Richardson number, and also ambient turbulence intensity, so as to examine the impact of atmospheric stability on wake development. Although this effect has been examined for offshore sites, very little corresponding work has been undertaken for onshore wind farms. The results indicate very little impact of atmospheric stability on wake strength which may be due to the limited range from unstable to slightly stable for this particular site. Splitting the data into high and low turbulence intensity however showed a marked impact, with high turbulence resulting in diminished wakes as would be expected. Some provisional wake calculations undertaken using ANSYS WindModeller and STAR-CCM+ and assuming a neutral boundary layer showed reasonable agreement with the data.
0 0.2 0.4 0.6 0.8 1 1.2
0 1 2 3 4 5 6 7
Relative turbine
power
Turbine
SCADA data
WindModeller
References
[1] Larsen, G. C. A simple stationary semi-analytical wake model; Risø-R-1713(EN), 2009.
[2] Katic, I., Hojstrup, J. and Jensen, N.O. (1986) A Simple Model for Cluster Efficiency; Proc. EWEC, October, 1986, Rome.
[3] https://www.ieawind.org/task_31.html
[4] Ordnance Survey, “OS MasterMap Topography Layer.”
[5] http://resource.ansys.com/Resource+Library/Webinars/Wind+Farm+Flow+Modeling:+Includin g+Atmospheric+Stability
[6] http://mdx.plm.automation.siemens.com/star-ccm-plus
Acknowledgements
![Figure 4: Wake spread for turbine TB 08 for wind speed interval [7.5 8.5] m/s](https://thumb-us.123doks.com/thumbv2/123dok_us/1460713.98744/5.595.136.466.340.487/figure-wake-spread-turbine-tb-wind-speed-interval.webp)