International Conference on Maritime Safety and Operations, Glasgow, UK, 13th – 14th October 2016
145
1 INTRODUCTION
Since the first publication of the Convention of Safety of Life at Sea (SOLAS), approved in 1914 to present day, the maritime safety has managed to improve gradually to a preventive approach. Even though each day it is applied new safety procedures and new marine systems are introduced, injuries and fatalities in passengers and crew, environmen-tal pollution as well as damage on ship and its equipment continue to occur.
From the report of EMSA (2015) regarding to marine incidents, between the years 2011-2014 the number of occurrences reported was 9180. For 2014 there were 3025 occurrences; within which 765 were serious and 99 very serious. Also this document shows the dates regarding ship collision and grounding that for 2014 there were equal to 293 for ship collision and 331 for Ground-ing/Stranding.
Attending the information exposed in the para-graph above, this study has the objective to analyse the areas exposed to highest stress due to ship grounding, simulating different scenarios of dam-age along the ship bottom.
The structural condition of a tanker ship for in-tact and damage cases is investigated, in order to provide an approximation of the areas exposed to
the highest stresses. The method selected to simu-late the damage conditions has been done applying a change in the mechanical properties of the mate-rial; reductions of 40, 60 and 80 % of Young Mod-ules were applied at ship bottom. Research results have been validated according to the guidelines of the International Association of Classification So-cieties. The finite element method and finite ele-ment analysis software (Ansys®) was used to ana-lyse the intact and damage cases. For the intact case only the full load condition scenario was consid-ered, while for damage conditions, three scenarios have been studied.
The evaluation of the strength structure has been analysed using the finite element method, this pro-ject has taken into consideration the information obtained from finite element analysis manuals, in-ternational regulations and research papers outlined below.
Nowadays the use of finite element analysis is a conventional method applied to resolve the majori-ty of problems related to structural calculation. It is possible to find important information regarding the application of finite element analysis in marine industry using Ansys in the study carry out by (Su-man et al., 2008). Another interesting study about strength analysis using Ansys was done by (Mathai et al., 2013) applied to container ship. Lakshmi and
Tanker Ship Structural Analysis for Intact and Damage Cases
R. Fernandez., I. Lazakis, G. Theotokatos & E. Boulougouris
University of Strathclyde, Glasgow, U.K.ABSTRACT: This paper presents the work carried out to assess the structural calculation of a tanker ship in intact and damage conditions, in order to know the areas of the central cargo ship exposed to greater stresses. Analysing the results obtained from the intact condition and damage conditions due to grounding. The method selected to simulate the damage conditions has been done applying a change in the mechanical properties of the material; reductions of 40, 60 and 80 % of Young Modules were applied. The validation of the results was made following the guidelines “Common Structural Rules for Bulk Carriers and Oil Tankers” from IACS. The finite element method and finite element analysis software (Ansys®) were used to analyse intact and ground-ing cases. For intact case only one scenario was done, full load condition. For groundground-ing, three scenarios were done. The results presented correspond to the validation of the finite element model, and the results concern-ing the maximum value of Von Mises Stress for each load condition, verifyconcern-ing if the permissible stress has been exceeded in each of the conditions analysed.
146 Nageswara (2015) studied the utilization of finite element analysis applied on a cargo ship.
Attending the importance of factors such as model generation, selected material, applied loads and constraints imposed, in order to validate the re-sults obtained, this project has followed the guide-lines stablished mainly by IACS (2006), IACS (2012).
Regarding the literature consulted about strength analysis on ships, it is necessary to emphasize the work done by (Saad-Eldeen, et al., 2016) regarding hull girder ultimate strength, also the research done by (Dimitris et al., 2003), another important litera-ture consulted was the research done by (Gaspar, 2016) and (Heinvee et al., 2013) regarding predic-tion of bottom damage in tanker due to grounding.
This paper is organized as follows: Section 2 presents and methodology applied. The main char-acteristics of the model selected as well as the pro-cess follows to generate the model developed is ex-plained. Section 4 shows the values of the mesh generated. In Section 5 an explanation about mate-rial selection is done. Section 6 shows the boundary conditions applied. The information regarding Loads applied were described in Section 7. Section 8 shows the information regarding the validation of the model. The Von Mises Stress results for intact and damage conditions are presented in Section 9. The conclusions are presented in the last section.
2 METHODOLOGY
The methodology followed in this project starts with the definition of the main characteristics and dimensions of the ship, and the scantling of the structure. Followed by the generation of the mesh of the ship model. The next step is related to the definition of material properties and reductions of Young Modulus established for each condition es-tablished. The sequence follows with the definition of the boundary conditions and the application of the static loads.
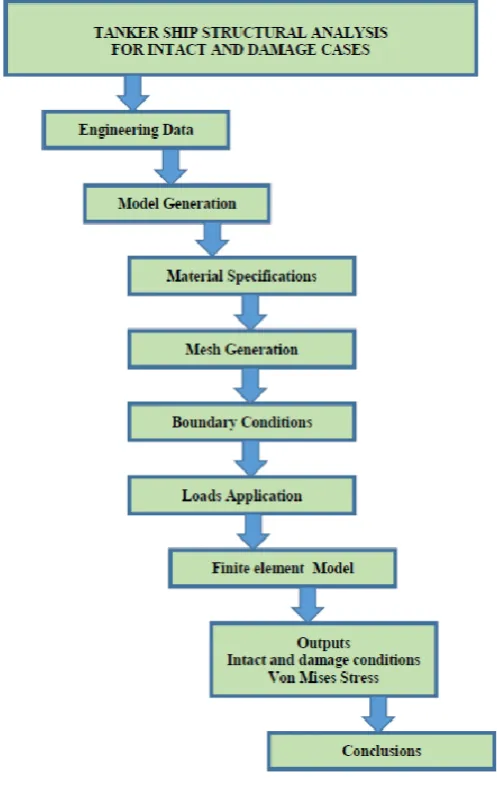
[image:2.595.317.566.39.435.2]Next section is dedicated to explaining and showing the process and results obtained to validate the model. The next section has been left to show the results of the areas of maximum stress concen-tration. Leaving the last section for conclusions. Figure 1 shows methodology follow in this project.
Figure 1. Flow chart methodology.
3 INVESTIGATED VESSEL
3.1 Principal Ship Characteristics
The vessel selected for this analysis is an Aframax oil tanker. This vessel is designed to operate in in-ternational waters. For this study the guidelines es-tablished by IACS (2012) have been followed, more concretely section 9 regarding design verifica-tion, which explain the requirements to evaluate the hull strength applying the FEA. The rule require-ments are based on the assumption that the materi-als used are manufactured in accordance with the rolling tolerances specified inIACS (2012). Table 1 shows the main dimensions of the ship.
Table 1. Main dimensions of the vessel.
Main Particulars m
______________________________________________ LOA 240.5
LBP 230.0 B(mld) 42.0 D(mld) 21.2 T(mld, Design) 12.2 T(mld,F.load) 14.9
147 Following the guidelines indicated by IACS (2012), three cargo holds have been modelled to represent the midship section of the ship (two whole holds and two half holds at the fore and aft of the midship areas. The structure consists of shell elements rep-resenting plates and beam elements reprep-resenting stiffeners. The distance between web frames is 4.75 m. The watertight bulkheads are located at the end of every cargo tank, with a distance equal to 28 m. Figure 2 shows the location of the cargo tanks ex-amined.
Figure 2. Cargo holds selected.
[image:3.595.310.565.239.311.2]With the intention to reduce the calculation time of FEA, several assumptions were considered notably; the smallest elements with length between 0.1 m to 0.4 m of width were not modelled. The tool Design Modeler of Ansys® program has been used to mod-el the tanker ship midship section. Figures 3 and 4 show the arrangement and the section view of the cargo tanks in Design Modeler.
[image:3.595.32.289.378.614.2]Figure 3. Cargo holds Arrangement.
Figure 4. Section view of cargo holds.
3.2 Materials
For this project has been decided to select the mate-rial from the matemate-rial library of Ansys®. The reason why this steel has been selected is because it has the same mechanical properties as used in the naval industry, at the same time this steel conforms the requirements established by IACS (2012) in regards to material properties. As was mentioned in the sec-tion 2 of this project regarding to material used, it has had in consideration the specifications collected in IACS (2012), regarding to thickness tolerances of steel plates. The material properties of the steel selected are displayed in Table 2.
Table 2. Mechanical properties structural steel
______________________________________________
Item Value
______________________________________________ Tensile yield strength 250 MPa Compressive yield strength 250 MPa Tensile ultimate strength 460 MPa Density 7850 kg/m3
_____________________________________________
3.3 Finite Element Model
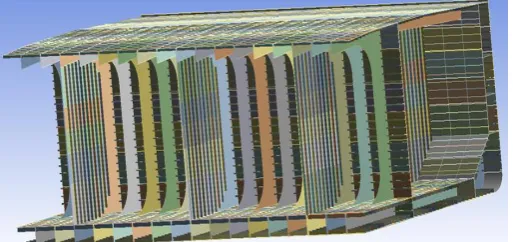
[image:3.595.313.567.415.531.2]The Finite Element code of Ansys® software was used to analyse the structure. The generated number of nodes was equal to 75049 and 49525 elements. Figure 5 is shows the mesh generated.
Figure 5. Structure of midship section (Web Frame).
3.4 Boundary Conditions
The boundary conditions have been applied at the rigid links on the cargo ends, point constraints and end-beams. Following the instructions specified in IACS “Common structural rules for double hull tanks”. Rigid links connect the nodes on the longi-tudinal members at the model ends.
3.5 Loads Applications
[image:3.595.33.290.652.773.2]148 Table 3. Loads description.
______________________________________________
Load type Description
______________________________________________ Structural weight Steel and Outfit weight
Internal pressure Crude oil hydrostatic load. External pressure Sea water hydrostatic load. Bending moments Sagging condition.
_____________________________________________
The Structural model has been investigated in four different scenarios. Intact condition, damage condi-tion 1, damage condicondi-tion 2 and damage condicondi-tion 3.
The first scenario analyses the structural strength at intact condition. For this analysis only static loads are applied on the model. With the intention of knowing and validating afterwards the strength obtained, with the results of strength obtained from the software Poseidon.
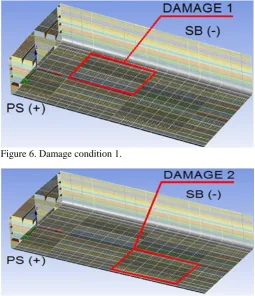
[image:4.595.30.285.48.128.2]The other three cases include the investigation of structural strength, taking into account damage conditions at different areas of ship bottom. The in-vestigated damage locations are shown in Figures 6, 7 and 8, at the same time for each damage area; a reduction of 80, 60 and 40% of Young Modulus has been applied in bottom plates and stiffeners in contact with bottom plates and floors.
Figure 6. Damage condition 1.
Figure 7. Damage condition 2.
Figure 8. Damage condition 3.
4 MODEL VALIDATION
The validation of the 3D model and the results ob-tained in Ansys® have been analysed and validated by using DNV-GL software “Poseidon”, it is a software to evaluate the strength of ship hull struc-tures, which permit to compare the hull section modulus, inertia and normal tension results at the deck and bottom areas of ship in intact condition.
At the same time, at the final of this section a testing made using Ansys® has been included. The purpose of this test is none other than studying the behaviour of the structure. For this test, the Von Mises Stress was analysed, using the comparison between intact condition and damage condition 2, with the correspond reductions of 40, 60 and 80% in the mechanical properties of the material.
[image:4.595.32.288.376.673.2]The process followed for the comparison was first of all the selection of the loading Condition, which for this case was the No. 13 from Stability Booklet. Which correspond with the ship in situa-tion of departure condisitua-tion (harbour) and fully loaded condition. In this condition the water ballast tanks are empty. Following is showing the values corresponding to maximum shearing force and maximum bending moment, for shear for the value is equal to 25905 Kn. For the maximum bending moment in sagging condition the value is equal to 1212251 Kn-m. The Table 4 shows the main data for this condition.
Table 4. Fully loaded cond. dep. full bunker.
______________________________________________
[image:4.595.312.564.625.773.2]149 Next Poseidon results will be presented, moments of inertia, section modulus on bottom and deck, bending moments and shear forces. Table below shows the normal tensions and the difference of er-ror obtained from Poseidon and Ansys®.
Table 5. Results comparison. Normal
Ten-sion DNV-GL (MPa)
Normal Ten-sion ANSYS
(MPa)
Error (%)
Deck 37.22 35.83 3.73
Bottom 26.62 23.80 10.59
Bearing in mind that the criteria followed was pro-posed by the International Association of Classifi-cation Societies (IACS). The results presented in the Table 5 shown that the percentage of error ob-tained is not significant, therefore in this case it is possible to conclude that the model represents the investigates vessel structure behaviour with ac-ceptable accuracy, allowing to analyse the damage conditions.
[image:5.595.314.568.188.304.2]As it was mentioned at the beginning of this sec-tion, a study of the behaviour of the structure has been done, with the intention to evaluate the behav-iour of the structure. The structure analysed corre-spond with a transversal section located in the mid-dle of the area of the damage condition 2, on the hull bottom and crossing from side to side the ship. Figure 9 shows this section. The test allows the comparison between stresses obtained for intact case and for the reduction of 40, 60 and 80% of Young Modulus.
Figure 9. Damage condition.
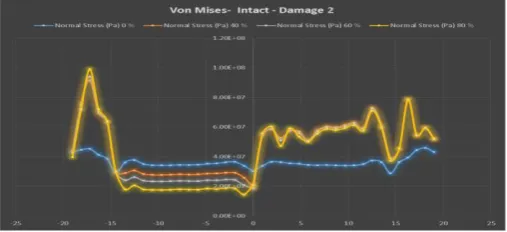
Attending Figure 10, left side corresponds with the portside of the ship. The blue line represents the in-tact condition, the orange line stand for reduction of 40% of Young Modulus, the grey line refereeing to the reduction of 60% and the last line related to yel-low colour corresponds with the reduction of 80%.
Observing the behaviour of the blue line from left to right side, the distribution of the stress is symmetric, with approximate values of stress equal to 40 MPa. Attending the other lines from 0 m to – 15 m from centreline, it is observed a progressive reduction of stress in the rest of the lines, showing a maximum reduction for yellow line with a value of 20 MPa.
Now the attention is centred from -15 m to -20 m which corresponds with port side, the stress in this area is equal to 100 MPa and from 0 m to 20 m cor-responding to starboard side with an approximate value of 60 MPa. In conclusion, these differences are found, because the elements affected for the re-ductions of mechanical properties absorb less stress. Therefore, the structure of the starboard side has to support the stress that cannot be absorb by the structure with the reduction of mechanical properties.
Figure 10. Von Mises Intact and Damage condition 2.
5 RESULTS FOR INTACT AND DAMAGE
CONDITIONS VON MISES STRESS ANALYSIS
The results presented in this section have been ob-tained following the instructions guidelines of IACS. The verification of results against the ac-ceptance criteria is to be carried out in accordance with Table 6, which establish the Maximum per-missible stress.
Table 6. Maximum permissible stresses.
Structural component Yield utilization factor Internal structure in
tanks
Plating of all non-tight struc-tural members including transverse web frame struc-ture, wash bulkheads, internal web, horizontal stringers, floors and girders. Face plate of primary support members modelled using plate or rod elements.
λy ≤ 0.8 (load
combination S)
Structure on tank boundaries
Plating of deck, sides, inner sides, hopper plate, bilge plate, plane and corrugated cargo tank longitudinal bulk-heads. Tight floors, girders and webs.
λy ≤ 0.72
(load combination S)
Plating of inner bottom, bot-tom, plane transverse heads and corrugated bulk-heads.
λy ≤ 0.64
(load combination S)
Where:
λy yield utilization factor = σvm/ σyd
σvm = Von Mises stress calculated based on membrane
[image:5.595.31.288.465.567.2]150
σyd = specified minimum yield stress of the material, in N/mm2
S = Static condition
[image:6.595.314.567.181.283.2]The Table 7 shows the results concerning the max-imum value of Von Mises Stress for each load con-dition. Analysing Table 8 results, it is possible to conclude that when a reduction of 40% of Young Modulus is applied the stress values remain similar, with a maximum difference of 2 MPa with respect to the Intact Case. For the reduction of 60% it is possible to appreciate a considerable increase, in this case the maximum difference is of 25 MPa. For the last reduction of 80% this increase is more sig-nificant, obtaining a maximum difference of 68 MPa.
Table 7. Von Mises stress results
Von Mises Stress I.C. D. C. 1 D. C. 2 D. C. 3
Young Modulus
Reduction 0 % 166 MPa - - -
Young Modulus
Reduction 40 % - 167 MPa 167 MPa 168 MPa
Young Modulus
Reduction 60 % - 182 MPa 184 MPa 191 MPa
Young Modulus
Reduction 80 % - 214 MPa 218 MPa 234 MPa
Figures 11-15 bellow show Von Misses stress plots on the finite element analysis carried out in Ansys®. The figures selected correspond with the maximum values obtained for intact and damage conditions.
It is necessary to specify that due to amount of material obtained from the analysis conducted, it has not been possible to include all plots obtained for the different reductions of Young Modulus. For this reason, it has been excluded the reductions cor-responding to 40 and 60% for all damage condi-tions. Considering sufficient the inclusion only the reduction percentage which has more repercussion in the values of the Von Mises results for all dam-age cases, that corresponds with the Young Modu-lus reduction of 80%.
[image:6.595.30.283.253.362.2]To the left of each figure there is a coloured scale, which represents the stress levels plotted on the structure sketch. The Figures 11, 12, 13 and 14 correspond the Von Mises Stress for intact condi-tion and damage condicondi-tion with a reduccondi-tion of 80% of Young Modulus.
Figure 11. Von Mises Stress – intact condition.
[image:6.595.312.568.326.428.2]Figure 12. Von Mises Stress – Damage condition 1 – 80 % reduction Young’s Modules.
Figure 13. Von Mises stress – damage condition 2 – 80 % re-duction Young’s modules.
Figure 14. Von Mises Stress – Damage condition 3 – 80 % reduction Young’s Modules.
[image:6.595.314.567.562.707.2]The first condition analysed correspond to the in-tact condition, knowing that the maximum stress is affecting the area located in the starboard side be-low the inner bottom as shown Figure 15. For this area has been applied a value of yield utilization factor of 0.72 for its validation.
[image:6.595.32.287.648.758.2]151 Table 8. Von Mises results.
Reduction σvm
N/mm2
σyd
N/mm2 λy ≤ 0.72
(I.C.)
0 % 166 250 0.664
40 % - - -
60 % - - -
80 % - - -
The data showed in the table above shown the re-sult obtained for yield utilization factor λy is minor to 0.72, which means the stress obtained is permis-sible according the criteria established in Table 6.
[image:7.595.30.288.41.128.2]The next results correspond with the damage condition 1 (D.C.1). According Figures 12 and 16 corresponding to port side, it is possible to observe that areas with maximum stress are located between the intersection of the double bottom and the trans-versal bulkhead. Regarding to permissible stress, the yield utilization factor applied was equal to 0.72, the results are shown on the Table 9.
Figure 16. Starboard Damage condition 1.
The data exposed in Table 9 shown the results ob-tained for yield utilization factor, for a reduction of 40% the stress obtained is permissible, the opposite occur for the reductions of the 60 and 80%, which in both cases exceeded the factor.
Table 9. Von Mises results.
Reduction σvm
N/mm2 σyd N/mm2 λy ≤ 0.72
(D.C.1)
0 % - - -
40 % 167 250 0.668
60 % 182 250 0.728
80 % 214 250 0.856
Next results correspond with the damage condition 2 (D.C.2). According Figures13 and 17, the area with maximum stress is the starboard side in this case between the double bottom and the transversal bulkhead, to study the permissible stress has been applied a yield utilization factor of 0.72, the results are shown in Table 10.
Figure 17. Starboard Damage condition 2.
Table 10. Von Mises results.
Reduction σvm
N/mm2 σyd N/mm
2 λy ≤ 0.72
(D.C.2)
0 % - - -
40 % 167 250 0.668
60 % 184 250 0.728
80 % 218 250 0.856
[image:7.595.33.287.310.456.2]The table above illustrates that for the reduction of 40%, the stress obtained is permissible, but for the reductions of 60 and 80% the stress factor is ex-ceeded.
Figure 18. Starboard Damage condition 3.
Last results correspond with damage condition 3 (D.C.3). Figures 14 and 18 shown the areas with maximum stress, located these on the starboard side in this case between the double bottom and the transversal bulkhead, to study the permissible stress has been applied a yield utilization factor of 0.72, the results are shown on the Table 11.
Table 11. Von Mises results.
Reduction σvm
N/mm2 σyd N/mm
2 λy ≤ 0.72
(D.C.2)
0 % - - -
40 % 168 250 0.672
60 % 191 250 0.764
[image:7.595.314.569.379.516.2]152
6 CONCLUSIONS
The conclusions from the static analysis done for the finite element model of Aframax oil tanker, concerning intact condition, damage condition 1, damage condition 2 and damage condition 3, will be showed below. The validation of the results was done following the guidelines Common Structural Rules for Bulk Carriers and Oil Tankers issued by IACS (2012), which in its chapter 9 presents the method in order to assess the hull structure strength using the finite element method. The loading condi-tion selected from stability booklet was No. 13, which correspond with the situation of departure (harbour) and fully loaded condition (sagging). For this condition the water ballast tanks are empty and cargo tanks are fully loaded.
Following the guidelines, three cargo holds have been modelled to represent the midship section of the ship. The structure consists of shell elements representing plates and beam elements representing stiffeners. The Finite Element code of Ansys® was used to analyse the structure. The generated number of nodes was equal to 75049 and 49525 elements. The validation of the 3D model and the results ob-tained in Ansys® have been analysed and validated by using DNV-GL software “Poseidon”; it is a software used to evaluate the strength of ship hull structures. Attending the analysis done for intact condition, with a maximum stress value equal to 166 N/mm2 located bellow the double bottom and bilge plates, as shows the Figure 15, and the value of yield utilization factor equal to 0.72, it is possi-ble to conclude that the ship satisfies the require-ments stablished by IACS (2012). According to the previously mentioned in this paragraph, this study concludes that the ship can sailing in a safe way.
For the damage condition 1, 2 and 3 under reduc-tion of 40% of the mechanical properties, the Ta-bles 9, 10 and 11 show that the values of yield uti-lization factor are below of 0.72; therefore, the ship satisfies the requirements stablished by IACS (2012). For that reason, this study denotes that the ship can sailing in a safe way. For the damage con-dition 1, 2 and 3 under reduction of 60% and 80% of the mechanical properties, the Tables 9, 10 and 11 show that the values of yield utilization factor are above of 0.72, therefore, the ship does not pass the requirements stablished by IACS (2012). In consequence this study suggests that the main re-sponsible of the ship has to stop of sailing, and car-ry out a close up inspection to identify and evaluate the damages produced. To conclude, this study has achieved the objectives established. The “hot spots” areas subjected to highest stress have been success-fully identified, exposing the highest stresses val-ues, at the same time that give the necessary sug-gestion to carry out in case of damage.
ACKNOWLEDGMENTS
This paper is partially funded by INCASS project. INCASS has received research funding from the European Union’s Seventh Framework Programme under grant agreement No. 605200. This publica-tion reflects only the author’s views and European Union is not liable for any use that may be made of the information contained herein.
REFERENCES
Ahmet H. Ertasa, Veysel Alkanb, Ahmet Fatih Yilmazc 2014. Finite Element Simulation of a Mercantile Vessel Shipboard Under Working Conditions. Procedia Engineering 69: 1001-1007.
Alice Mathai, Alice T.V., Ancy Joseph 2013. Shear Strength Assessment of Ship Hulls. International Journal of Engineering and Innovative Technology (IJEIT) Volume 2, Issue 8: 161-165.
Alice Mathai, George John P., Jini Jacob 2013. Direct Strength Analysis of Container Ships. International Journal of Engineering Research and Development, Volume 6, Issue 5: 98 -106.
Anuar AbuBakar, R.S. Dow 2013. Simulation of ship grounding damage using the finite element method. International Journal of Solids and Structures 50: 623– 636.
Ansys 16. 2015. Mechanical User's Guide. Ansys suite 16. 2015.
C. Pollalis & M.S. Samuelides 2013. Ultimate strength of damaged hulls. Collision and Grounding of Ships and Offshore Structures: 297-304.
European Maritime Safety Agency 2015. Annual Overview of Marine Casualties and Incidents 2015.
Gaspar, A.P. Teixeira & C. Guedes Soares 2016. Sensitivity analysis of the IACS-CSR buckling strength requirements for stiffened panels. Maritime Technology and Engineering 3: 459-470.
Hadi K.K. Amlashi, Torgeir Moan 2008. Ultimate strength analysis of a bulk carrier hull girder under alternate hold loading condition – A case study Part 1: Nonlinear finite element modelling and ultimate hull girder capacity. Marine Structures xxx: 1–26.
Huynh Van-Vu 2015. Prediction the Ultimate Longitudinal Strength of Intact Ship by Finite Element Method. International Journal of Mechanical. Engineering and Applications. Special Issue: Transportation Engineering Technology. Vol. 3, No. 1-3: 18-23.
Diewald, B. Gerlach & S. Ehlers 2016. On the influence of primary and secondary structural members on the global strength of ship structures. Maritime Technology and Engineering 3: 435-441.
Dimitris Servis, George Voudouris, Manolis Samuelides, Apostolos Papanikolaou 2003. Finite element modelling and strength analysis of hold No. 1 of bulk carriers. Marine Structures 16(8): 601–626.
M. Heinvee & K. Tabri, M. Kõrgesaar 2013. A simplified approach to predict the bottom damage in tanker grounding. Collision and Grounding of Ships and Offshore Structures: 161-169.
153
ISSC 2015. International Ship and Offshore Structure Congress: committee III.1: Ultimate Strength.
Okumoto, Y., Takeda, Y., Mano, M., & Okada, T. (2009). Design of ship hull structures . (Springer, Ed.) Higashi, Oiroshima, Japan.
Y. Lakshmi Prasanna, Dr. Amar Nageswara Rao 2015. Ship Hull Structure Analysis in Ansys. International Journal of Scientific Engineering and Technology Research, Col.04, Issue 33: 6698-6701.
Yoshiteru Tanaka, Hiroaki Ogawa, Akira Tatsumi & Masahiko Fujikubo 2015. Analysis method of ultimate hull girder strength under combined loads. Ships and Offshore Structures, Vol. 10, No. 5: 587–598.
S. Benson, M. Syrigou & R.S. Dow 2013. Longitudinal strength assessment of damaged box girders. Collision and Grounding of Ships and Offshore Structures: 305-314.
Ship Structure Committee. (1996). Guideline for evaluation of finite element and results.
S.G. Lee, S.H. Jun & G.Y. Kong 2013. Modeling and simulation system for marine accident cause investigation. Collision and Grounding of Ships and Offshore Structures: 39-47.
Suman Kar, D.G. Sarangdhar & G.S. Chopra 2008. Analysis of ship structures using ansys. SeaTech Solutions International (S) Pte Ltd.
Y. Garbatov, S. Saad-Eldeen 1 , C. Guedes Soares 2015. Hull girder ultimate strength assessment based on experimental results and the dimensional theory. Engineering Structures 100: 742–750.