Automatic Quantification of Vocal Cord Paralysis
An Application of Fibre-Optic Endoscopy Video Processing
Radhika Menon
1, Lykourgos Petropoulakis
1, John J. Soraghan
1, Heba Lakany
2, Kenneth
MacKenzie
3, Omar Hilmi
3and Gaetano Di Caterina
11Department of Electronic & Electrical Engineering, University of Strathclyde, 204 George Street, Glasgow, U.K. 2Department of Biomedical Engineering, University of Strathclyde, 106 Rottenrow East, Glasgow, U.K.
3NHS Greater Glasgow & Clyde, Glasgow, U.K.
{radhika.menon, l.petropoulakis, j.soraghan, heba.lakany, gaetano.di-caterina}@strath.ac.uk, [email protected], [email protected]
Keywords: Motion Estimation, Automatic Segmentation, Computer-assisted Diagnosis, Fibre-optic Endoscopy, Vocal Cord Motion.
Abstract: Full movement of the vocal cords is necessary for life sustaining functions. To enable correct diagnosis of reduced vocal cord motion and thereby potentially enhance treatment outcomes, it is proposed to objectively determine the degree of vocal cord paralysis in contrast to the current clinical practice of subjective evaluation. Our study shows that quantitative assessment can be achieved using optical flow based motion estimation of the opening and closing movements of the vocal cords. The novelty of the proposed method lies in the automatic processing of fibre-optic endoscopy videos to derive an objective measure for the degree of paralysis, without the need for high-end data acquisition systems such as high speed cameras or stroboscopy. Initial studies with three video samples yield promising results and encourage further investigation of vocal cord paralysis using this technique.
1 INTRODUCTION
The co-ordinated movement of the vocal cords in the human throat facilitates breathing, swallowing and voice production. Partial or complete paralysis of the vocal cords adversely affects these vital functions. In order to appropriately treat this condition, it is essential to determine the degree of paralysis as accurately as possible. However, in the current clinical practice, the judgement of the extent of paralysis is made subjectively by visual inspection of the vocal cords using endoscopy. It is therefore challenging for clinicians to ascertain and evaluate the paralysis, particularly in the case of slight partial paralysis. Therefore, an objective assessment technique based on video processing is proposed in this paper, to automatically quantify vocal cord paralysis, in order to aid and enhance current diagnostic practices.
A number of approaches have been developed to quantify vocal cord motion such as Glottal Area Waveform or GAW (Panek et al., 2015; Woo, 2014; Gonzalez et al., 2013), phonovibrography (Lohscheller et al., 2008), kymography (Švec &
nasal insertion of the endoscope allows the vocal cords to be viewed in a natural position and is better tolerated by patients.
Therefore, in our study we aimed to exploit the flexible fibre-optic endoscope videos to analyse vocal cord abduction and adduction, in order to derive a measurable descriptor of vocal cord paralysis. To the best of our knowledge, an automated algorithm developed for this purpose has not been reported yet in the literature.
The algorithm proposed in this study caters to two main challenges. Firstly, the techniques for quantification of vocal cord motion using vibration analysis cannot be directly applied to the slower abduction/adduction movements of paralysed vocal cords. For example, the accuracy of GAW based methods and the phonovibrography is limited by the precise identification of the glottal midline (Karakozoglou et al., 2012). Determining the midline becomes challenging when there is a shift in the position of the arytenoids (anatomical structures bordering the posterior side of the glottal area in a laryngeal image). Moreover, the normal vocal cord may cross the midline when adducting, in an attempt to compensate for the reduced motion of the abnormal vocal cord. For these reasons, for the work presented in this paper, we resorted to a technique that was not based on the identification of the midline or glottal area. The movement of each vocal cord is tracked using an optical flow algorithm and features are extracted from the resulting flow vector patterns. In (Zorrilla et al., 2012), a block matching technique has been used to differentiate between normal and paralysed vocal cords but the degree of paralysis was not measured by the authors. Secondly, the videos acquired using the flexible fibre endoscope are of poorer image quality than those recorded with the rigid laryngoscope. Therefore, video pre-processing is required to remove artefacts and enhance the image frames to enable proper segmentation of the vocal cord edges. The remainder of the paper is organised as follows: Section 2 explains the methodology for data acquisition, pre-processing, ROI detection and motion estimation using the optical flow technique. Section 3 contains the results and discussion. Finally, Section 4 concludes the paper and provides the course of future work.
2 METHODOLOGY
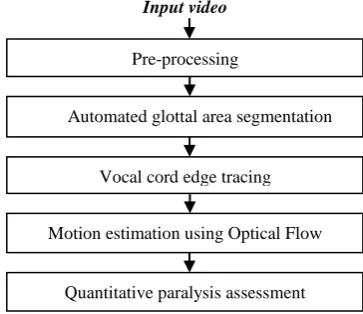
An outline of the methodology is provided in Figure1 and is explained in detail in the following subsections.
2.1 Data Acquisition
Routine clinical video data were acquired with the consent of the subjects. The motion of the vocal cords was acquired by inserting a flexible fibre-optic endoscope through the nose and recording the scene using a 25 frame per second camera. RGB video frames of resolution 768x576 were produced. Figure 2 provides some sample frames of the raw data. The subject was asked to phonate making an "ee" sound, followed by taking a deep breath. This sequence was performed at least twice. A database consisting of 10 videos of approximately 30 seconds’ duration each of normal and paralysed vocal cords has been created in our study so far. In this paper, we use 3 videos (2 normal and 1 severe right palsy cases) from this database, with an aim to provide a proof of concept for automated processing of fibre-optic videos and quantification of left-right motion symmetry of vocal cords.
[image:2.595.318.500.405.562.2]Figure 2: From left to right - selected frames from raw video sequence of right vocal cord palsy showing maximally adducted to maximally abducted positions, and zoomed region showing the right and left vocal cords, marked with ‘R’ and ‘L’, respectively.
Figure 1: Overview of proposed technique.
Input video
Pre-processing
Automated glottal area segmentation
Vocal cord edge tracing
Motion estimation using Optical Flow
[image:2.595.311.521.611.655.2]2.2 Video Pre-Processing
After extracting the image frames from a video, a sequence of frames representing abducted (opened) vocal cords were manually selected. This sequence of frames was provided as input to the automated algorithm developed in this study using MATLAB.
A honey-comb structure is observed in the original image frames as seen in Figure 3. This artefact is produced due to the sub-sampling of the scene by the amount of glass fibres present in the fibre-optic bundle. It was eliminated by spectral filtering using a star shaped band stop filter (Winter et al., 2006). The filtered image was smoothed with a wiener filter. Figure 3 shows the resultant image.
The next step in the pre-processing stage served the purpose of automatically stabilising the video as well as cropping the region of interest from each frame. Video stabilisation is required to minimise the translational movement of the vocal cords from frame to frame due to the motion of the larynx itself or that of the endoscope. Since the structures in the larynx are mostly pink or red coloured, only the red channel was used for data processing from this stage onwards. The technique involved manually selecting a template containing the region of interest (ROI) in the first frame and then applying normalised cross correlation to find the best match for this template in the second frame. Subsequently, the ROI located in the second frame was used as the template to search for the ROI in the following frame, and then the process was automatically repeated for all the frames. This resulted in a new video sequence where every frame comprised the ROI centred in the frame. Figure 4a provides a sample image of normal vocal cords from a pre-processed video sequence.
2.3 Glottal Area Segmentation
[image:3.595.311.513.93.190.2]The glottal area can be segmented with the knowledge that it appears darker than the surrounding anatomical structures due to limited illumination. A two-phase procedure was used to segment the glottal area. In the first phase, a preliminary segmentation of the glottal area was obtained by thresholding using a non-linear transform, followed by the use of morphological operations including dilation, boundary object removal, hole filling and selecting the largest object in the image. In the second phase, the segmented regions were used as masks to provide an initial contour for an active contour algorithm (Kass, 1988), to identify the glottal area boundaries more accurately.
Figure 3: Left- cropped section of original RGB image to illustrate the honey-comb structured artefact caused by the fibre-optic bundle; Right: pre-processed image with artefact suppressed.
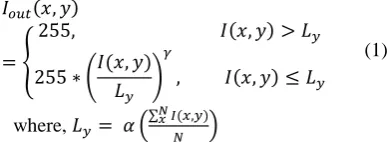
A non-linear transform, shown to be effective in the presence of uneven illumination (Andrade-Miranda et al., 2015) was used for thresholding the image. Consider an image with intensity I(x,y)∈ [0, 255], where x = 1,2,…,N and y = 1,2,…,M denote the number of a pixel in the horizontal and vertical directions, i.e., column and row numbers, resp. The transformed image is computed as follows:
𝐼𝑜𝑢𝑡(𝑥, 𝑦)
= {
255, 𝐼(𝑥, 𝑦) > 𝐿𝑦
255 ∗ (𝐼(𝑥, 𝑦) 𝐿𝑦
) 𝛾
, 𝐼(𝑥, 𝑦) ≤ 𝐿𝑦
(1)
where, 𝐿𝑦= 𝛼 ( ∑ 𝐼(𝑥,𝑦)𝑁𝑥
𝑁 )
The factor Ly accounts for the row-wise varying lighting conditions. The parameters α and γ were determined empirically to be 1.5 and 2, respectively. Figure 4b illustrates the binarised image using this technique. Note the glottal area localised in the centre of the image.
Thereafter morphological operations were performed on the binarised images, commencing with dilation operation. The images were then complemented and boundary object removal was performed because the glottal area is not expected to be near the image borders, as the ROI has been centred in the frames. Consequently, holes were filled and finally all the objects except the largest one were erased. The resultant image after all the morphological operations is shown in Figure 4c.
Active contours have shown to be successful in glottal area segmentation and was therefore adopted as the technique for the final segmentation (Karakozoglou et al., 2012; Yan et al., 2006). The method is an energy minimisation scheme that is used to detect the boundary of objects by curve evolution influenced by internal and external factors (Kass, 1988). The energy of a curve 𝑣𝑠 = (xs, ys) is
[image:3.595.322.516.355.426.2]𝐸𝑠 = ∫ (𝐸𝑖𝑛𝑡(𝑣𝑠) + 𝐸𝑖𝑚𝑎𝑔𝑒(𝑣𝑠) + 𝐸𝑐𝑜𝑛(𝑣𝑠)) 1
0
𝑑𝑠
(2) The internal spline energy, Eint, provides a measure of the tension and rigidity of the curve during bending. Eimage results in the curve being pulled towards lines, edges and corners. Econ represents the energy of the external constraint forces that influence the curve being attracted to local minima. The algorithm is initially provided as input a contour that closely matches the boundary to be detected; thereafter the curve is deformed by iteratively minimising its energy. Figure 4d provides the final contour bordering the glottal area detected by the active contour algorithm.
2.4 Vocal Cord Edge Tracing
In order to discard non-vocal-cord structures bordering the segmented area, empirically determined values of 40% and 5% of the vertical contour length were used to erase the top and bottom sections, resp., of the extracted boundary. This resulted in two curves, each corresponding to one vocal cord edge, as shown in Figure 4e. Note the left edge of the extracted boundary corresponds to the anatomic right vocal cord edge and vice versa.
2.5 Optical Flow Analysis
The movement of the vocal cord edges between successive frames were computed using the optical flow algorithm, which provides an approximation to the velocity field associated with each pixel in an image sequence. By assuming that pixel intensities are translated spatially between consecutive time frames, the velocity of a pixel can be computed using a least squares estimation (Barron et al., 1994) over a window of neighbouring pixels. For each block the following squared error is minimised:
∑ 𝑊2[𝐼
𝑥𝑣𝑥+ 𝐼𝑦𝑣𝑦+ 𝐼𝑡]
2 (3)
where, Ix and Iy are spatial image intensity gradients,
It the intensity gradient over time, and vx and vy the horizontal and vertical pixel velocities, resp. W is a weighting function to focus on constraints centred in the window and is implemented as a 5x5 kernel with 1D weights (0.0625, 0.25, 0.375, 0.25, 0.0625) in the horizontal and vertical directions. The arrows, in the enlarged view of the image in Figure 4f, depict the motion velocities of the vocal cord edges.
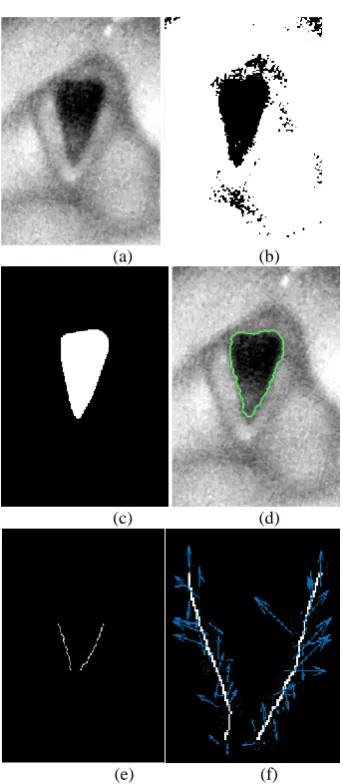
(a) (b)
(c) (d)
(e) (f)
Figure 4: Demonstration of methodology with a sample image frame of normal vocal cords: (a) Pre-processed image (b) Image thresholded using non-linear thresholding (c) Result after morphological operations on image b (d) Segmented glottal area by applying active contour method using image c as initial mask (e) Left and right vocal cord edges (note that the edge appearing on the left side of the image is the anatomical right vocal cord edge) (f) zoomed view of flow vectors indicating motion of vocal cords compared to the previous frame in the image sequence.
2.6 Quantitative Assessment
[image:4.595.324.496.85.478.2]magnitude in the image sequence. Each signal can be considered as a signature or pattern of the motion of a vocal cord. A feature known as the waveform length, which has been widely used in EMG signal processing (Hudgins et al., 1993), was then calculated for the left and right sides. It is the cumulative length of a signal and provides a measure of waveform complexity. Finally, the contribution of each vocal cord to the overall motion is computed by the following equation:
𝐶𝑙=
𝑊𝐿𝑙 𝑊𝐿𝑙+ 𝑊𝐿𝑟
×100% (4)
where, Cl represents the contribution of the left vocal cord edge to the overall motion occurring in the image sequence, WLl and WLr are the waveform lengths of the left and right vocal cords, respectively. Similarly, Cr can be calculated. Normal vocal cords move in synchronisation with each other and therefore motion symmetry can be used as an indicator of normal functioning.
3 RESULTS AND DISCUSSION
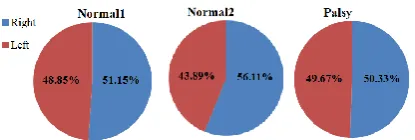
The results from applying the proposed algorithm to two normal cases and one right palsy patient are provided in Figure 5. The plots in Figures 5a and 5b show the mean flow magnitudes for individual vocal cords. It is observed that the blue waveform in the graph in Figure 5b, associated with the right vocal cord of the palsy subject, is smaller than the red one. An objective measure of the degree of paralysis is provided in Figure 5c. The measure depicts the contribution of a vocal cord to the total motion in the image sequence and is expressed in percentage. It is obvious that the normal cases demonstrate almost equal contribution by both vocal cords, whereas the palsy case shows reduced motion of the right vocal cord.
While these results appear promising, further analysis of more videos needs to be performed in order to derive a calibrated measure that corresponds to the degree of paralysis identified by clinicians. This shall be done in future work and validation of the results by comparing with subjective evaluation by experienced clinicians will also be performed. Moreover, to achieve a robust quantitative assessment tool, other features that can be extracted from the motion vectors shall also be investigated.
In order to prove the advantage of our method over other midline based approaches such as the GAW, a similar measure of contribution to motion
using the waveform length was computed - but instead of using the motion magnitudes as the signature, the glottal area waveforms of the left and right sides were used to calculate the waveform length. The left and right sides were determined automatically by fitting an ellipse on the segmented glottal area and assigning its major axis length as the midline of the glottal area (Panek et al., 2015). As can be observed in Figure 6, the glottal area technique is inappropriate for identifying paralysis of the vocal cords.
(a) Subject: Normal1
(b) Subject: Palsy
[image:5.595.316.515.229.647.2](c) Left to right: Normal1, Normal2, Palsy
Figure 6: Quantitative measures using Glottal Area Waveform (GAW) as a signature of motion in the image sequence.
4 CONCLUSIONS
Our work emphasises the use of data acquisition procedures which are widely used in hospitals worldwide, in order to develop a generalisable technique that can be seamlessly integrated with current clinical practices, rather than utilising state-of-the-art systems for developing techniques that have limited scope of implementation outside the laboratory. Towards this end, we aimed to utilise the commonly used fibre-optic videos in order to assess abduction/adduction movements of the vocal cords as done by clinicians in the current clinical practice. However, the diagnosis can be enhanced by introducing quantitative measures, potentially being useful for trainees or for very challenging cases, particularly where the degree of paralysis is subtle or where there may be subtle pathology of a vocal cord affecting its movement.
Our results are very encouraging to further analyse fibre-optic endoscopy videos for quantification of vocal cord paralysis using motion estimation techniques.
REFERENCES
Andrade-Miranda, G. et al., 2015. An automatic method to detect and track the glottal gap from high speed videoendoscopic images. BioMedical Engineering OnLine, 14(1), p.100. Available at:
http://www.biomedical-engineering-online.com/content/14/1/100.
Barron, J.L. et al., 1994. Performance of optical flow techniques. Proceedings 1992 IEEE Computer Society Conference on Computer Vision and Pattern Recognition, 12(1), pp.236–242. Available at: http://ieeexplore.ieee.org/lpdocs/epic03/wrapper.htm? arnumber=223269.
Gonzalez, J., Wood, S. & Yan, Y., 2013. Fourier descriptor based diagnosis of vocal-fold partial asymmetry from high speed image sequences.
Conference Record - Asilomar Conference on Signals, Systems and Computers, pp.263–267.
Hudgins, B. et al., 1993. A new strategy for multifunction myoelectric control.pdf. , 40(I), pp.82–94.
Karakozoglou, S.Z. et al., 2012. Automatic glottal segmentation using local-based active contours and application to glottovibrography. Speech Communication, 54(5), pp.641–654.
Kass, 1988. Snakes: Active Contour Models. International Journal of Computer Vision, pp.321–331.
Lohscheller, J. et al., 2008. Phonovibrography: Mapping high-speed movies of vocal fold vibrations into 2-D diagrams for visualizing and analyzing the underlying laryngeal dynamics. IEEE Transactions on Medical Imaging, 27(3), pp.300–309.
Panek, D. et al., 2015. Voice pathology classification based on High-Speed Videoendoscopy. Proceedings of the Annual International Conference of the IEEE Engineering in Medicine and Biology Society, EMBS, 2015–November, pp.735–738.
Švec, J.G. & Schutte, H.K., 2012. Kymographic imaging of laryngeal vibrations. Current Opinion in Otolaryngology & Head and Neck Surgery, 20(6), p.1. Verikas, A. et al., 2009. Advances in laryngeal imaging.
European Archives of Oto-Rhino-Laryngology, 266(10), pp.1509–1520.
Winter, C. et al., 2006. Automatic adaptive enhancement for images obtained with fiberscopic endoscopes.
IEEE Transactions on Biomedical Engineering, 53(10), pp.2035–2046.
Woo, P., 2014. Objective measures of laryngeal imaging: What have we Learned since Dr. paul moore. Journal of Voice, 28(1), pp.69–81. Available at: http://dx.doi.org/10.1016/j.jvoice.2013.02.001. Yan, Y., Chen, X. & Bless, D., 2006. Automatic tracing of
vocal-fold motion from high-speed digital images.
IEEE Trans Biomed Eng, 53(7), pp.1394–1400.
Available at:
http://www.ncbi.nlm.nih.gov/entrez/query.fcgi?cmd= Retrieve&db=PubMed&dopt=Citation&list_uids=168 30943.
Zhang, Y. et al., 2007. Quantifying the complexity of excised larynx vibrations from high-speed imaging using spatiotemporal and nonlinear dynamic analyses.
Chaos, 17(4).
Zorrilla, A.M. et al., 2012. Vocal folds paralysis clasiffication using flda and pca algorithms suported by an adapted block matching algorithm. In
[image:6.595.77.285.91.161.2]