• No results found

Towards unsupervised fluorescence lifetime imaging using low dimensional variable projection

N/A
N/A
Protected

Academic year: 2019

Share "Towards unsupervised fluorescence lifetime imaging using low dimensional variable projection"

Copied!
15
0
0

Loading.... (view fulltext now)

Full text

Loading

Figure

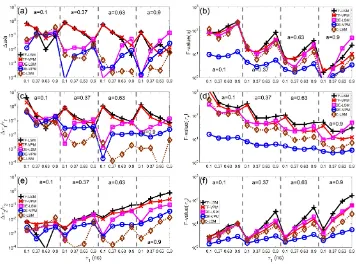
Fig. 1. (a), (c), and (e), Bias and (b), (d), and (f) F plots for different methods, K = 1,000, and N = 256
Table 1. Average fitting time of 16 decays for different methods.
Fig. 3. (a) Normalized bias and (b) F plots for τave = aτ1 + (1– a)τ2 when K = 1000. (c) Normalized bias and (d) F plots for τave when K = 50
Fig. 4. Measured IRF, measured and fitted histograms.
+3

References

Related documents