This is a peer-reviewed accepted author manuscript of the following research output: Nicolson, F., Jamieson, L. E., Mabbott, S., Shand, N. C., Graham, D., & Faulds, K. (2017). Through barrier detection of ethanol using handheld Raman spectroscopy—Conventional Raman versus
spatially offset Raman spectroscopy (SORS). Journal of Raman Spectroscopy, 48(12), 1828-1838. DOI: 10.1002/jrs.5258
Through Barrier Detection of Ethanol using
Handheld Raman Spectroscopy - Conventional
Raman versus Spatially Offset Raman Spectroscopy
(SORS)
Fay Nicolson
1, Lauren E. Jamieson
1, Samuel Mabbott
1, Neil C. Shand
2,
Duncan Graham
1, Karen Faulds
11.
Department of Pure and Applied Chemistry, Technology and
Innovation Centre, University of Strathclyde, 99 George Street, Glasgow
G1 1RD, UK.
2.
DSTL, Porton Down, Salisbury, SP4 0JQ, UK
.
Corresponding author:
Karen Faulds, Department of Pure and Applied Chemistry, Technology and Innovation Centre, University of Strathclyde, 99 George Street, Glasgow G1 1RD, UK.
E-mail: karen.faulds@strath.ac.uk
Abstract
Spatially offset Raman spectroscopy (SORS) provides chemical analysis at depth even when obscuring barriers such as plastic or tissue are present. As the collection probe is moved further away from the point of laser excitation, scattered photons from deeper layers begin to dominate the acquired spectra, thus giving rise to through barrier detection. Here we demonstrate the potential of conventional Raman (CR) and SORS for through barrier detection using handheld spectrometers. We report the collection of Raman signals from an ethanol solution through plastic at thicknesses of up to 21 mm using SORS in combination with multivariate analysis. SORS is compared to conventional Raman, where we also demonstrate impressive through barrier detection of ethanol at depths up to 9 mm. We also highlight the advantage of applying multivariate analysis for through barrier detection using CR or SORS, particularly when peaks with similar spectral features are present in both the barrier and analyte spectra. In addition, to the best of our knowledge, this is the first report of the assessment of the maximum level of through barrier detection using handheld CR and SORS instruments with a back-scattering geometry.
Keywords
Conventional Raman; SORS; through barrier detection; handheld
Introduction
The literature demonstrates the prevalent use of Raman spectroscopy in the fields of biomedicine [1–4] and defence applications.[5,6],[7] When applied in the backscattering
geometry, Raman spectroscopy is a promising analytical technique, generating a unique chemical fingerprint and providing sensitive sample evaluation. In spite of this, conventional Raman (CR) can be limited by sample volume and thickness, often failing to probe beneath the surface or through samples obscured by an opaque barrier.[8],[9]
deeper layers. Such drawbacks associated with CR arise from the fact that weak deep-layer Raman scattered photons are swamped by surface scattered photons, which consequently dominate the collected Raman spectrum. Deeper photons have longer to travel to reach their point of collection, and in addition, diffuse in multiple directions compared to surface photons. Consequently, the contribution of sub-surface layers to the collected spectrum is significantly smaller than that from the surface layers.
Spatially offset Raman spectroscopy (SORS) provides a means of subsurface analysis, even when obscuring barriers such as plastic or tissue are present.[9] By
varying the distance of the collection probe from the point of laser excitation (typically in the region of a few mm) it is possible to acquire Raman contributions from the subsurface layers. As a result, signals collected close to the point of laser excitation will be made up of a higher proportion of surface signal, however as the spatial offset increases, deeper layer photons will begin to dominate the spectra.[10]
Since first demonstrated by Matousek et al.,[9] SORS has shown promise in a number
of applications including the screening of pharmaceutical products obscured by packaging, [11], the investigation of obscured liquid explosives [12] and in assessing the
quality of transfusable red blood cells stored in plastic bags. [13] SORS has been
applied to the transcutaneous, [14] and in vivo, [15] analysis of bone and bone disease,
and, in the noninvasive biochemical analysis of cancerous calcifications in breast tissue. [16] Using an inverse SORS approach, the detection of paracetamol obscured
by 2 mm of polyvinylchloride has also been described. [11]
Bloomfield et al., compared backscattering CR with SORS for the detection of concealed substances. They obtained SORS scattering of ammonium nitrate obscured by 4.5 mm of ‘pearl’ polypropylene and detection of alcohol through 2 – 4 mm of coloured glass. [17] The authors commented on the limitations of CR for through
barrier analysis since the collected signal was often swamped by that of the packaging or fluorescence (in the case of glass). They noted that when the contents and packaging spectra do not overlap, it was possible to detect the analyte using CR, however this was inherently difficult and open to interpretation. The SORS technique has also been demonstrated at a laser excitation of 1064 nm where the advantage of a longer wavelength to overcome fluorescence issues, associated with the presence of glass barriers, was discussed. [18] Handheld CR with a 1064 nm laser excitation has
also been used for the assessment of packaged food substances susceptible to food fraud including saffron and beef. [19]
Currently, benchtop SORS spectrometers are located in several international airports for the detection of liquid explosives. [20] Handheld Raman spectrometers have
attracted increasing interest in recent years, namely due to their ease of use and portability, with many portable Raman instruments being available on the market.[6],[7],[19] Here we present a non-destructive way of obtaining Raman spectra
Experimental Instrumentation
CR measurements were carried out using a handheld CBEx spectrometer, 785 nm laser excitation wavelength, from Snowy Range Instruments. All measurements were obtained using a 3 s integration time, with 5 accumulations. A point and shoot adaptor with a single element lens and a numerical aperture of 0.5 was fitted for through barrier detection using CR. This gave an average laser power of 43 mW. The focal spot of the CBEx was measured using a beam profiler (BeamMap 2 – XYZ scanning slit system 190- 2500 nm, Data-Ray Inc). As shown in Fig. S1 (supporting information) it appears that the CBEx instrument used in this instance has a spot size of 50 – 60 microns at a focal distance of 0. 5 cm. SORS measurements were taken using a handheld Resolve instrument from Cobalt Light Systems (830 nm, average laser power 450 mW). All measurements were carried out using a 3 s integration time, 5 accumulations. The nose cone was fitted to use the instrument in a contact mode setting.
Through barrier detection
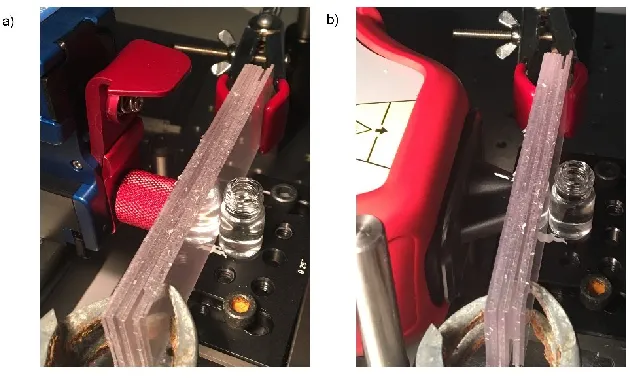
Large transparent polyethylene terephthalate (PET) and blue opaque coloured polypropylene (PP) plastic sheets were purchased from a local art store and then cut up into smaller rectangular pieces of (10.5 x 3 cm, thickness 1 mm). The sheets were mounted on a stage and clamped together to create the desired thickness. They were then brought into contact with the laser using either the point and shoot adaptor (CR spectrometer) Fig. S2(a) (Supporting Information) or the nose cone (SORS spectrometer) Fig. S2(b) (Supporting Information). This ensured there was no air/space between the plastic and instrument. A glass vial containing ethanol was placed behind the plastic sheets. The glass vials had a 15 mm diameter, 1 mm thickness and a height of 25 mm (including lid).
To determine the maximum thickness of plastic both instruments could detect ethanol through, measurements were carried out using varying thicknesses of plastic. For all CR measurements, the thickness of plastic was increased by 1 mm for each set of spectral acquisitions. For SORS measurements using PET, sets of spectra were taken at thicknesses of 5 mm increments then at every 1 mm thickness, until the maximum depth for through barrier detection was reached. For blue PP, measurements were taken at thicknesses of 2 mm then at 1 mm additions until the maximum thickness at which the instrument could detect the ethanol analyte was determined. For SORS measurements, at each thickness, the spatial offset was also changed from 1 mm to 8 mm (1 mm increments) to show the influence the spatial offset had on the depth penetration.
Data processing
at an offset of 8 mm (plastic and ethanol). Preprocessing involved truncating and scaling the spectra, before applying the first order derivative coupled with Savitzky-Golay smoothing. The first order derivative was used in PCA to remove slight variances in the background which were found to affect the resulting zero order PCA plots. [21], [22]
For SORS spectra, in addition to PCA, a scaled subtraction was also applied. Briefly, spectra were truncated and baselined using a high order polynomial which removed the fluorescent background. Polynomials were chosen on their ability to remove as much of the fluorescent background under the spectrum as possible. Following this, the surface spectrum (i.e. the signal detected at the zero positon) was removed from the subsurface spectrum (i.e. signal detected at the offset position) using a scaled subtraction. Data was subsequently smoothed.
Results and Discussion
Both handheld instruments (CR and SORS spectrometers) were compared for their ability to detect analytes through plastic barriers and we aim to show the maximum potential of each instrument for through barrier detection. Ethanol was chosen for this comparison since it is a common analytical standard and bottles containing alcohol are frequently subjected to screening in airports. Furthermore, it’s characteristic and strongest peak was spectrally similar to those found in the plastic barriers, thus allowing us to highlight the advantages of applying multivariate analysis for probing through plastic barriers. The focus of this paper is on the comparison of CR and SORS, and not the detection of specific analytes. It is noted that the depth penetration using both techniques (CR and SORS) will be dependent on the scattering efficiencies of both the analyte and barrier. Therefore, the maximum level of through barrier detection will differ when different plastics and analytes are used. To account for this, clear (PET) and opaque (PP) plastic were chosen to act as barriers.
The probing of ethanol through clear PET plastic using CR spectroscopy is shown in Fig. 1. Measurements of ethanol were initially taken at each thickness of clear plastic (1-11 mm) to determine the varying contribution of analyte and plastic in the acquired spectra with respect to plastic barrier thickness. The spectrum at the top of Fig. 1 represents the plastic reference and the bottom spectrum refers to ethanol. At thicknesses of 1 to 3 mm of plastic, the 885 cm-1 peak from ethanol clearly dominates
the acquired spectra. Beyond a thickness of 3 mm however, signal from the plastic (860 cm-1) begins to appear in the spectrum. This is expected since the working
distance of the CR instrument is arguably 2 – 7 mm, Fig. S2 (Supporting Information) and, unlike a microscope system, has a more relaxed focus, thus explaining why spectral contribution form the plastic is observed at even smaller thicknesses. As the thickness of the plastic barrier is increased, it becomes difficult to visually detect ethanol at thicknesses of 7 mm and beyond, since the plastic and ethanol peaks become hard to distinguish due to their close proximity to one another.
were truncated and scaled, before the first order derivative coupled with Savitzky-Golay smoothing was applied.
As shown in Fig. 2a, PCA score plots convincingly separate the samples containing ethanol up to thicknesses of 9 mm. This is compared to only 7 mm when detecting a spectral contribution from ethanol by eye. The two clusters represent the plastic reference (e.g. 8 mm thick plastic) and the ethanol sample obscured by the same thickness of plastic (e.g. 8 mm). As thickness increases, the score for PC1, which indicates the maximum variance, decreases, therefore demonstrating a decline in variability between the two samples Fig. 2 (a, c). Furthermore, the first derivative was also taken of the raw truncated, unprocessed spectra. Fig. 2 shows the first order derivative spectra of plastic reference samples at 9 mm, as well as ethanol obscured by plastic at thicknesses of 9 and 10 mm (b) and (d). Samples of ethanol obscured by plastic at thicknesses of 10 mm (Fig. 2d) show very little spectral difference in the region of 850 to 900 cm-1, thus indicating that the instrument is no longer able to detect
the ethanol through the plastic barrier. This is compared to thicknesses of 9 mm in (Fig. 2b), where the spectral differences in this region are more obvious. Therefore, using CR to detect ethanol through PET, it is possible to detect the analyte visually at thicknesses of 6 mm. More impressively, if multivariate analysis in the form of PCA is applied, ethanol detection is possible up to thicknesses of 9 mm.
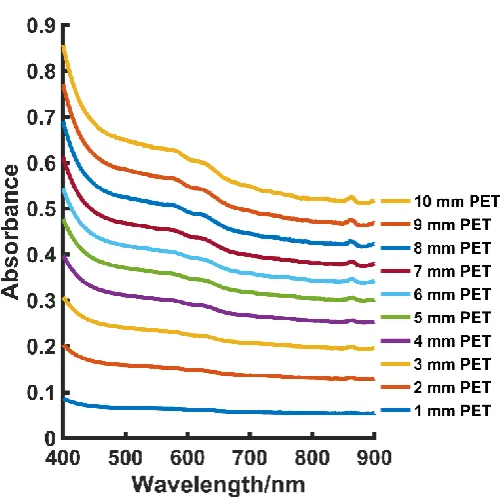
The absorption spectra for PET at thicknesses of 1 – 10 mm can be seen in Fig. S3 (supporting information). As shown, gradual absorption is taking place as the PET thickness increases. Based on this, it is assumed that not all the incident laser light is being transmitted to the ethanol analyte, particularly when larger thicknesses are involved. However, in comparison to PP of the same thickness, Fig. S6 (Supporting Information), PET is still a relatively non-absorbing material. Furthermore, PET is a commonly used plastic, particularly in the manufacture of plastic bottles, and will therefore be ubiquitous in a range of real world samples.
It is worth noting that the focal distance of the handheld CR instrument was fixed and non-adjustable. In addition, it was not possible to apply a different point and shoot adaptor lens with a greater (or lesser) focal distance. Unlike a microscope, a handheld device is often used in sub-optimal focus and therefore a longer working distance, with a relaxed focus, makes the device easier to use. If a point and shoot adaptor was available with a longer focal distance, it is feasible that through barrier detection would be achieved through even greater thicknesses using CR. This is particularly likely with regards to experiments involving PET since its more transparent nature will allow beam penetration to greater depths.
increase in spatial offset as the barrier thicknesses increases. Using this instrument, the ethanol specific peaks were observed at 882 cm-1, 1047 cm-1 and 1095 cm-1, with
the one at 882 cm-1 being the most intense and therefore easiest to track as the barrier
thickness was increased. In addition, using the SORS instrument, PET peaks were observed at 856 cm-1, 1115 cm-1, 1175 cm-1 and 1282 cm-1.
At a PET thickness of 5 mm (Fig. 3a), the characteristic ethanol peak at 882 cm-1 can
be seen as a small shoulder at an offset of 1 mm. At an offset of 3 mm and greater, ethanol dominates the acquired spectra, with the plastic component diminishing dramatically at this offset and beyond. At a thickness of 10 mm and an offset of 4 mm (Fig. 3b), ethanol begins to contribute visually to the obtained spectra, presenting as a small shoulder in the region of ~882 cm-1 due to the presence of the more intense
plastic peak at 856 cm-1. At offsets 5 – 8 mm a spectral contribution from the plastic
can still be seen, however the peak height ratio of plastic to ethanol decreases at 856 cm-1 and increases at 882 cm-1, indicating a greater influence of ethanol in the acquired
spectra. Ethanol can be seen most clearly in the spectra obtained at an 8 mm offset; the largest offset possible with the handheld SORS instrument. Therefore, from the graphs in Fig. 3(a – c) it is evident that as expected, when the barrier thickness is increased, spatial offset must also increase in order for through barrier detection to occur.
When PET thickness is increased to 15 mm (Fig. 3c), a shoulder in the plastic peak at 856 cm-1 can be seen in the region of ~882 cm-1 at an 8 mm offset. The presence of
ethanol at this thickness and spatial offset is confirmed by carrying out a scaled subtraction on the two-layer sample (Fig. 3d), which shows the presence of the ethanol analyte at 882 cm-1.
As described in the experimental section, a scaled subtraction was applied to data collected at a thickness of 15 mm at the 8 mm offset, Fig. 3d. Briefly, spectra were truncated and baselined using a high order polynomial. The spectra collected at the zero positon were removed from those collected at the offset using a scaled subtraction. The data was subsequently smoothed. Scaled subtractions are a useful tool, often applied in this instance to remove residual background signal, in this case PET. Whilst a scaled subtraction can usually provide satisfactory identification of the analyte, ethanol in this case, it has potential limitations such as prior knowledge of spectral bands, variations in background and researcher bias. To maintain consistency between spectra obtained using PET as a barrier to ethanol by means of CR or SORS, PCA was performed on the first order derivative spectra obtained by SORS using an offset of 8 mm for spectra collected at thicknesses of 15 mm and beyond. This aimed to establish the true depth to which SORS detection of ethanol could be achieved, particularly since the plastic and analyte had spectrally similar peaks in the same area.
b and d respectively. The loadings for PC1 can be seen in Fig. 4 (c and f). The PCA plot for 21 mm thick plastic shows clear separation of offset spectra (ethanol and PET plastic) from the spectra collected at the zero position (PET plastic). Averaged first order derivative spectra display clear spectral differences in the region of 875 – 885 cm-1. This is supported by the loadings in PC1 (Fig. 4c). Although plastic signal
accounts for the largest separation, a strong proportion of separation is coming from the ethanol peak at around ~880 cm-1, thus suggesting that the portable SORS
instrument is capable of seeing ethanol at this depth. Together with a scaled subtraction (Fig. S4a), (Supporting Information) which shows a peak at 882 cm-1,
SORS is convincingly capable of detecting ethanol through 21 mm of PET.
The PCA results through a PET thickness of 22 mm are shown in Fig. 4 d – f. Unlike the first order derivative spectra presented for 21 mm, no spectral differences can be seen in the region of 875 – 885 cm-1. There is however, slight differences in the spectra
between 840 – 850 cm-1. These are attributed to the plastic peak which is seen at a
maximum in the zero order spectra at 856 cm-1. This peak is displayed as
zero-crossing in the first order spectra, Fig. 4d. Despite evidence of separation between the signal collected at the zero positon (plastic) and that collected at the offset (ethanol and plastic), data collected at thicknesses of 22 mm and beyond, suggests SORS is not capable of detecting ethanol. This is also supported in the loadings for PC1 which show a definite separation as a result of variances in signal obtained from the plastic. Zero-crossing exists at 848 cm-1 which is due to the presence of a plastic peak,
however no zero-crossing exists at 882 cm-1, thus further suggesting that ethanol isn’t
being detected by the instrument.
In this instance, separation is most likely due to subtle differences in the plastic spectrum acquired at the zero and offset positions. This is plausible since photons collected at the zero and offset positions will have been scattered differently. Those collected at the offset position will have had further to travel to reach their point of collection and will have passed through several layers of plastic before being collected. This is in comparison to those collected at the zero position in a 180 degree back-scattered mode. Additionally, slight differences in the collection optics at the zero and offset position may also attribute to the small variations in the collected signal. The resulting scaled subtraction at 22 mm, Fig. S4b (Supporting Information), produces no definite peak at 882 cm-1 with the signal to noise ratio being too low to yield any useful
information, further confirming the maximum level to which detection can occur through this type of plastic. PCA was also performed at thicknesses beyond 22 mm e.g. 23 mm. Scores values were in a similar range to that of 22 mm. Additionally, first order derivative spectra show no spectral differences at 882 cm-1, harmonious with
those obtained at 22 mm (Fig. 4d). Coupled with scores plots consistent with the results seen in Fig. 4 d – f, it is believed that slight variations in collected plastic signal are responsible for the separation. It can therefore be said with high confidence, that it is possible to detect ethanol through 9 mm PET using handheld CR and, through PET thicknesses of 21 mm using handheld SORS.
5a, the ethanol peak at 885 cm-1 can be seen visually to depths of 2 mm. At a thickness
of 1 mm, the plastic peak at 875 cm-1 begins to become apparent in the acquired
spectra. Beyond 2 mm, the ethanol signal is lost to the competing plastic signal with little distinction between the two. Separation between the spectra of PP from that of ethanol obscured by PP at 2 mm is also confirmed in first order derivative PCA scores plots at this thickness Fig. S5 (Supporting Information). Therefore, using CR, ethanol obscured by PP can no longer be detected visually at thickness beyond 1 mm (Fig. 5a) and at thicknesses beyond 2 mm using PCA (Fig. 5b).
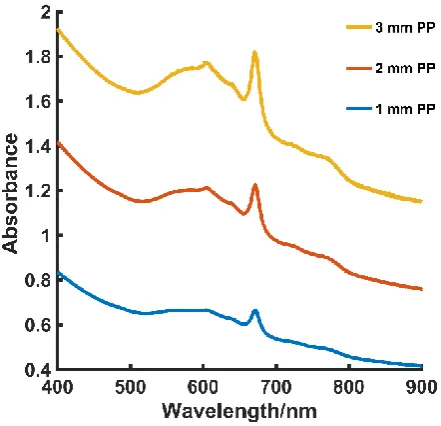
The absorption spectra of blue PP is shown in Fig. S6 (Supporting Information). It is apparent that absorption is occurring at 670 nm, which is expected since the sample is blue. In the CR spectra, the characteristic doublet at 810 cm-1 and 840 cm-1, which
is seen in the PP spectrum collected at 830 nm spectrum (Fig. 6) is missing. Instead, a sharp peak at 875 cm-1 is observed, Fig. 5. It is believed that the spectra at each PP
thickness collected using CR (785 nm) is perhaps a pre-resonance enhanced spectra of the dye with weak PP features superimposed. However, we aim to compare methods and not wavelengths for through barrier detection and thus see the plastic more simplistically, using it as a barrier to block the Raman signal from ethanol analyte using either CR or SORS. We are able to track the ethanol through the plastic barrier, detecting it spectrally by eye and then by PCA until separation no longer takes place, thus allowing for the assessment of CR for through barrier detection which is the main focus of this paper.
Conventional Raman i.e. barrier surface measurements were also carried out using the SORS instrument at the highest and lowest possible laser powers. At 450 mW, 830 nm, detection of ethanol was achieved through 4 mm of both PET and PP, Fig. S7 a and b (Supporting Information). This was compared to 3 mm PET and PP at a laser power of 60 mW, Fig. S7 c and d (Supporting Information), thus further demonstrating the advantages of the SORS technique. In this case, the optical properties of the plastic did not influence the level of through barrier detection, i.e. the instrument could see through the same thickness of clear plastic and blue plastic at each respective laser power. This is believed to be down to the characteristics of the beam used in the CR mode, which is presumed has a very short focal distance. Such optical approach however, is ideal for a SORS set up to ensure maximum discrimination between the barrier and analyte when the measurement at the zero position is carried out. This is discussed in greater detail in the supporting informaiton. Interestingly, at similar laser powers, this set up (SORS in a CR mode) can detect ethanol through fewer thicknesses of PET compared the specific CR spectrometer, thus highlighting the importance of focal distance with regards to through barrier detection using CR.
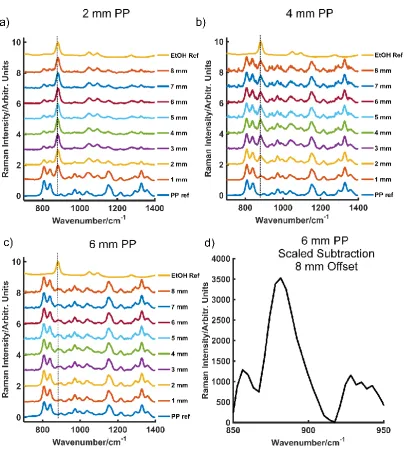
SORS was also performed on ethanol obscured by blue PP to compare the depth of through barrier detection that could be achieved using CR. The contribution of ethanol to the acquired spectrum at thicknesses of 2 mm blue PP (a), 4 mm blue PP (b) and 6 mm blue PP (c) at offsets of 1 -8 mm, are shown in Fig. S8 (Supporting Information). Fig. 6a refers to the spectra acquired at an 8 mm offset at thicknesses of 2, 4 and 6 mm PP. At a thickness of 2 mm ethanol makes a significant contribution to the spectra with a clearly defined peak at 882 cm-1. As the thickness is increased to 4 mm, ethanol
thickness of 6 mm, ethanol is observed as a shoulder at 882 cm-1 however, even at
this largest possible spatial offset (8 mm) there is little distinction between the plastic and ethanol in this region (880-900 cm-1). Despite this, the presence of ethanol is
confirmed by a scaled subtraction, Fig. S8d (supporting information), which shows a defined peak at 882 cm-1.
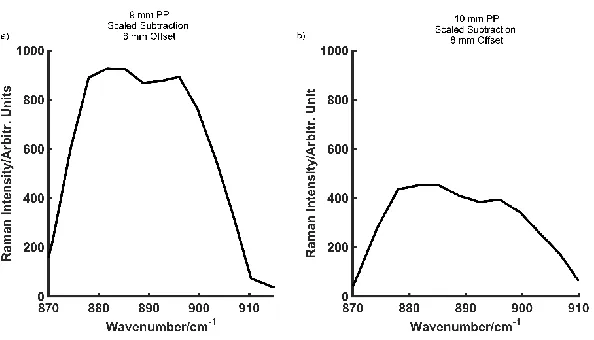
As carried out previously, PCA was performed to establish the maximum thickness of PP through which ethanol could be detected by SORS. Detection of ethanol, combined with the application of PCA, is possible through thicknesses up to 9 mm PP compared to 6 mm visually. Fig. 6c shows the resulting PC1 loadings a thickness of 9 mm PP, collected at an 8 mm offset. First order derivative spectra (Fig. 6b) displays spectral differences at 882 cm-1 and the PCA scores plot shows separation between the signal
collected at the zero position (plastic) and signal collected at the 8 mm offset (ethanol and plastic). The loadings on PC1 (Fig. 6c) also show that ethanol is contributing strongly to the obtained signal. Furthermore, the resulting scaled subtraction (Fig. S9a, Supporting Information) displays a slight peak at 882 cm-1, with a shoulder at 900 cm -1. This peak at 900 cm-1 is a contribution from the plastic, thus highlighting the
inconsistencies and variances associated with solely performing a scaled subtraction at depths where there are little differences in the spectra. Nonetheless, it can be determined with conviction that ethanol can be detected through 9 mm of blue PP using SORS.
PCA was also performed on the data collected using 10 mm PP at an offset of 8 mm, Fig. 6 (d,e). As before, with first order derivative spectra using 22 mm PET (Fig. 4d), it is believed that spectral differences responsible for the PCA separation are only associated with the plastic (Fig. 6d). In the zero order spectra for plastic (Fig. 6a), peaks associated with the material can be seen at 809 cm-1 and 841 cm-1. As
expected, on the first order graph Fig. 6d, they are displayed as zero-crossing. Slight fluctuations in the first order spectra can be seen at 832 cm-1 and 852 cm-1 and are
therefore associated with the zero order Raman peak at 842 cm-1. Despite the PCA
scores plot indicating separation between signal collected at the zero position and signal collected at the offset, it is once again believed that this is due to subtle differences in the plastic spectra collected at two offsets (0 mm and 8 mm). This is supported in the loadings for PC1 Fig. 6e, which show that variances in the plastic at 10 mm are responsible for the cause of separation across PC1. Additionally, performing a scaled subtraction produces little valuable information from the ethanol analyte under detection, Fig. S9b (Supporting Information). It is also possible that since the plastic is coloured, signal collected from the deeper layers (8 mm offset) may have absorbed some of the energy from the laser, thus giving rise to a slightly different set of spectra from those obtained at the zero position. Therefore, in summary, it is possible to detect ethanol through 2 mm of blue PP using CR but up to thicknesses of 9 mm using SORS.
increase in levels of through barrier detection using low power SORS (60 mW) compared to handheld CR show that the SORS technique has a superior advantage.
It is acknowledged that the two wavelengths used are different from one another however, handheld instruments with the same wavelength were not available. Furthermore, rather than comparing specific laser powers and wavelengths, we intended to, and successfully, demonstrate the maximum potential of both Raman techniques for through barrier detection.
Conclusion
The non-invasive detection of ethanol by means of both CR and SORS has been demonstrated successfully using handheld spectrometers. Impressively, using CR in combination with multivariate analysis, detection of ethanol was possible up to thicknesses of 9 mm through clear PET and 2 mm through blue PP. The SORS approach, also in combination with PCA, allows for even greater through barrier assessment, with detection of ethanol through thicknesses of up to 21 mm of clear PET and 9 mm blue PP. Moreover, when using either CR or SORS, we successfully present the benefits of utilizing PCA for probing through barriers, particularly when both the barrier and analyte have peaks in close proximity to one another. Signals are extracted from greater depths using PCA compared to what can be achieved solely by eye, e.g. using the SORS set up it is possible to visually detect spectral contribution from ethanol up to 15 mm through PET but up to 21 mm using PCA.
Previous work has reported on the use of CR detection through plastic bags and plastic containers. Using benchtop SORS equipment, liquid screening through plastic and has been reported in thicknesses of up 4 mm glass and 4.5 mm PP. This work demonstrates the potential of both CR and SORS for through barrier detection, highlighting the ability of both handheld instruments to see through large thicknesses. In addition, we show the maximum thickness to which through barrier detection can take place and highlight the analytical capabilities of both the instruments for through barrier detection. More specifically, the high degree of sensitivity and capabilities of handheld SORS with back-scattering collection optics is particularly exciting. Both techniques, CR and SORS, demonstrate the applications of handheld Raman in several fields including security. Furthermore, SORS holds notable promise in through barrier detection when obscuring objects such as plastic and glass are present, as well as in a clinical setting, namely disease diagnostics.
Acknowledgements
FN wishes to acknowledge the help of Stuart Bonthron at Cobalt Light Systems.
Conflict of Interest
The authors declare no conflict of interest
Funding
associated with this paper will become available through the following link: http://dx.doi.org/10.15129/c43cc987-469c-4afe-ac09-de91a0bf5608
References
[1] K. Gracie, E. Correa, S. Mabbott, J. A. Dougan, D. Graham, R. Goodacre, K. Faulds, Chem. Sci. 2014; 5, 1030.
[2] C. A. Lieber, S. K. Majumder, D. L. Ellis, D. D. Billheimer, A. Mahadevan-Jansen, Lasers Surg. Med. 2008; 40, 461.
[3] M. J. Baker, K. Faulds, Chem. Soc. Rev. 2016; 45, 1792.
[4] A. Jaworska, L. E. Jamieson, K. Malek, C. J. Campbell, J. Choo, S. Chlopicki, M. Baranska, Analyst 2014; 140, 2321.
[5] J. C. Carter, S. M. Angel, M. Lawrence-Snyder, J. Scaffidi, R. E. Whipple, J. G. Reynolds, Appl. Spectrosc. 2005; 59, 769.
[6] N. C. Shand, SPIE Eur. Secur. Def. 2008; 7119, 71190J.
[7] D. S. Moore, R. J. Scharff. Anal. Bioanal. Chem. 2009; 393, 1571. [8] A. Macleod, N, P. Matousek, Appl. Spectrosc. 2008; 62, 291.
[9] P. Matousek, I. P. Clark, E. R. C. Draper, M. D. Morris, A E. Goodship, N. Everall, M. Towrie, W. F. Finney, A. W. Parker, Appl. Spectrosc. 2005, 59, 393. [10] P. Matousek, N. Stone, Chem. Soc. Rev. 2016; 45, 1794.
[11] P. Matousek, Appl. Spectrosc. 2006; 60, 1341.
[12] C. Eliasson, N. A Macleod, P. Matousek, Anal. Chem. 2007; 79, 8185.
[13] K. Buckley, C. G. Atkins, D. Chen, H. G. Schulze, D. V Devine, M. W. Blades, R. F. B, Analyst 2016; 141, 1678.
[14] M. V Schulmerich, K. a Dooley, M. D. Morris, T. M. Vanasse, S. A. Goldstein, J. Biomed. Opt. 2015; 11, 60502.
[15] P. Matousek, E. Draper, A. Goodship, I. Clark, K. Ronayne, A. W. Parker, Appl. Spectrosc. 2006; 60, 758.
[16] N. Stone, R. Baker, K. Rogers, A. W. Parker, P. Matousek, Analyst 2007; 132, 899.
[17] M. Bloomfield, P. W. Loeffen, P. Matousek, Proc. SPIE 2010; 7838, 783808. [18] R. J. Hopkins, S. H. Pelfrey, N. C. Shand, Analyst 2012; 137, 4408.
[19] D. L. Ellis, H. Muhamadali, S. A. Haughey, C. . Elliot, R. Goodacre, Anal. methods 2015; 7, 9401.
[20] R. J. Stokes, M. Bailey, S. Bonthron, T. Stone, G. Maskall, O. Presly, E. Roy, C. Tombling, P. W. Loeffen, Proc. SPIE 2016; 9995, 999506.
[21] L. E. Jamieson, H. J. Byrne, Vib. Spectrosc. 2016; 2617.
[22] H. J. Butler, L. Ashton, B. Bird, G. Cinque, K. Curtis, J. Dorney, K. Esmonde-white, N. J. Fullwood, B. Gardner, P. L. Martin-Hirsch, M. J. Walsh, M. R. Mcainsh, N. Stone, F. L. Martin, Nat. Protoc. 2016; 11, 664.
[23] M. A. Bedics, H. Kearns, J. M. Cox, S. Mabbott, F. Ali, N. C. Shand, K. Faulds, J. B. Benedict, D. Graham, M. R. Detty, Chem. Sci. 2015; 6, 2302.
Supplementary information (SI)
[image:12.595.182.400.133.356.2]Experimental
Figure S1 – The influence of focal length on spot size. The instrument in question has instrument has a spot size of 50 – 60 microns at a focal distance of 0. 5 cm.
Figure S2 – Experimental set up (a) CR spectrometer with point and shoot adaptor (b) SORS spectrometer with nose cone on.
[image:12.595.131.446.448.637.2]Figure S3 – Stacked absorption spectra of CA. Little difference in absorption is seen at 830 nm and 785 nm. As thickness increases absorbance also increases thus indicating that not all the laser light is being transmitted to the ethanol sample. Performed using an Agilent Cary 60 UV-Vis spectrometer.
[image:13.595.134.441.454.621.2]Figure S5 – PCA scores plots at a PP thicknesses of 2 mm.
[image:14.595.186.407.392.605.2]Using a SORS instrument in a CR mode
Figure S7 – Detection of ethanol through plastic using the Resolve SORS instrument in a CR mode. At 450 mW, ethanol can be detected up to thicknesses of 4 mm for CA (a) and PP (b). At 4 mm CA, a small shoulder
can be seen at 882 cm-1. Similarly, greater spectral intensity can be seen in spectra containing ethanol
obscured by 4 mm PP (b) at 882 cm-1. This is also the case when the laser power is lowered to 60 mW,
where ethanol detection is possible through 3 mm CA (c) and 3 mm pp (d). Measurements were performed at a laser excitation wavelength of 830 nm with 3 s integration time, 5 accumulations. Spectra were averaged and baselined and normalised.
Figure S9 – Scaled subtractions at 9 mm thick blue PP (c) and 10 mm thick blue PP (d).
Reduced laser power SORS
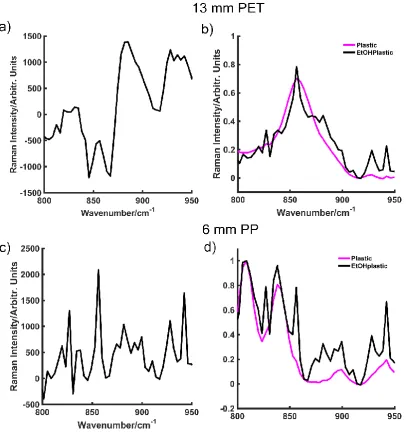
Figure S10 – Scaled subtracted spectra using SORS at 60 mW of 13 mm CA (a) and 6 mm PP (c). Overlaid spectra collected at the zero position (plastic) and 8 mm offset position (EtOHplastic) at thicknesses of 13
mm CA (b) and 6 mm PP (d). The ethanol peak at 882 cm-1 is distinguishable at these thicknesses, both in
the scaled subtraction and baseline overlaid spectra.