City, University of London Institutional Repository
Citation
:
Binns, A. M., Bunce, C. V., Dickinson, C., Harper, R. A., Tudor-Edwards, R., Woodhouse, M., Linck, P., Suttie, A., Jackson, J., Lindsay, J., Wolffsohn, J., Hughes, L. and Margrain, T. H. (2012). How effective is low vision service provision? A systematic review. Survey of Ophthalmology, 57(1), pp. 34-65. doi: 10.1016/j.survophthal.2011.06.006This is the unspecified version of the paper.
This version of the publication may differ from the final published
version.
Permanent repository link:
http://openaccess.city.ac.uk/3374/Link to published version
:
http://dx.doi.org/10.1016/j.survophthal.2011.06.006Copyright and reuse:
City Research Online aims to make research
outputs of City, University of London available to a wider audience.
Copyright and Moral Rights remain with the author(s) and/or copyright
holders. URLs from City Research Online may be freely distributed and
linked to.
How Effective is Low Vision Service Provision? A Systematic Review
Alison M Binns, PhD,
1Catey Bunce, DSc,
2Chris Dickinson, PhD,
3Robert Harper,
DPhil,
4Rhiannon Tudor-Edwards, D.Phil,
5, Margaret Woodhouse, PhD,
1Pat Linck,
MSc,
5Alan Suttie,
6Jonathan Jackson, PhD
7Jennifer Lindsay, BSc,
7James
Wolffsohn, PhD,
8Lindsey Hughes, BSc,
9Tom H Margrain, PhD,
11
Cardiff University, Cardiff, Wales; 2Moorfields Eye Hospital, London, England; 3University of Manchester, Manchester, England; 4Manchester Royal Eye Hospital, Central Manchester University Hospitals NHS Trust, Manchester Academic Health Science Centre, Oxford Road, Manchester,, England; 5Bangor University, Bangor, Wales; 6Fife Society for the Blind, Fife, Scotland; 7RoyalVictoria Hospital/Queens University/Health & Social Care Board, Belfast, Northern Ireland.; 8Aston University, Birmingham, England; 9British and Irish Orthoptic Society, London England.
Abstract.
Visual impairment is a large and growing socioeconomic problem. Good evidence on rehabilitation
outcomes is required to guide service development and improve the lives of people with sight loss.
Of the 478 potentially relevant articles identified, only 58 studies met our liberal inclusion criteria,
and of these only 7 were randomized controlled trials. Although the literature is sufficient to
confirm that rehabilitation services result in improved clinical and functional ability outcomes, the
effects on mood, vision-related quality of life (QoL) and health-related QoL are less clear. There are
some good data on the performance of particular types of intervention, but almost no useful data
about outcomes in children, those of working age and other minority groups. There were no reports
on cost effectiveness. Overall, the number of well designed and adequately reported studies is
pitifully small; visual rehabilitation research needs higher quality research. We highlight study
design and reporting considerations and suggest a future research agenda.
Key words.
I. Introduction
The World Health Organisation estimates that over 135 million people are visually disabled, and
nearly 45 million people are blind.38 Visual impairment is a global concern that is likely to become
more significant as the standard of medical care improves and the average lifespan increases.37,A
Low vision rehabilitation aims to improve the lives of people with sight loss by improving
functional ability, and possibly more general aspects, such as quality-of-life and psychosocial
status. Different rehabilitation models have been developed to meet these goals, and there is need
for a strong evidence base regarding the ability of these different strategies to achieve positive
outcomes in various patient groups. We provide a critical evaluation of the current literature
regarding the effectiveness of different models of low vision service provision. It complements
recent literature reviews that have analysed the effectiveness of specific aspects of rehabilitation for
individuals with visual impairment, for example assistive technologies 80,152 and orientation and mobility training.153
We first discuss some of the factors that are central to the analysis and understanding of this body of
literature, such as the consequences of visual impairment (see Section II A), the different types of
low vision services available (Section II B), and types of outcome measures used to assess the
effectiveness of visual rehabilitation (Section II C). Section III provides an overview of the included
studies, with an emphasis on evaluation of the quality of the studies with respect to robustness of
study design. Section IV of the review (parts A-F) summarises the evidence regarding the effect of
low vision service provision on different types of outcome. We also evaluate the evidence within
the literature to answer other important questions; i) Do some models of service provision improve
outcomes more than others? (Section IV G) ii) Do rehabilitation outcomes deteriorate with time?
(Section IV H) iii) Does length of rehabilitation affect outcome? (Section IV I) iv) How effective
are services at helping children, people with learning disabilities, those of working age, and
minority groups with visual disabilities? (Section IV J) v) How cost-effective is low vision service
provision? (Section IV K).
Terms such as ‘disability’, ‘impairment’, ‘low vision’, and ‘blindness’ are widely used in the literature. In this review, we define ‘disability’ in accordance with the Equalities Act (2010), B
which states that a person has a disability if (a) they have a physical or mental impairment, and (b)
the impairment has a substantial and long-term adverse effect on the individual’s ability to carry out
normal daily activities. For example, reduced visual acuity may be described as an impairment,
while the inability to read consequent to the reduced acuity may be described as a disability.
Criteria for ‘visual impairment’ and ‘blindness’ vary between the included studies and, where
II. Measuring the Effectiveness of Vision Rehabilitation
A. CONSEQUENCES OF VISUAL IMPAIRMENT
The ability of individuals with an impairment to function independently is often assessed with
reference to their ability to perform everyday tasks. Activities of Daily Living (ADLs) can be
defined as tasks that are performed on a normal daily basis, including self-care, social activities,
mobility tasks, leisure pursuits, and work. A distinction is often made between basic ADLs,
consisting of necessary self-care tasks, such as eating and personal hygiene, and instrumental ADLs
(IADLs), which are not necessary for fundamental existence, but which facilitate independent and
integrated functioning within a community, for example doing light housework, preparing meals,
taking prescription medicines, and taking care of personal finances.82
There is considerable evidence that adults who are visually impaired have a poorer functional status
in terms of ability to carry out both ADLs and IADLs than their fully sighted
counterparts.18,19,35,67,83,90,159 Lamoureux et al, for example, investigated the limitations in ADLs in 319 participants with a visual impairment with no visual rehabilitation history and found that
reading, outdoor mobility, participation in leisure activities, and shopping were most limited.90 Restricted mobility and orientation skills in individuals with visual impairment also make them
more vulnerable to falls and associated complications such as hip fractures.79,96
In addition to the functional disability associated with vision loss, it is becoming increasingly
apparent that the psychosocial impact of visual impairment is also substantial.5,21,54,75,77,120 The incidence of depression in visually impaired older adults varies across studies. For example, Evans
et al investigated the association between visual impairment and depression in 13,900 people aged
over 75 years in the UK; 13.5% of people with visual impairment were found to have significant
depressive symptoms compared to 4.6% with good vision.54 Brody et al found the prevalence of a
depressive disorder to be 32.5% in 151 older adults in the USA with visual impairment from
bilateral macular degeneration,21 while Horowitz et al found that, of 584 American patients with
vision loss presenting for rehabilitation services, 7% had major depression and 26.9% met the
criteria for subthreshold depression.77 In addition to the direct detrimental effect exerted by depressive disorders on quality-of-life, psychological status has also been shown to impact on an
individual’s level of functional impairment.21,90,120,130
There is less evidence regarding the impact of visual impairment on younger adults and children;
however, it has been suggested that the risk of mental health problems associated with visual
impairment is at least as high in those of working age as in older adults.13,14 One recent study
and associated with a greater risk of negative consequences for the individual.16 A study
investigating health related quality-of-life in 79 children with visual impairments, found that there
was a wide range of scores on the Health Utilities Index and that the outcome was related to the
co-morbidities of the individuals. For example, children who only had nystagmus had significantly
better health-related quality of life scores, while those who had additional impairments reported
significantly lower scores than those who only had a disorder of the eye/visual pathway.17
The combination of social, functional, and psychological disabilities attributable to visual
impairment has been shown to result in an overall reduction in quality-of-life 25,86 and an increased
mortality rate.94 However, in an environment where economic resources for healthcare are limited,
and cost effectiveness must be demonstrated, the economic impact of visual impairment and
associated disabilities is also an important consideration. Frick et al used the Medical Expenditure
Panel Survey data from 1996-2002 to estimate the economic burden of visual impairment and
blindness in the United States.58 Through calculating the excess costs associated with visual impairment for an average individual, and estimating the prevalence of visual impairment and
blindness, they suggested that excess expenditures of $2.8 billion were directly attributable to vision
loss in those with visual impairment and blindness. The main contributor to this expense was home
care. Furthermore, when the loss of quality adjusted life years was added to the equation, a total
annual impact of nearly $16 billion was calculated.
B. VISION REHABILITATION SERVICES
Vision rehabilitation services conform to a variety of different models, some addressing solely the
functional needs of the individual, with an emphasis on the provision of optical and non-optical
aids, while others adopt a more holistic approach. Frequently encountered service types in studies
included in this review included standard hospital-based services (provided by optometrists or
trained low vision therapists, although these services now also often offer a high level of
integration, including strong links to the social services);36,154 integrated or multi-disciplinary services (including extra elements such as counselling, group activity, occupational therapy,
orientation and mobility training);66,91,102,143 and services with an emphasis on the psychological needs of patients.105 Services could be inpatient 51,105 or outpatient, 110,143 and could be designed to cater for the needs of a particular patient group, for example children,121 older adults,73 or
veterans.61,105,137,143
With regard to the personnel who provide low vision services, traditional UK hospital-based low
vision services rely primarily on optometrists, with referral to other professionals as necessary. In
recent years, however, a range of professionals have worked alongside, or in the place of, the
Research and Quality (ARHQ) in the USA gave an overview of licensed and unlicensed
professionals currently involved in low vision provision, which included, in addition to
ophthalmologists and optometrists, occupational therapists, physical therapists, social workers, low
vision therapists, vision rehabilitation teachers, and orientation and mobility specialists.C In some services, this wider-reaching approach to low vision service provision has culminated in the
development of multidisciplinary/interdisciplinary or integrated low vision
services.43,66,70,91,102,104,140,143 The exact nature of the multidisciplinary approach, however, is often poorly defined. Multidisciplinary models vary widely in their composition, but often include a
mixture of healthcare professionals, including those described by the AHRQ, as well as
psychologists and/or counsellors, combined in an integrated service. There is no clear distinction in
the literature between so called multidisciplinary and interdisciplinary services, with both terms
applied to services that employ professionals from different disciplines within the rehabilitation
process. A further type of integrated model which has been described is the transdisciplinary
service,68 which also involves a collaborative team, but uses extensive cross-training and role release (Team members refer aspects of training to colleagues from different disciplines.).
Several novel group-based programs have also been described. Horowitz et al, for example,
identified an “Adaptive Skills Training Programme” based entirely on a group model of instruction
and facilitated discussion addressing different aspects of rehabilitation, including ADLs, orientation
and mobility, communication skills, and maintaining independence.73 A similar group approach has
also been adopted in Europe, with the addition of a homework component and invited professional
speakers, e.g. ophthalmologists and lighting specialists.41,48,49 Self-management programs are becoming increasingly popular, adopting a group-based approach, with the aim of helping
participants to take control in managing the consequences of visual impairment and developing
problem solving skills through sharing experiences and coping strategies.22,23,60,109,114 Given the wealth of different strategies employed in providing vision rehabilitation, there is a real need for
evidence-based studies evaluating the effectiveness and cost-effectiveness of the various types of
rehabilitation.
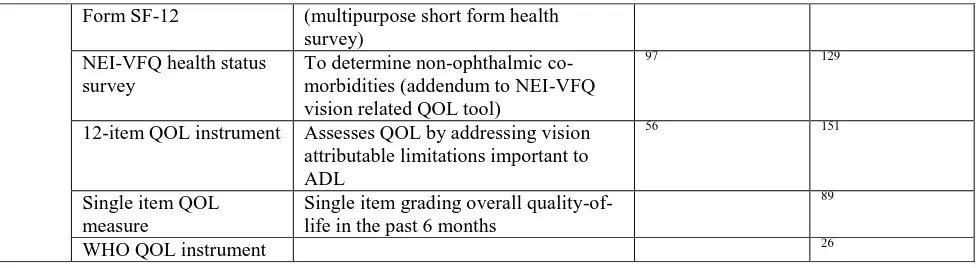
C. OUTCOME MEASURES FOR ASSESSING THE EFFECTIVENESS OF A SERVICE
The effectiveness of low vision service provision has been assessed in numerous ways, with little
consensus on the best approach. For example, we identified 47 different outcome measures in the
studies included in this review (see Table 1). This lack of consensus is problematic because it
hinders cross study comparisons.
Early studies tended to judge the outcomes of a service by either evaluating the frequency of use of
measures of visual function, such as visual acuity or reading speed.69,93,100,107 Although clinical outcomes are important, they do not necessarily reflect the abilities that the patients will show in
their home environment; for example, a large discrepancy has been demonstrated between
individuals with a good near VA in the clinic (75%), and those able to resolve small print at home
(39%).93
From this review, it was apparent that in the past decade there has been a drive towards assessing
outcomes based on measures of ability and/or independence in performing daily tasks,48,65,110 on
measures of psychological status,52,72,75 or on patient-reported quality-of-life.43,70,91,115 Instruments assessing functional status may be scored entirely based on a patient’s judgment of their own ability
(self-report/patient-rated assessment), e.g. the Veterans Affairs LV VFQ-48,141 or may be
completed by a single clinician, or group of professionals (provider/clinician-rated assessment), e.g.
the Independent Living Pre- and Post- Programme Assessment ILPPA,144 while other tools combine
the two, with some self-rated and some clinician-rated items, e.g. the Melbourne Low Vision ADL
Index (MLVAI).66 Another type of tool is the proxy-based assessment, which relies on the
judgement of a family member, or someone close to the patient. This approach has been used more
commonly in assessing outcomes of children or those with learning disabilities.9
In recent years, the term ‘quality-of-life’ (QoL) has been widely used in vision rehabilitation
outcome studies. There is no single definition of quality-of-life, and the parameters assessed are
often context dependent. Numerous generic tools are available for the assessment of health-related
QoL: the Sickness Impact Profile (SIP),4 the Medical Outcomes Short Form 36 (SF-36),157 and the
EQ-5D from the Euroqol group111 are widely used examples. Other vision-specific QoL measures,
including the Low Vision Quality-of-Life questionnaire (LVQOL)160 and the National Eye Institute
Visual Function Questionnaire (NEI-VFQ)99 have been developed. These questionnaires often
combine general quality-of-life type measures (e.g. psychosocial adjustment), with domains
concerned with vision-related functional ability. Early questionnaires were largely designed to
assess functional impairment of people with cataracts e.g. the VF-14,133 and the Visual Functions
Index,6 and it cannot be assumed that content validity of a questionnaire will be sustained when the tool is transferred to a different patient population e.g. to a group of visually impaired people with
mixed diagnoses. In contrast, the LVQOL,160 Vision Quality-of-life Core Measure (VCM-1),59 and
the NEI-VFQ 98,99 were developed to be used with patients representing a broad range of ocular
conditions that had caused vision loss.
Self-rated and parent-rated visual function and quality-of-life outcome measures have also been
developed specifically to evaluate outcomes in children with visual impairment and
(CVAQC) assesses self-reported visual ability in children and young people with a visual
impairment.84
One important function of outcomes research is to assess the cost effectiveness of health and social
care interventions so that policy makers can make judgments about a particular
treatment/intervention.46 Evidence of cost effectiveness is increasingly being used by decision
makers, such as NICE, to make recommendations for resource allocation in the NHS.D
“Quality-adjusted life years” (QALYs) are an index of health gain combining length and quality of life.20
The
costs of providing the intervention are calculated and compared with the QALY to generate the
additional costs required for one year of full health (one QALY). NICE supports the use of QALYs
as a generic measure of health gain, allowing comparison across different health services and
patient groups.E Further information about the outcome measures used by studies included in this
report is provided in Table 1.
Assessing the effectiveness of vision rehabilitation usually requires data to be collected on at least
two occasions i.e. pre- and post- intervention. The baseline measure is generally taken immediately
prior to the commencement of the rehabilitation service; however the timing of the follow-up
measure may be variable. Implementation immediately after discharge from the service is one
approach,140 while others choose to obtain post-test data several months after the conclusion of the
rehabilitation process.88,89 The timing of the follow up outcome measure is important because
improvements in the trait being assessed resulting from low vision service provision may be offset
by a deterioration in visual function caused by pathology progression.
Wolffsohn et al investigated the change in vision-related quality-of-life scores (LVQOL) in 117
people assessed at 4 time points (at time 0, 4 weeks, 8 weeks, and 12 weeks).161 They found a trend
towards a reduction in quality-of-life scores 3 months after baseline measures were implemented
and suggested that outcomes should be assessed up to 2 months post-rehabilitation to avoid a
significant decrease in the baseline level of visual impairment during the study period. A large
no-treatment condition matched “control” group, however, provides the only reliable means of teasing
out the effects of intervention and disease progression.138
III. Quality of included Studies
Of the 9,500 ‘hits’ identified by the literature search, 478 were potentially relevant to this study, of
which only 58 were found to meet inclusion/exclusion criteria (section VIII). Of these, 52 were
relevant to the general effectiveness of low vision services, 4 to children and minority groups, and 2
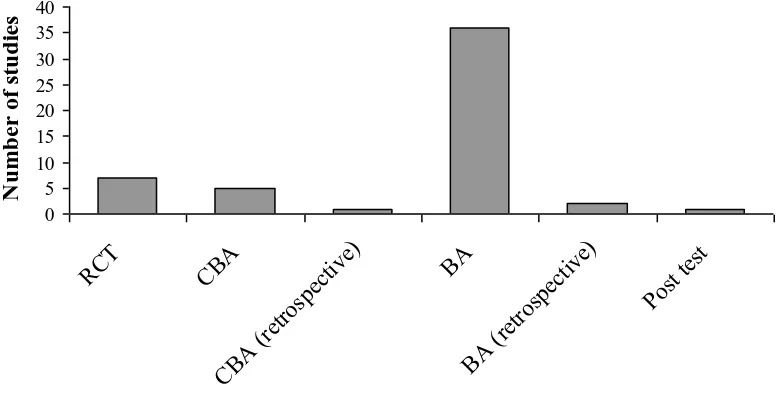
Figure 1 shows the breakdown of included studies by study design. Fifty two studies are included in
Figure 1 as several manuscripts presented data from the same studies (see Table 2 of included
studies).15,41,43,48-50,75,145,149 The majority of included studies used a “before and after” design but lacked a “control” group. This design made it difficult to determine the effect of the intervention in
many cases, as it was not possible to determine the underlying deterioration in function associated
with a worsening of the disease condition over the time-course of the study. Only 7 of the studies
described a randomised controlled trial (RCT), and several of these had significant design or
reporting flaws. For example, Scanlan and Cuddeford carried out an RCT to determine the
effectiveness of a low vision service model which used a prolonged period of education by a
rehabilitation worker, compared to the current standard service.126 The potential value of this study was marred by the small sample size (N=32 per group), by a lack of clarity about how loss of
subjects to follow up may have affected outcomes, and, crucially, by a lack of actual mean scores
and standard deviations reported in the paper. Rogers et al, who carried out a retrospective
controlled before and after study to compare two different models of low vision rehabilitation,
similarly failed to provide any actual data, reporting only P values in the article.118 Engel et al, in their before and after study, referred to a significant correlation between dose of rehabilitative
intervention and outcome, but gave no details of the magnitude of the correlation.52 Thirty studies failed to give sufficient details of pre- and post- intervention data to allow effect sizes to be
calculated. This presented additional difficulties when attempting to compare the impact of different
models of service provision.
Figure 1 about here
A number of studies failed to employ recommended procedures for minimising potential bias, or to
report sufficient details of study design to allow the reader to assess the risk of bias. There are
several types of bias particularly associated with the assessment of vision rehabilitation
interventions, notably the loss of patients to follow up, which is inevitably a problem with longer
studies, especially when an elderly population is being evaluated. Loss to follow-up can lead to bias
when patients who drop out differ in characteristics from those who return for follow-up. For
example, if patients who were dissatisfied with the service are less inclined to return to be
reassessed, then there will tend to be a bias towards a more positive reported outcome in the
remaining individuals. A number of studies attempted to address this problem by comparing all
available characteristics of those who did and those who did not complete the study, and by
reporting reasons for loss to follow-up.29,70,108,149
Another source of bias encountered was the way in which outcome data were collected. There is a
provider will be inclined to report more positively on outcomes if questionnaire items are presented
by this provider.55,73,110 Individuals collecting outcome data should be independent of the service providing team and be ‘masked’ to the intervention group. Eklund et al commented on the
difficulties involved in preventing patients from divulging the nature of their treatment in the follow
up interview, even when there is an intention to mask.49 Asking patients to retrospectively rate their change in function at some point after the completion of the rehabilitation program, without
collecting baseline data, can also be a source of bias. The problem inherent in relying on patient
memory is evidenced in the study by Walter et al,155 who conducted a telephone interview
approximately 1 year after the conclusion of rehabilitation to ask about change in rated difficulty of
activities of daily living from pre- to post- intervention. Of 417 respondents, 105 were unaware of
even having participated in visual rehabilitation.
A further potential concern in evaluating these studies is the number of comparisons made. The
outcome measures are often questionnaires made up of a number of items, grouped into several
subscales. Many studies evaluated pre- to post- intervention data on 10 or more items, with no
mention of correction to minimise the risk of a type I statistical error caused by multiple
comparisons. If significance is taken at a P=0.05 level, then 5% of comparisons made would be
expected to show a significant difference due to chance alone. Two studies addressed this issue
directly, using a Bonferroni correction.10,126,144
The study that we found to have the least potential for bias in this review is the 2008 LOVIT
report.143 This RCT included a waiting list control, full details of randomisation and masking (with a specified protocol for avoiding the disclosure by patients of their intervention group), the use of a
range of well-validated outcome measures, and full details of results. It may be that the publication
of this report, and others with a similarly rigorous protocol development (Girdler et al60; Reeves et al115), marks a shift towards greater consideration of experimental design in future assessment of low vision service provision.
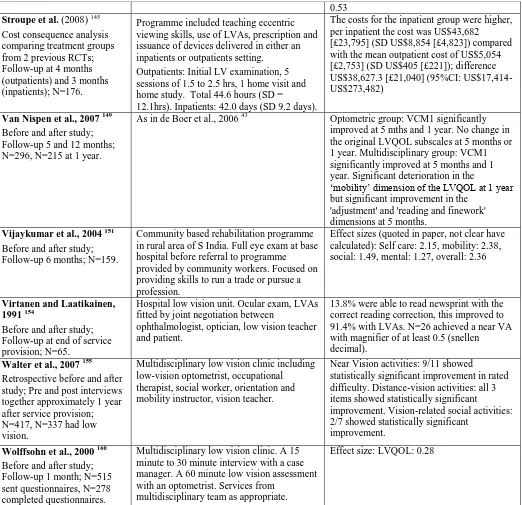
IV. Evidence Synthesis
A summary table outlines the characteristics and outcomes of included studies (Table 2). We will
now consider the key findings of the literature, with a view to the quality of the evidence provided.
In this review we use the terms: ‘very good evidence’ when referring to the results of well designed
RCTs; ‘good evidence’ when referring to consistent results from at least two robust studies that are
not RCTs and ‘evidence’ when referring to the results from at least one robust study.
A. EFFECT OF LOW VISION SERVICE INTERVENTION ON CLINICAL MEASURES
There is very good evidence that the provision of low vision services results in an improved level of
clinically measured visual function, particularly with respect to aspects of reading
ability.32,61,69,100,102,107,108,116,126,154 On a basic level, there is good evidence to suggest that LVA provision is an effective means of improving reading ability in patients with visual impairment,
although this is often evidenced by an improvement in clinically measured function, rather than by
assessment of effectiveness in improving performance outside the testing room.69,100,154
Nilsson showed that clinically measured improvements in functional ability can be long-lasting.
That is, they evaluated clinical outcomes (distance and near VA) after vision rehabilitation in 76
patients with diabetic retinopathy over a mean follow-up period of 3.6 years, and in 120 patients
with macular degeneration, who were followed-up for a mean period of 5 years.106,107 In both cases,
an intensive series of visits incorporating LVA provision and training in use of residual vision was
followed-up by extra appointments in subsequent years. Large effects on distance and near acuity
were found after the initial set of visits and throughout follow-ups and, even allowing for worsening
of disease status, there was a large positive effect size from baseline to the end of the final series of
visits. Some caution should be employed when considering effect sizes in the case of improved
visual acuity resulting from the prescription of magnifiers. An increase in magnification will result
in improved acuity, and so an increased effect size. Clinically, however, high powered magnifiers
are often not prescribed as the result of problems with shorter focal lengths and reduced field of
view.
Other studies have gone beyond the assessment of change in near acuity, to look at other clinically
relevant parameters. For example, Goodrich et al showed a marked improvement in reading speed
(effect size 1.01) after a comprehensive inpatient reading rehabilitation programme.61 McCabe et al
measured functional outcomes both clinically (using the Functional Visual Performance test -
FVPT) and by self-report (using the Functional Assessment Test - FAQ), and found an
improvement in both measures; the mean FAQ scores improved by approximately 10%, whilst the
FVPT improved by approximately 50%.102
B. FREQUENCY OF USE OF LVAS FOLLOWING LOW VISION SERVICE
INTERVENTION AND SATISFACTION WITH LVAS AND SERVICE
There is very good evidence to support the hypothesis that patients value and use low vision aids
provided by rehabilitation services.33,69,70,115,121,122,124 Validity of low vision aid usage as a surrogate for service effectiveness is supported by the findings of Horowitz et al, who reported that the use of
LVAs is associated with a reduction in disability and depression at 6 months.72 The Manchester
Low Vision Questionnaire (MLVQ) has been used as a standardised tool to assess aspects of LVA
in following up 226 patients for up to 1 year after provision of 3 different service models, and
showed that patients valued their LVAs highly, and showed a high use of LVAs throughout the
trial, despite apparently negative outcomes in vision-related QoL and QoL domains.115 In a recent
study evaluating the newly established Welsh Low Vision Service, Ryan et al. reported that of 279
service users who returned follow-up questionnaires at 3 months after initial service provision, 92%
of those prescribed magnifiers had used them during the past week, and 98% had found the service
useful.124
C. EFFECT OF REHABILITATION ON VISUAL FUNCTION AND ACTIVITIES OF
DAILY LIVING (ADLS)
Studies included in this review have assessed patients’ ability to carry out normal activities of daily
living from a variety of perspectives (see Table 1). Outcomes have included participation levels in
ADLs,60 confidence in performance of ADLs,116 dependence or independence in performing
ADLs,48 activity levels,102 and perceived security/insecurity in performing ADLs,41,49 as well as assessing basic ability in performance.55,66,68,72,75,104,110,118,129,137,138,143,144 Despite the disparity in evaluation tools used, there is very good evidence that low vision service provision improves
functional ability.
In the only waiting list controlled RCT reviewed, Stelmack et al showed a large improvement in
visual function (using the VA LV VFQ-48) as a result of a Veteran’s Affairs interdisciplinary
outpatient intervention.143 The largest effect size was found in the reading domain (i.e. from baseline to 4 months Cohen’s d, adjusted for control group deterioration = 2.51). Large effect sizes
were also seen in visual information processing (2.03), visual motor skills (1.82), mobility (1.14)
and overall visual ability (2.51). The waiting list control group showed a small decline in all aspects
of function over the 4 months (overall visual function effect size -0.2). Previous studies by
Stelmack et al, looking at the effectiveness of other Veterans’ Affairs service models, have similarly
found a marked functional improvement post-intervention using the VA LV VFQ-48 tool.138,141
Stelmack et al demonstrated that the positive effects of an intensive inpatient Veteran’s Affairs
rehabilitation programme on functional ability were reduced, but still large at 12 months (VA LV
VFQ-48 effect sizes were 2.035 and 1.405 at 3 and 12 months respectively; N=95).138
The greater effect sizes found in comparison to those reported by studies using vision related
quality-of-life tools to assess the same type of Veterans’ Affairs low vision service (e.g. 88,137) suggest that outcome measures targeting visual function may be more sensitive to the benefits of
this type of service. Although these findings indicate that the VA LV VFQ-48 outcome measure is
similar effect sizes will be found using this tool to assess the outcomes of other types of service.
Some evidence that this may not be the case is provided by Stelmack et al, who reported much
smaller effect sizes when the VA LV VFQ-48 was used to assess the effectiveness of less intensive
outpatient services (two private clinics and two Veterans’ Affairs services).141
In contrast to the studies using self-report outcome measures, Stephens et al looked at the
clinician-rated Independent Living Pre-Programme assessment and Post-Programme assessment outcomes of
low vision service provision (across 6 services, providing 4 different models of intervention) in a
large sample of 1194 people,144 and found a significant pre- to post- rehabilitation improvement for all age groups studied (over 65 yrs) in all 4 parameters, with medium effect sizes for all ages. The
potential bias introduced by using a clinician-rated measure of functional outcomes was
investigated by McKnight and Babcock-Parziale, who compared the change in the Functional
Assessment of Self-Reliance in Tasks (FAST) clinician-rated and self-rated scores between a pre-
and post-rehabilitation assessment on the basis of complete data from 81 individuals.104 Their Rasch
analysis suggested that the tool gives equivalent results when administered as a self-report tool and
when clinician rated. The absence, however, of a statistical difference between the self report and
clinician rated scales is not the same as evidence of no difference.
In a well designed 2 arm RCT, Girdler et al compared outcomes from ‘usual care’ and ‘usual care
plus a vision self management programme’.60
The latter intervention involved an 8 week (24 hour)
programme delivered in a group environment with 6 to 10 participants. Seventy-seven subjects were
randomised and outcomes from a 12 week follow up were reported. The intention to treat analysis
showed that the extended model produced significantly improved participation levels and the belief
in the ability to manage every day tasks.60
Other studies have evaluated the effects of more specialised services. For example, Engel et al and
Kuyk et al demonstrated significant improvements in mobility-related ADLs after specific
orientation and mobility training programmes, although it was not possible to calculate effect sizes
from the data presented.52,87 Horowitz et al reported small to medium effect sizes for functional outcomes in a large group of participants (N=395) after completion of a group based ‘Adaptive
Skills Training Programme’.73 Farish and Wen found large effect sizes, particularly for near work,
daily living skills and communication skills, in their evaluation of outcomes of 57 older people
undergoing another new service, the “Independent Living Services Programme” for older persons in
Mississippi.55
Despite the diverse service models evaluated, the variety of different follow-up times and outcome
measures used, it is evident that most studies found a significant improvement in functional ability
D. EFFECT OF REHABILITATION ON VISION-RELATED QUALITY OF LIFE
There is not a clear distinction between the effects of low vision service provision on self-reported
‘visual function’ and on ‘vision-related quality-of-life’. Many ‘vision related quality-of-life’ tools
employ subsections which address functional deficits, and when outcome measures are reported in
terms of overall score on such tools, it is not always possible to determine whether the improvement
has actually been mainly in the functional domains. Where possible, this distinction has been
clarified.
De Boer et al looked at the change in vision related QoL 1 year after participation in optometric and
multidisciplinary rehabilitation services, using the outcome measures Vision Quality-of-life Core
Measure (VCM1) and the Low Vision Quality-of-life Questionnaire (LVQOL).43 VCM1 is a vision
related QoL tool that does stand apart from the functional questionnaires, with items addressing
more holistic aspects of life satisfaction, including factors such as embarrassment, anger,
depression, loneliness and fear of deterioration in vision. The LVQOL tool has a strong functional
element, with subsections addressing general vision, mobility and lighting issues, psychological
adjustment, reading and fine work, and activities of daily living. De Boer et al found a small but
statistically significant improvement in VCM1 scores from pre-rehabilitation to 12 month follow-up
(small effect size of 0.132), but no statistically significant difference in LVQOL (deteriorated by
effect size of -0.17). They reported that a large number of patients (27% of the 296 who enrolled at
baseline) were lost to follow up. Reeves et al also used the VCM1 to assess vision-related QoL
outcomes following low vision rehabilitation in a well designed RCT, where participants were
assigned to 1 of 3 different modes of rehabilitation.115 They similarly found a lack of improvement
at 12 months, and actually reported a small but statistically significant decline in vision-related QoL
in all groups. Neither of these studies incorporated an untreated control group, and it might be
hypothesised that the lack of positive effect could be attributable to the decline in baseline function
over the course of the year. To investigate this, van Nispen et al reanalysed the data of de Boer et al
to include a 5 month follow-up analysis, and found that there was little improvement from baseline,
apart from in the ‘reading small print’ item.43,149
Wolffsohn et al also found the reading and fine
work subscale of the LVQOL to show the greatest improvement at a 1 month follow-up of 278
individuals undergoing multidisciplinary low vision care (effect size 0.28).160 As in the LOVIT
study of Stelmack et al, the ability to perform near tasks appears to be most sensitive to
rehabilitation.143
The NEI-VFQ 51 and 25 item questionnaires98 have also been widely used in assessing the
effectiveness of low vision intervention, and were employed by a number of studies in this
subscales. Kuyk et al showed a moderate increase in vision-related QoL (NEI-VFQ 25) after a very
intensive inpatient service treating male veterans who were legally blind.88 The composite score
effect size was 0.59 and 0.55 at 2 and 6 months follow-up respectively. The near vision subscale
effect size was greatest (1.49 and 1.44 effect size at 2 and 6 months respectively). The distance
vision subscale was also markedly improved (0.68 and 0.56). Other subscales showed smaller
improvements; the general health subscale was the only one to show a decrease. The Veterans’
Affairs services tend to be more intensive than standard low vision services, and this is reflected in
the effect sizes reported. For example, Scott et al assessed outcomes in 156 patients after a 60-90
minute intervention.129 They showed a significant improvement in NEI-VFQ 51 item score
(outcomes assessed 3 months after treatment), but only in general vision, near activities, distance
and peripheral vision subscales (effect sizes: general vision: 0.34, near activities: 0.59, distance
activities: 0.21, peripheral vision: 0.33). La Grow et al used the NEI-VFQ 25 and the “Measure of
Functional and Psychosocial Outcomes of Blind Rehabilitation” to assess outcomes of integrated
and standard low vision service models at 6 months and 1 year.89 Outcomes from both services
showed no significant change from baseline to the 1 year follow-up. A novel 7-item version of the
NEI-VFQ, designed to target those aspects of visual disability which have been shown to be
amenable to modification by low vision service provision123,143 was used in a recent evaluation of a
new community-based low vision service.33,124 There was a significant reduction in visual disability
between baseline and 3 months for both those in the community-based low vision service (n=343)
and those in a hospital-based low vision service (n=145).
Although a number of studies have demonstrated significant improvements in ‘vision related
quality-of-life’ following rehabilitation, it is the items related to functional measures (particularly
near vision), rather than less specific aspects of health-related QoL, that show the greatest
sensitivity to the intervention.
E. EFFECT OF REHABILITATION ON MOOD
Preceding sections have demonstrated that functional ability improves following rehabilitation.
Given that there is evidence to suggest that mood and psychological status are connected closely
with the ability to perform daily tasks,54 an improvement in psychological status might be an
expected consequence of low vision service provision, even in the absence of a specific
counselling/psychological component. However, section D on the effectiveness of low vision
service intervention on vision related QoL indicated that functional items tended to be more
sensitive to rehabilitative intervention than psychosocial type items in most questionnaires.
status, the results have also been less encouraging than the outcomes regarding functional status.
5,41,44,45,48,49,60,72,73,75,76,105,109,110,116,139
There is very good evidence that the Veterans Affairs outpatient program does not reduce the
symptoms of depression. Stelmack et al found no improvement in self-reported symptoms of
depression using the Centre for Epidemiological Studies Depression Scale (CES-D) at the 4 month
follow up, even after a high dose intervention (Veterans’ Affairs outpatient service) which showed
large improvements in visual function.143 However, that service did not contain a specific counselling or psychological intervention. Horowitz et al found a very small positive effect
following low vision service intervention at variable settings in New York on CES-D outcomes
(effect size -0.045, indicating a reduced level of depression) at a 20-27 month follow up,76,77 although the lack of a control group may have resulted in an underestimation of the effect of the
service. The service was variable in its structure, and could include counselling as one component,
although analysis indicated that utilising the counselling service was not associated with fewer
depressive symptoms at follow-up. In another trial, with a shorter follow-up period of 6 months,
Horowitz et al found a larger, although still small, improvement in depressive symptoms (effect size
-0.11) using the CES-D, even though there was an overall increase in functional disability (effect
size 0.05).72 Robbins and McMurry evaluated depression outcomes of 57 individuals at the
Kooyong Low Vision Clinic (a multidisciplinary service, without any specified counselling or
psychological service), using the Geriatric Depression Scale (GDS-30).116 There was a small to
moderate reduction in depression, but this change was not statistically significant.
More positively, there is very good evidence that the addition of a ‘vision self management programme’ can produce a small reduction in depressive symptoms. Girdler et al evaluated the
outcomes of a ‘vision self-management programme’ compared to ‘usual care’ in 77 individuals with
visual impairment (N=36 received the self-management training), and reported that those in the
self-management programme had significantly fewer depressive symptoms (GDS) at 12 weeks than
those in the standard visual rehabilitation service (effect size 0.18).60 Horowitz et al found a
significant improvement in the Adaptation to Age-Related Visual Loss (AVL) scale (medium effect
size 0.42) in 395 individuals undergoing an “Adaptive Skills Training” programme, although
outcomes were assessed immediately after the service in person by the service provider and there
was no control group, which does introduce a potential for bias.73
Needham et al evaluated the effectiveness of an inpatient Veteran’s Affairs 3 month adjustment to
blindness programme on 80 patients (all male), of whom approximately half had a psychological
disorder. Intensive psychological treatment was available to patients during their stay. After the first
ability, attitude, and overall adjustment.105 Medium effect sizes were found for all parameters, in those with and without a psychological disorder. However, these results should be treated with
caution because of the risk of observer bias. Bernbaum et al found comparable effect sizes after
intensive low vision rehabilitation (including individual counselling) for patients (N=29) with visual
impairment from diabetic retinopathy.5 At the end of the 12 week programme, they found a small
improvement in the Zung score (effect size 0.24) for people with a stable visual state, and a medium
effect size for people with transitional visual loss (effect size 0.59, P=0.06). Those said to have
“transitional visual loss” generally had fluctuating vision, and were undergoing active medical
intervention. There was also a significant medium effect size in self-esteem for both types of visual
status (effect sizes: stable visual state = 0.49, transitional visual loss = 0.56). These results should
also be treated with caution as the sample size was small.
F. EFFECT OF REHABILITATION ON GENERIC HEALTH-RELATED
QUALITY-OF-LIFE
The majority of studies reviewed showed generic health related quality-of-life measures to be
insensitive to low vision rehabilitation. For example, Stelmack et al found no improvement in QoL
(SF-36) even after a high dose intervention that showed large improvements in visual function.143
Lamoureux found no change in SF-12 at a 3-6 month follow up after multidisciplinary service
provision,91 while Reeves et al showed a deterioration in SF-36 scores at 1 year follow-up.115
Similarly, Scott et al found that a basic low vision service (60-90 min visit) had no significant effect
on general health related QoL assessed using the SF-36.129 La Grow et al used a single item QoL
measure in their comparison of integrated and standard low vision service models, and also found
no change at the 6 month or 1 year follow up periods.89
A few studies have reported improvements in health related QoL. For example, Girdler et al
provides very good evidence in support of a small improvement in the physical and mental
component summary of the SF-36,60 with the physical component summary showing significantly
greater improvement in the group undergoing the vision-self management programme than in those
receiving ‘usual care’ (effect size 0.23 at 3 month follow-up). Kuyk et al used the SF-12 at 2 and 6
months after an intensive inpatient program88 and reported a significant improvement in the mental
component summary (effect size 0.17), but a significant reduction in the physical component
summary (-0.24).
One study which found large positive results using a general QoL tool had a very different setting
and patient demographic to the other included studies. Vijaykumar et al evaluated the impact of a
community based rehabilitation programme on the QoL of 159 individuals in rural India who had
“no useful residual vision” (VA<1/60).151
daily living, consisting of self-care, mobility, social and mental subscales. There was a marked
improvement, especially in self-care and mobility subsections, but all effect sizes were very large
(above 1), although the method of effect size calculation was unclear. The authors commented that
the areas of improvement may have reflected the emphasis placed on physical rehabilitation in a
rural setting. Details of the rehabilitation were not given, but the demographic of the patients was
markedly different from most other studies, e.g. mean age 45 years. Some caution is needed
because the ‘general QoL’ instrument used in this study included many ‘activities of daily living’.
G. THE DIFFERENTIAL EFFECT OF LOW VISION SERVICE MODELS.
Unfortunately, it was not possible to assess the relative benefits of different service models across
studies because of the use of different outcome measures, follow-up times and diverse populations
studied. However, several studies evaluated the effectiveness of different service models side by
side, either in RCTs,115 or at least using the same outcome measures.41,43,48,49,60,102,115,141,149 Several studies have looked at the differential effect of optometric and multidisciplinary service
models and found little difference in outcomes.43,89,115,149 Reeves et al conducted an RCT to compare the effectiveness of three different models for low vision service provision.115 The first arm involved a standard optometric low vision assessment; the second intervention arm included
the same optometric low vision assessment plus a home-based rehabilitative intervention at 2
weeks, 4-8 weeks, and 4-6 months; the third arm included the optometric intervention plus
supplementary home visits by a community care worker with no formal training in low vision.
Outcome measures were obtained at 12 months and included the vision-related quality-of-life tool
VCM1, the Manchester Low Vision Questionnaire (MLVQ), and the Nottingham Adjustment Scale
(NAS). No significant benefits were observed for the enhanced services for any of the outcomes
measured (A few significant differences tended to favor the standard service and were attributed to
type I errors.).115
De Boer et al compared the outcomes of an optometric service with those of a multidisciplinary
service in the Netherlands in a controlled before and after study (patients allocated according to
geographic location) using VCM1 and LVQOL vision-related QoL outcomes measured at 1 year
post-intervention.43 There was a marked difference in the components of the two services. The
optometric service provided advice about which low vision aids to use and how to use them, with
low vision aids being ordered where appropriate, while the multidisciplinary service included the
above as well as training in activities of daily life by an occupational therapist, group or individual
counselling by a social worker/psychologist, and advice on adaptation of home environment where
required. Both services included follow-up appointments as required. This was a large study
subscale of LVQOL, which was better in the optometric group (although the authors attribute this
difference to possible type 1 errors due to multiple comparisons or to differences in baseline
mobility between groups). Van Nispen et al reanalysed these data using item response theory and
concluded that neither of the services contributed to improving vision related QoL, except for
reading small print.149
La Grow et al similarly reported no significant difference between NEI-VFQ 25 outcomes at 6 and
12 months between individuals undergoing a comprehensive (N=93) and a standard (N=93) low
vision service in New Zealand in a controlled before and after study.89
Stelmack et al used the VA LV VFQ-48 to assess the outcomes of an inpatient (Veterans’ Affairs
intensive service) and outpatient service (provision of LVAs, low vision evaluation, training in
LVA use and 2-4 therapy sessions) and found an effect size of 2.1 for the inpatient service but only
0.26 for the outpatient service.141 They commented, however, that the inpatient participants had a much lower level of visual function at baseline and therefore had more scope for greater
improvement through rehabilitation. There was also a significant gender difference between the
participants (inpatient 93% male; outpatient 62% male).
In an RCT, Dahlin Ivanoff and Eklund et al compared a ‘health education programme’ (an 8 week
group-based programme using problem solving therapy) with an ‘individual intervention’.41,48,49 At
4 months, the group undertaking the health education program (N=93) showed an improvement in
perceived security in 22 out of 28 ADLs, while those undertaking the individual optometric
intervention (N=94) improved in only 5 of 28 ADLs.41 At 28 months, the health education group
(N=62) retained a significantly improved level of security in 20 ADLs compared to baseline, while
the individual intervention group (N=69) showed a significant change towards decreased security in
12 ADLs.49 The individual intervention group also showed a significant decrease in independence
over the 28 month follow-up period, while the health education group did not.48 Similarly, there was
a greater reduction in general health score in the individual intervention group, as assessed by 1
item from the SF-36. The health education group appeared to have a more positive attitude towards
their state of health, reporting fewer health conditions.48 It should be noted that the novel analytical methods used by Dahlin-Ivanoff et al and Eklund et al preclude direct comparison with other
studies; however, the functional outcome measures used were clearly sensitive to the
interventions.41,48,49
Girdler et al provided further evidence in a well-conducted RCT of the positive impact of a
group-based programme on rehabilitation outcomes.60 The 36 participants allocated to the ‘usual care +
vision self-management’ group showed significantly better outcomes at 3 months than those in
depression (effect size 0.18), self-efficacy (effect size generalised self-efficacy 0.14; age-related
vision loss self-efficacy 0.30), and the SF-36 physical component summary (effect size 0.23). These
effect sizes describe the relative effect of the enhanced service.
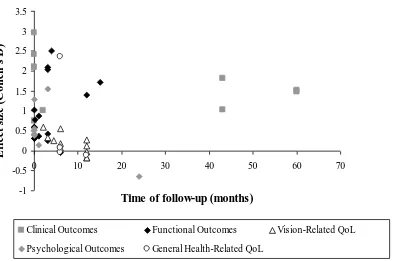
H. THE EFFECT OF FOLLOW-UP TIMING ON REHABILITATION OUTCOMES
The studies included in this report had follow-up times which ranged from immediately
post-intervention to 5 years (median 3 months, interquartile range 0-10.5 months). Figure 2 shows the
relationship between effect size and follow-up time for all studies where sufficient data were
available. There was no significant relationship between follow-up time and effect size (Spearman’s
Correlation; P>0.05), which might be attributable to all the other variables which differed between
studies (intervention model and dose, patient demographic, outcome measures employed), which
may have obscured the impact of follow up time.
Figure 2 about here
The studies that best demonstrate the effect of timing of follow-up are those that sample patient
outcome data at a number of time points. Kuyk et al compared outcomes of the intensive Veterans’
Affairs inpatients programme at 2 and 6 months post-rehabilitation.88 A greater improvement in
almost all subscales of NEI-VFQ 25 was seen at 2 compared with 6 months, but the difference was
small (effect size 0.59 at 2 months and 0.55 at 6 months). Kuyk et al found a larger effect size than
Stelmack et al, who also evaluated a Veterans’ Affairs inpatients service using the same outcome
measure, but followed up immediately after the end of rehabilitation. Kuyk et al suggested that this
discrepancy in outcome could be attributable to the difference in follow-up time and postulated that
the full effect of treatment will not be apparent until patients have had the opportunity to use their
new skills in their home environment.88,140
It is generally expected that the outcomes of rehabilitative intervention (particularly in older adults)
will decrease over time as the result of a general decline in baseline function.161 This expectation is perhaps reflected in the lack of positive effects observed in some of the studies that obtained follow-
up outcomes after a significant period of time.43,75,137 Stelmack showed that the beneficial effect of the Veterans’ Affairs inpatient programme was maintained, but reduced, at 12 months post-service
(LV VFQ 48 effect sizes were 2.035 and 1.405 at 3 and 12 months respectively).138 However,
Stelmack et al followed up patients from the Hines Veterans’ Affairs rehabilitation centre after 3
years137 and found that the improvement in visual ability seen at the conclusion of the service did not persist over this follow-up period. Horowitz et al followed up 155 patients at 20-27 months after
provision of a vision rehabilitation service, and only found a very small effect size (0.045) in terms
An RCT investigating the outcomes of a “problem solving” group health education program at 4
months and 28 months was unusual in showing a positive effect which continued for more than 2
years.41,48,49 The positive effect of the health education programme in perceived security in ADL was undiminished at 28 months, possibly because the “problem solving skills” acquired allowed
participants to meet new challenges as they developed further visual problems. It should be noted,
however, that 42% of participants (98 of 229) randomised at baseline were lost to follow-up over 2
years. Other parameters were maintained less well: there was a trend towards a decrease in
independence in ADL over 28 months, but this finding was not statistically significant, whilst
general health (one item from the general health-related QoL questionnaire SF-36) decreased
significantly over 28 months.
None of the studies have presented evidence for a halo effect (i.e. a peak in outcome effect at very
early times post service). Future work should obtain outcome data at regular intervals to chart more
precisely the change in effect that occurs as a function of follow up time and compare to a control
group.
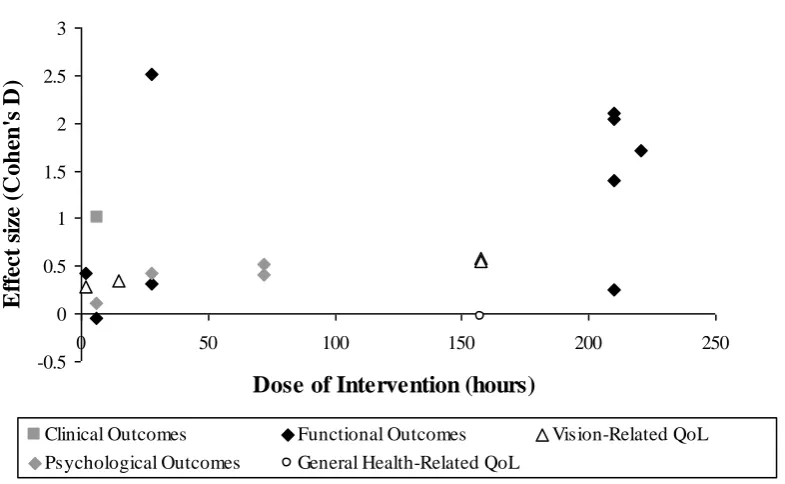
I. THE EFFECT OF REHABILITION “DOSE” ON OUTCOMES
The studies included in this review have used service models which differ widely both in terms of
“content” and “dose”. Many of the studies reviewed do not detail the number of hours of
rehabilitation provided, but a median of 24 hours (interquartile range 5.8-72 hours) was calculated
from the 20 services that allow an estimation of dose (this included any hours of homework
specified). The value is skewed towards a large intervention dose as the intensive Veterans’ Affairs
inpatient services, lasting around 40 days have been involved in a number of the included studies
(they include a ‘dose’ of approximately 210 hours, on the basis of 7 instruction periods per day,
each lasting for 45 minutes88).
Figure 3 plots the relationship between dose and effect size for the 11 studies that provided
sufficient information to calculate both parameters. There was a significant correlation between
dose and effect size (Spearman’s correlation coefficient=0.48; P=0.04), and it can be seen that,
generally, those services that provided a very high level of intervention showed medium or large
effect sizes. It should also be noted that the ‘dose’ has been plotted for the intervention as a whole,
not broken down into the different components of the service. It is possible that a stronger
relationship may be seen between the intensity of a particular element of the service and specific
outcomes pertaining to that aspect of rehabilitation.
Very large effect sizes have been reported for the high intensity Veterans’ Affairs outpatient service
in the LOVIT trial (10 hours clinical contact and 17 hours homework)143 and for other
high-intensity services.138,141 Several studies, however, reported a medium to large effect size without such an intensive inpatient intervention.. Goodrich et al provided a mean intervention of 6.67 hours,
and achieved an effect size of 1.01.61 Scott et al also showed medium effect sizes in NEI-VFQ 51
(0.59, near vision subscale) and VF-14 (0.42), although only 1-1.5 hours of service were provided
(including training) with no follow up.129 The mean number of devices provided was high (3.4 per
person), which may explain the specific improvement in near function.
A confounding factor in the comparison of the dose-effect size relationship in different studies is
introduced by the different levels of training that are likely to be required to achieve a positive
effect in different aspects of rehabilitation. For example, a larger ‘dose’ of orientation and mobility
training is likely to be required to result in an improved self-reported function than that required to
achieve a large improvement in clinically measured function with a magnifier (e.g. reading acuity).
Furthermore, studies differed in follow-up timing and outcome measures used, as well as in hours
of intervention, complicating the analysis of any relationship between dose and effect size in
different reports.
Several studies did directly evaluate the effect of service dose.52,72,126,141 Horowitz et al assessed functional and psychological outcomes at 6 months post-rehabilitation and found that change in
visual disability over time was not associated with number of rehabilitation service hours after
accounting for the level of disability at baseline (patients received a mean of 5.8 service hours, SD
7.9).72 The intervention was provided at various community rehabilitation centres, however, and it
is not clear whether the hours of service provided were determined by patient needs or by the
protocols of different service models within the study. Engel et al looked at effect of dose of an
orientation and mobility program on outcomes including performance of ADLs, physical health and
mental health.52 They found that an increased number of rehabilitative sessions were significantly correlated with fewer days in bed, fewer talks with doctors, less difficulty taking medicines,
increased frequency of hobbies and activities, whilst increased hours of intervention were related to
fewer talks with doctors, less difficulty with walking, increased hobby activity, and increased
moderate physical activity. The details of the magnitude of the correlations and the P-values are not
provided in the paper. Stelmack et al found a very large effect using the VFQ 48 following an
intensive inpatient Veterans’ Affairs rehabilitation programme (42 days) but only a small effect
following assessment of less intensive outpatient programmes at 4 clinics (2-4 visits), two of which
Despite the conflicting evidence, overall it seems that the larger effects reported in the literature
tend to come from intensive rehabilitation programmes e.g. 87,143, although other studies have shown
that it is possible to obtain a medium or large effect size with a relatively low dose intervention.61,144
J. THE EFFECT OF REHABILITATION ON OUTCOMES IN CHILDREN
The vast majority of the services included in this review were principally concerned with the
rehabilitation of elderly adults with visual impairment. Our literature search indicates that there are
currently no rigorous studies of interventions relevant to children. Corn et al measured reading rates
and comprehension in children (N=130) before and after issue of LVAs (optical magnifiers) and
showed a significant improvement in silent reading speed and comprehension (but, interestingly,
not in oral reading speed or comprehension).32 The authors did not control for an improvement with
time. Their subjects had at least four months of magnifier use, which may have been long enough
for a natural improvement in reading skills.
In a descriptive study Ruddock et al selected 57 children who were either in a school with a
resource base for those with a visual impairment, or in mainstream school, but considered by
teachers to have problems accessing near tasks.121 Of these children, fourteen had LVAs, and only 3
used them regularly. Once an integrated low vision scheme was set-up and 32 children assessed, 29
were given LVAs, and of these, 25 were making regular use of aids at review.
The paucity of information relating to children indicates that there is an urgent need for properly
conducted studies. Part of the reason for the dearth of studies may be that, until recently, valid
outcome measures have not been available for children. Most QoL questionnaires for children have
been developed from, or include, opinions and experience of caregivers and/or experts rather than
from the direct responses of children.8,27,62 More recently, focus group work with children and Rasch analysis have been used to develop an outcome measure of direct relevance to the lives of
children but it has not yet been used to evaluate service provision.84 There are other practical
barriers which hinder the assessment of vision rehabilitation in children, including the relatively low
prevalence of visual impairment in this age group113 and the numerous causes of visual impairment
in children, which often form part of wider conditions or disabilities, making this a difficult group
to research.12
K. THE COST-EFFECTIVENESS OF LOW VISION SERVICE PROVISION
We also tried to explore evidence of the cost effectiveness of low vision service provision. Only
two studies met the criteria for inclusion in the review: The single centre RCT set in Sweden,
programme compared with residential rehabilitation for legally blind American Veterans reported
by Stroupe et al.50,145
The single centre RCT set in Sweden, reported by Eklund et al, compared the cost-effectiveness of a
group “Health Education Programme” delivered to groups of 4-6 people with AMD, to ‘usual care’
using an individually designed programme.50 The 8 week program of weekly 2-hour sessions led by
a specially trained occupational therapist cost SEK (Swedish Krona) 6558 (£630) per person. Usual
care at the low vision clinic cost SEK 5907 (£567) per person. When calculating the total costs for
each service (SEK 28,004 [£2688] and SEK 36,341 [£3488] for the health education and usual care
services respectively) the clinical costs were added to external costs that resulted from aspects such
as ophthalmological care, home care, and housing adaptations. Differences in costs between the two
groups were not statistically significant; however, at 28 months there was a statistically significant
difference in cases showing an improved level of ‘security’ (45% vs. 10%) between those in the
health education programme and those receiving usual care. When looking at the total cost per
improved case (i.e. including external costs) the average cost for the “Health Education
Programme” was SEK 62,010 [£5,955] compared with SEK 358,216 [£34,399] for usual care.
Incremental cost effectiveness ratios were not calculated.
Stroupe et al evaluated the short term cost consequences of an outpatient (OP) rehabilitation
programme compared with residential rehabilitation for legally blind American veterans.145 The
program was designed to improve functional ability as measured by Veterans’ Affairs LV VFQ-48,
and changes in performing everyday tasks. Follow up was at 3-4 months. Both inpatient and
outpatient groups showed significant improvement in overall visual ability, mobility, and visual
motor skill at 3 or 4 month follow-up. When adjusted for baseline differences in LV VFQ-48 score,
age and gender using linear regression analysis, the inpatient group showed significant
improvement over the outpatient group. The costs for the inpatient group were higher, per inpatient
the cost was US$43,682 [£23,795] (SD US$8,854 [£4,823]) compared with the mean outpatient
cost of US$5,054 [£2,753] (SD US$405 [£221]); difference US$38,627.3 [£21,040] (95%CI:
US$17,414-US$273,482). Again, incremental cost effectiveness ratios were not calculated.
There were methodological problems with both studies.50,145 Full details of unit costs were not given in either paper and it was unclear whether all relevant costs had been included. The RCT
reported by Ekland et al50 did not detail randomisation methods and had a high drop-out rate. The
study reported by Stroupe et al compared treatment groups from 2 different trials; thus, it is possible
that there were differences between the groups impacting on the outcomes.145