DESIGN AND DEVELOPMENT OF AN AUTOMATIC RESIDUAL STRESS MEASURING DEVICE
by CIL\
Ian Hutchinson, B.E.
Submitted in fulfilment of the requirements for the degree of
Master of Engineering Science
UNIVERSITY OF TASMANIA ,HOBART
1.e
■
ck 0I declare that this'thesds d'oesn t contain anything that has been accepted for the award of a degree or diploma in any other university, and also that, to the best of my knowledge and belief, the thesis does not contain a copy or a paraphrase of material written and/or published by anyone else except where due reference to it is made in the text of the thesis.
ABSTRACT
This thesis describes the design and development of prototype automatic devices for the measurement of residual stress in magnetic materials. The device, called an "Automatic Rotation Rig", or ARR for short, uses the principal of magnetic anisotropy to determine the difference in the principal stresses and their direction at the surface of the material. The stress measurement is averaged over an area of approximately 5 mm by 5 mm, to a depth of about 1 mm.
Three such devices have been built in the period from
January 1987 to February 1989. These have been designed for the measurement of residual stress in railway wheels and tracks. Railway wheels may fail if the rim becomes sufficiently tensile, hence the device may be used to detect unsafe wheels and allow
for their removal from service. Continuous railway tracks are welded together to induce tension along their length. This
tension counteracts compression due to heating of the rail. Thus the ARR may be able to be used to determine the "stress free" temperature of the rail. This can be used to find whether or not the welding has induced sufficient tension into the rail, or at what ambient temperature the rail may buckle due to excessive longitudinal compression.
The residual stress measuring device can also be used for other applications where the difference imprincipIe stresses needs to be measured on reasonably flat ferrous materials. The device is portable and reasonably cheap and easy to produce. Prototype ARR's have proven to be reliable in field trials, thus leading to the possibility of thiem being manufactured
CONTENTS
ACKNOWLEDGEMENTS iv
CHAPTER
CHAPTER 1.
2.
INTRODUCTION
AUTOMATIC ROTATION RIG 1. 2.1 Design Development 2.2 Electronics Design
(a) Oscillator and Filter (b) Stepper Motor Control (c) Battery Charger
(d) HP-IL Interface Board
8
13 18 23 25
2.3 HP-IL Programming 26
2.4 ARR-1 Performance Summary 40
CHAPTER 3. AUTOMATIC ROTATION RIG 2.
3.1 Introduction to ARR-2 42
3.2 Electronics Design
(a) Oscillate Circuit 44
(b) SCm Preamplifier 49
(c),- SCm Filter 51
(d) SCp Amplifier 52
(e) SCp filter 54
(f) A to D Scaling 55
(g) Piezo Audio Warning Buzzer 56
(h) Temperature Probe 57
(i) Battery Charger 57
(j) Stepper Motor Drive 63
3.3 Probe Cable Design 64
3..4 JED Computer Board Connections 66 3.5 Modifications to the JED Board 67
3.6 ARR-2 Program Description 67
3.7 ARR-2 Performance Summary 86
Chapter 4. AUTOMATIC ROTATION RIG 3.
4.2 ARR-3 Electronics Design 90
(a) SCp Amplifier 91
(h) A to D Convertor Changes 92
(c) Probe Temperature Sensor 93
(d)Pieze Audiblc Warning tuz2er
94
(e) Probe to Chassis Connecting Cable 95
4.3 Program Changes for ARR-3 95
4.4 Performance Summary for ARR-3 98
CHAPTER 5. PROBE AND CHASSIS DETAILS FOR ARR-1, ARR-2 AND ARR-3
5.1 Probe Design 102
5.2 Chassis Design 114
5.3 Conclusions 115
CHAPTER 6. CALIBRATION AND TESTING OF THE 118
ROTATION RIGS
CHAPTER 7. CONCLUSIONS 123
REFERENCES 125
APPENDIX A. INSTRUCTION MANbAL FOR AUTOMATIC 127
ROTATION RIG 2
APPENDIX B. AUSTRALIAN PROVISIONAL PATENT 146
APPLICATION FOR THE AUTOMATIC ROTATION RIG
APPENDIX C. PROGRAM LISTINGS
(a) 41 CV HP-IL Program and 157
Flowchart for ARR-1
(b) JED STD-800 Program for ARR-2 165
(c) JED STD-800 Program for ARR-3 175.
APPENDIX D. EPROM MEMORY DUMP (ARR-2 AND ARR-3) 183
APPENDIX E. CIRCUIT DIAGRAMS
(a) ARR-1 CIRCUIT DIAGRAMS 186
(b) ARR-2 CIRCUIT DIAGRAMS 190
(c) ARR-3 CIRCUIT DIAGRAMS 196
APPENDIX F. JED STD 800 MODIFICATIONS AND WIRING 202
SCHEMATIC
APPENDIX G. PROBE CONNECTING CABLE SCHEMATIC 206
ACKNOWLEDGEMENTS
I would like to thank the following people for their
assistance during the period of research and development of this project:
My supervisor Mr. Richard Langman for his constant enthusiasm and help during the last two years
The workshop staff of the Department of Electrical
Engineering, Messrs. Steve Avery, Russell Twining, and John Grace for their effort and help in putting my ideas into practice.
The Railways of Australia committee for financing the
CHAPTER 1 INTRODUCTION
About twenty years ago Mr. Richard Langman was asked by his then employer, British Rail, to design a device that would
measure the mechanical stress in railway lines. This was done so that the effect of residual compression in continuously welded rail could be determined. At the time, Mr. Langman was
unsuccessful in developing a suitable device, based on magnetic principles, that could measure the residual and/or applied
stress in the rails.
Richard Langman continued his investigations in Tasmania from 1976. He was successful in developing a method, using the principle of magnetic anisotropy, that could measure the residual stress in magnetic materials to an accuracy of approximately
+/- 20 MPa. The principle of magnetic anisotopy is that the permeability of a magnetic material will increase in the
direction of mechanical tension (i.e. it is easier to magnetise the steel parallel to the direction of tension compared to that perpendicular to it). Hence, if we can measure the change in permeability with angular direction i then we can determine the magnitude and direction of the stress in the material. Note that this method only determines the difference in the principal
stresses, not their individual values. This limitation of the method is not that great if we assume something about the stress pattern. For example, if we know that one of the principib
stresses is either small or constant. This means that we can measure the stress in the other principal direction using magnetic anisotropy.
Magnetizing coil
(200 turns 30 Bond S wire)
lominotions
WI"
5Cmcoll
(2000 turns 486 end wire)
2Im 1st 2IMM
SC, coils
(loon (500 turns 488 end Sidra)
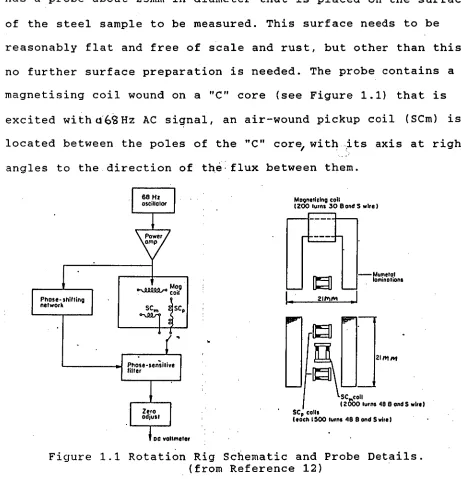
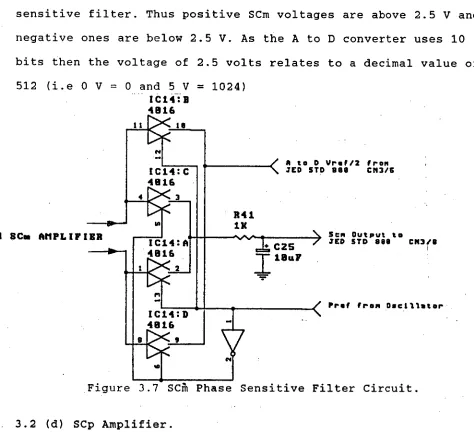
[image:7.554.39.500.103.582.2]1986 at which time a portable device had been built which was small, cheap and reasonably simple and easy to use. This device has a probe about 25mm in diameter that is placed on the surface of the steel sample to be measured. This surface needs to be reasonably flat and free of scale and rust, but other than this no further surface preparation is needed. The probe contains a magnetising coil wound on a "C" core (see Figure 1.1) that is excited withaGgliz AC signal, an air-wound pickup coil (SCm) is located between the poles of the "C" core, with its axis at right angles to the direction of the flux between them.
Figure 1.1 Rotation Rig Schematic and Probe Details. (from Reference 12)
During the production of the probe assembly, the airwound SCm coil is aligned so that in air, the output voltage from it is zero. This means that the axis of the coil is aligned exactly at_900 with the lines of flux between the poles. If we feed the output
sensitive filter will only allow the fundamental and odd
harmonics of the excitation frequency to be passed, all other frequency components being averaged out to zero over the
switching period. The signal level from the SCm coil, when the probe is placed on stressed steel is in the order of tens to hundreds of microvolts. This makes the signal susceptable to noise, but in practice the phase sensitive filter works very well in removing this.
If the probe is placed on un-stressed steel then the output from the SCm coil will be zero (i.e. the principle used here is a true "null" method). Placing the probe on a stressed steel
surface will give an output voltage from the phase sensitive
filter relating to the stress level. This is because the increase in the permeability towards the direction of tension causes a slight (1 to 2 degrees) change between the direction of H
(magnetic field strength) and B (magnetic flux density) developed between the poles of the C-core (B and H are normally parallel to each other in unstressed steel). The change in angle between B and H will cause a small voltage to be induced into the SCm coil.
With the output of the low pass filter connected to a digital voltmeter, then the whole instrument becomes a simple, cheap and reasonably accurate tool for measuring residual stress in flat magnetic materials. One of the problems with this
from the angular location of the peaks, the direction of the principal stresses.
Nothing was done to further enhance the operation of this instrument (called a "rotation rig") until the Railways of Australia Committee ("ROA") funded the development of an
automatic instrument based on the rotation rig. The instrument was to be used to measure the residual stress in the flange of railway wheels. This being undertaken to detect potentially unsafe railway wheels and allow for them to be removed from
service. The rotation rig was to be made automatic to remove the task of manually rotating the probe of the rotation rig and
calculating the stress value.
At present i railway wheels are subjected to heat treatment during the manufacturing process which is intended to leave the rim of the wheel in compression. The purpose of this is to help prevent the propagation of radial cracks from the tread of the rim. Because the brakes ot a train bear directly onto the rim of the wheel, then the deliberatly induced compression disappears during the service life of the wheel. Eventually, the rim of the wheel may go into tension. This is a potentially dangerous
situation as any cracks that start near the rim, may propagate through the wheel quickly. In extreme cases this may cause the wheel to fail catastrophically, with the possibility of derailing the train: This problem is more noticable on freight trains,
where the loads on wagons are higher than on passenger cars. This is further compounded by faulty or ill-adjusted brake sets on frei.ght trains (not normally a problem on passenger trains due to the stricter transport laws governing them).
into tension, is to paint the wheel with temperature sensitive ' paint. If the paint becomes discoloured or burnt to a depth of
four inches from the rim, then the wheel is considered to be overheated and must be removed from service (due to Federal Transport Laws). The problem with this is that up to 90% of the wheels removed from service for overheating may not have gone
into dangerous levels of tension and also that some of the wheels that have not been overheated, maybe defective (from Reference 11). This is because it is not only the severity of the overheating that causes the wheel to go into tension, but also the
cummulative effect of this overheating. As the discoloured paint method is not adequate in determining whether a wheel has been heat damaged, then railway authorities worldwide have sought a method which will non-destructively measure the residual stress
level in railway wheels. If the residual stress in the wheel was found to be excessively tensile, then it would be removed from service, thus eliminating the wasteful scrapping of wheels which are still serviceable.
The automatic version of the rotation rig could only perform this task if the measured difference in the principal stresses could be related to the circumferencial stress in railway wheels. Studies have shown that the radial stresses in railway wheels are either relatively constant or are small compared to the
circumferential stress and that the stress measured at the
After some prelimenary tests carried out in 1986 to
determine the validity of the method to measure the stress in ferrous materials, it was decided that a prototype automatic instrument was to be made by the University of Tasmania, with funds provided by the Railways of Australia Committee (ROA). The prototype device was then to be field tested by ROA to determine its ability to seperate "unsafe" tensile wheels from "safe"
wheels.
The first prototype ARR-1 (Automatic Rotation Rig number 1) was completed in 1987 and showed that the principle of operation looked promising. There were some shortcomings in the design of ARR-1, the main ones being the suitability of the instrument for portable field use in harsh environments and its speed of
operation. Both these problems were solved by changing the
chassis layout and the control computer, but the basic principle of operation of the device was not changed. The new field
prototype, ARR-2 (Automatic Rotation Rig number 2), was designed to, hopefully, withstand the rigour of field use, but at the same time be reasonably flexible to allow it to be modified to meet the requirements of the ROA, should this arise. This device was completed and dispatched to ROA in early 1988. It has been used in Western Australia by Mt. Newman Mining and Hammersley Iron (in the Pilbara region) and in Queensland, New South Wales and
Victoria by their respective state railways. During this testing period it has operated with few problems.
the results (unpublished, Reference 13) look promising.
Another rotation rig was built for the ROA called ARR-3 (Automatic Rotation Rig number 3). This works on the same principle as the previous two, but was built to measure the
residual and applied stresses in continuous welded railway lines. The ROA wish to measure the "stress free temperature" of the line
to within an accuracy of 6° C. This has to be done
non-destructively and also account for any residual stress that may be present in the rail due to its prior manufacturing and field history-. The stress present in the rail needs to be measured before and after the thermo-alumeric welding process. The ARR-3 appears to work well in determining the magnitude of the stress present in the rail, but not to the accuracy required by the railways (approximately +/- 10 MPa). In fact only x-ray or neutron diffraction techniques will give results that approach this accuracy, but the have their own problems such as the
expense of the equipment, the need for skilled operators and the potential dangerous nature of the equipment. There is also the need for special surface preparation of the metal under
examination (see Reference 14 for more detail on Barkhausen
Noise, Trepan-Ring and X-Ray Diffraction measurement techniques). At this time more research needs to be undertaken before it is known whether or not ARR-3 can be used to successfully measure the stress free temperature of railway tracks to the accuracy required by the ROA.
CHAPTER 2
AUTOMATIC ROTATION RIG 1
2.1 Design Development.
The Automatic Rotation Rig Number 1, or ARR-1 for short, was developed around the Hewlett Packard HP-IL system. This system is a serial communication link which allows the use of a simple
calculator/computer to control the operation of peripheral
devices, such as printers, plotters and scientific instruments. The instrument used in this case was a digital multimeter (HP 3468B) and the controller was a Hewlett Packhard HP 41CV
programmable calculator. The calculator was of the hand held variety and the multimeter had its own internal battery supply, thus allowing the complete instrument to be portable. The digital multimeter has an accuracy of +/- 1 microvolt, thus making it
suitable to measure the small voltages out of the SCm search coil (tens of microvolts). An interface board (HP82166C) was also
incorporated into the design to allow the calculator to control the operation of the motor needed to turn the probe through 360 0 . This motor was chosen to be a stepper motor with 7.5 0 steps. It had been found (see Example 2.1) that by taking 24 steps of 15° each that the maximum loss in accuracy in finding the magnitude of the peak voltages out of the search coil (assuming that it has• a SIN 2G change with rotation angle
e
) would be less than 3.4%. Thus the stepper motor can be stepped twice for each reading of the filtered SCm coil output to be taken with out to much loss in accuracy.The calculator is programmed to find the maxima and minima SCm voltages as the probe is rotated, calculate the resultant
/X
these peaks, calculate the direction of the principal stresses.
E AC44 STEP 1g
• •• MAX./ MIMI ANGLE F RoM
5iN29 PEAK _SC-rn VALug -4-- 7.6 °
• CIN (Z1(45) -S/A*(37-5)
. . MAXIMUM ERItoe
5//vIzxfs)
1 — 0-9659
1
= 0. 031- Example 2.1 Accuracy Using 24 SCm Readings.
The whole instument was designed to operate off 12 V DC
A
sealed lead-acid batteries that are charged from an internal battery charger that derives its supply from the 240 V AC mains.
To take a stress measurement, the probe (see Figure 2.1) is connected to the main electronics unit, containing the
calculator, batteries, battery charger and other electronics, by its flexible cable. The calculator and multimeter are turned on, with the MULTIMETER ARV-NORMAL switch set to ARR. The calculator is switched to "USER". Pressing thelE+ key starts the
initialisation program. This sets up the HP-IL loop. The main program then starts and rewinds the stepper motor starting position. From here the program steps the probe through 23 15° intervals, giving 24 positions with the probe momentarily
4e11") 4.% stationary.
SrPPEiQ MOTOR..
rAoSe-
S
6Y.C. ,TAT roN Con_ ei,2Ae CABLE
3Anor...
-C,cm coif_
Figure 2.2 Probe Assembly Schematic. ,t- MAXIMUM VAWE
r
.• SIN 20 =-. I
Fft1141...& ce3uPuNC-
PAcee cor/AfEcon/6-
In each of these positions the multimeter reads the SCm voltage, and in four out of the 24 it reads the SCp voltage. These values are digitised by the multimeter and sent via the
HP-IL loop to the calculator, where they are stored.
The HP 41CV calculator is programmed to display three values. The first is the quantity SCp. This value will change with the air gap between the end of the probe and the surface of the steel. It is not dependant on the stress level in the steel and can therefore be used to calibrate the sensitivity of the SCm reading. SCp can also be used as a guide to whether or not the probe is positioned flatly or correctly onto the steel surface. The value of SCp does not vary much as the probe rotates (about
A
1%) hence the average of the four readings of SCp, SCp, is
considered accurate enough. These values of SCp are recorded by the calculator when a maxima and minima value of SCm has been found.
The values of SCm have been found to vary almost
as SIN 24:i with angular position 0 (see Figure 2.2). There are normally 2 maximum and 2 minimum values of SCm per revolution of the probe when it is on stressed steel. Ideally, the two maximum peaks should be the same value, but in practice, mainly due to the imperfect alignment of the SCm coil in the probe, they differ. Similarily this holds for the two minimum SCm values.
.
404
• se
. s
a
. s
t
o,4
NM-1
olnAW2
sample). A Sc Coy)
A4):AWM -5e1
RVND
The calculator program finds the two maximum values, and averages them. It also finds the two minimum values and averages them. The difference between these two average values is taken and this is denoted SCm. The probe connections are adjusted so that when the probe is aligned with the SCm coil parallel to the direction of tension, then the SCm reading is positive. The units of SCm are volt (DC).
Whrn the R/S key is pressed on the calculator, the display will show the direction of tension. This is calculated in the program by taking the angle which is half way between the angular positions of the first maxima and the next minima (see Figure
4tv2_
2.3). InA production of ARR-1, the probe is wired so that this occurs (instead of giving the direction of compression in the
02-0, 9C;
31R.ELTIoN OF TENVOM (FROM .STARr Dv& PoSmcw
C.F eRc•A a
Az
MmWOM Seim VALUE Ai-iQ ii MAgtAIVM
Figure 2.3 Finding the angular position of principal tension.
This stress measuring process can then be repeated by pressing R/S again. Each reading takes about 90 seconds to
MPa) because different types of wheel steel give different
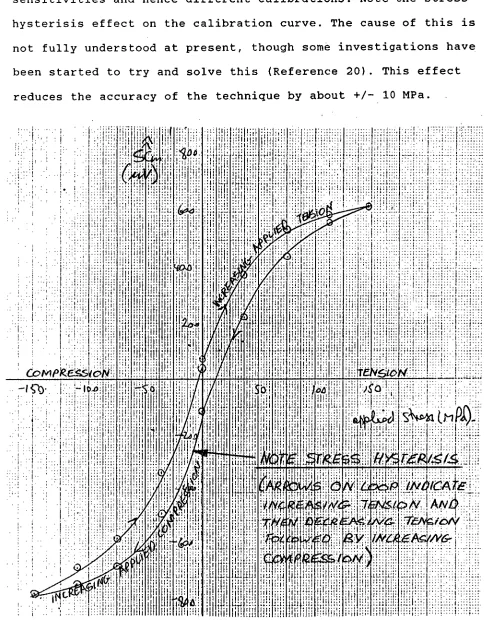
[image:17.554.25.509.94.714.2]sensitivities and hence different calibrations. Note the stress hysterisis effect on the calibration curve. The cause of this is not fully understood at present, though some investigations have been started to try and solve this (Reference 20). This effect reduces the accuracy of the technique by about +/- 10 MPa.
2.2 Electronics Design.
The following descriptions have been made with reference to the circuit diagrams of ARR-1 as shown in Appendix E (a). A block diagram of ARR-1 can be seen in the Provisional Patent
Application, Appendix B.
2.2 (a) Oscillator and Filter.
The oscillator used to derive the excitation signal for the probe was sourced from a design that appears in the Motorola
Linear Handbook (Reference 1). This oscillator was chosen because it was powered by a single ended supply, was simple and it
worked. The use of a single ended supply simplified the battery set up and the battery charger design.
The oscillator (shown in Figure 2.5) was designed to run at 80 Hz, but this frequency is not critical. It was found that the waveform produced was not very sinusoidal, but this did not seem to affect the performance of ARR-1 to any noticeable level. The oscillator is a modified Wien bridge Oscillator. Non linear
feedback is used to provide the correct level of feedback needed to maintain oscillation. This is provided by the two back to back diodes D1 and D2. This removes the need for a feedback
stabilising device, such as a thermistor.
+5 V
TO
Powe2
AMA/Fig/2 MO P11/56‘ Stfifr7cordir
The output from the LM358 Wien Bridge Oscillator is fed through a potential divider, a potentiometer to ground, in order to set the input level to the power amplifier. This amplifier is a LM380, used in the standard way (see Figure 2.6). It provides an adequate amount of power to the excitation probe. The signal from the oscillator is capacitively coupled to the amplifier via
the 0.1 pF capacitor. The LM380 is bypassed in the usual way to
prevent it becoming unstable and oscillating. The output from the power amplifier is fed, via a 1000/uF capacitor and a 1:2
autotransformf'r to the excitation coil. The capacitor value was chosen because it has a low impedance at 80 Hz. The
auto-transformer is used for impedance matching the excitation coil to the nominal output impedance of the amplifier. This was done
because the excitation coil used in this instrument was
originally designed for use with an LM380 operating off a higher supply voltage. Thus/ to obtain enough excitation power in the probe with the use of a 12V supply, the autotransformer was
included to provide a four to one impedance transformation. This increased the excitation current in the coil to an acceptable level.•
+12,V
EXLIT AT lag c_or L_
ARoG.E.
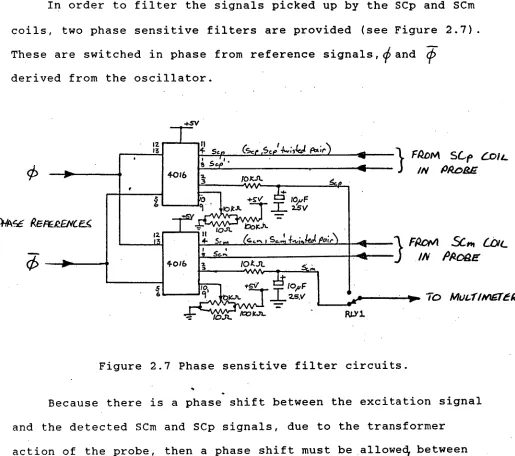
In order to filter the signals picked up by the SCp and SCm coils, two phase sensitive filters are provided (see Figure 2.7).
-- These are switched in phase from reference signals,Oand
q5
derived from the oscillator.+016
II
(se, ,Scf,14.4sled pct;r)
16---- s self,
2. /OKA.
FM Sri Gol IN PRollE
1Z 13
+s-V 100F
001- 2:5V
1171
Asc
Re,KkavcEK
12.
.1.;.,teet p,.
FRoM 5C01 Ctx
IN
PRoae-
ir. To Mut-1114E7ER_
II I
[image:20.554.25.540.51.507.2]4- 5.1,1 San
Figure 2.7 Phase sensitive filter circuits.
Because there is a phase shift between the excitation signal and the detected SCm and SCp signals, due to the transformer
action of the probe, then a phase shift must be allowed, between the oscillator and the phase referenc for the phase sensitive filter. This was achieved by using a variable low pass filter with its knee frequency set near to the oscillator frequency (see Figure 2.8). Thus, VR2 can adjust the phase of the reference
signal with respect to the oscillator signal. Because the output of the oscillator has a DC offset of 2.5 V then the "ground" end of the phase shift network is set at 2.5 V DC from the 2.5 V DC offset point on the Wein bridge oscillator. This is filtered by a 220)AF electrolytic capacitor to ground.
•
AW44..ig REAgOZENCES . ANC SiAhieHED AZTEWS Nose Sla-t Ne4140,4k
ZOO Ic..r2.
Phase)W22.
R2c4,4 cgoaAkk OuTPOr 17F
2.5" V "F•RoM or
OsctuAroR_
220,,F 3.5v
shifted reference signal is fed through two LM358 operational amplifiers acting as comparators. This gives complementary 5V amplitude squarewaves,16and cp, , phase shifted from the original excitation frequency. Each of the 4016 Quad CMOS switches is fed from the search coils via twisted pair. In order to filter the signals, in turn, and in phase with the oscillator reference
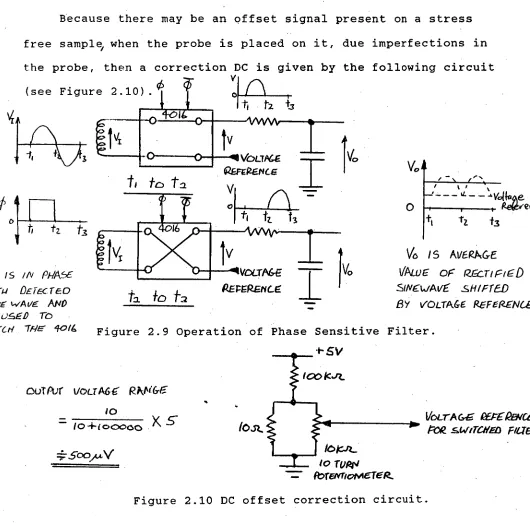
signal, one of the leads from the search coil in connected to the output low pass filter and then to a DC offset circuit. The other lead is connected to the same points but 180 0 out of phase with the other lead (see Figure 2.9). This effectively full wave
rectifies the signal detected in the probe. The resultant output consists of the fundamental and odd harmonic frequency components of the signals from the search coils. These are further filtered into a DC signal by a single pole low pass filter, consisting of a 10 kliresistor and 10)vF electrolytic capacitor to ground. This DC signal is proportional to the level of excitation signal that is detected by the pick up coils and hence, in the case of the SCm coil, is related to the level of stress in the steel surface under investigation.
V
(see Figure 2.10).
-
t
3
MbLTAGE REFERENCE
V
ti tz
0
is ifv pilA56 ra DETE-Cr Eo01/E" AND iS USED Tb
TicA5 40/6
[image:22.557.15.545.38.561.2]ta
fo
Figure 2.9 Operation of Phase Sensitive Filter. -1- 51/
vo
1-■
k
-4Volitvie
0 w;ievia
tt
tz 1.3Vo IS AVCRAGE Awe' or tz -r-irt6-40 SINCWAVt .SHIFTED
BY
VOLTAGE REFERENCE.REMRENCE I WNIAGE
••••
-;- 3-00/AY
— 10 4-
( °
pop°X
10
OUTPUr VOLT A6C Rktare:
VccrA Crg PEPE" A5vCe Paz still-a/ED WEI&
lost.
101c-2. to TURN
tbrarrionieTER,
Because there may be an offset signal present on a stress free sample, when the probe is placed on it, due imperfections in the probe, then a correction DC is given by the following circuit
Figure 2.10 DC offset correction circuit.
This allows very fine ajustment of the DC offset. The range of adjustment given is approximatly 500),CV DC. This adjustment is usually set so that SCm is zero for the probe on a stress free steel surface.
1'1\3 a OAt
1)A2.. _ 6
D Q RELAY
foLvER
D Q
VTR
D Q 7 D 7F", 71-Lsi71-
fr
aDAVO
HP-IL
CommRrER. HP 92.164c
1
To wP-k_
I.
IN4eo2.at RLY 51dIrCA
Li
Scm151, ReLay [image:23.554.41.515.45.561.2].11••••
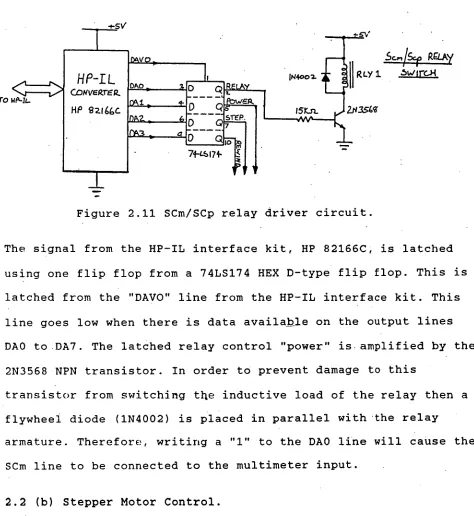
Figure 2.11 SCm/SCp relay driver circuit.
The signal from the HP-IL interface kit, HP 82166C, is latched using one flip flop from a 74LS174 HEX D-type flip flop. This is latched from the "DAVO" line from the HP-IL interface kit. This line goes low when there is data available on the output lines DAC) to DA7. The latched relay control "power" is amplified by the
2N3568 NPN transistor. In order to prevent damage to this
transistor from switching the inductive load of the relay then a flywheel diode (1N4002) is placed in parallel with the relay
armature. Therefore, writing a "1" to the DAD line will cause the SCm line to be connected to the multimeter input.
2.2 (b) Stepper Motor Control.
The control of the stepper motor has two modes of operation. Firstly the motor is stepped in the forward direction two steps at a time under the control of the HP 41CV calculator. When it has reached the end of its rotation (after 23 double steps of the motor) the calculator is informed that the correct number of
ib-"Two sTEP4'.
cobTPur
74-LS 174
s
.sreP D Q
[image:24.554.48.543.25.655.2]EP
Figure 2.12 (a) "Two Step" circuit.
(LOCK,.
crEP1
GC' i•C4.5 °
Q.
a.5.1.1111
'-'2.sTeP"
OurPOT
Figure 2.12 (b) "Two Step" circuit timing diagram.
Figure 2.13 Clock circuit
In order to make the stepper motor step twice under command, a "Two Step" circuit was devised (see Figures 2.12 (a) and (b)) to give two pulses to the stepper motor driver integrated
clock circuit is a typical "three cmos inverter" circuit and is shown in Figure 2.13). The "STEP" line is latched in the same manner as that for the SCm/SCp relay as described previously. When this line goes high, the output of the first D type flip flop goes high after the next rising clock pulse. After the
second clock pulse the second flip flop output, Q2, goes high and after the third clock pulse rise, the output of the third flip flop goes high. If we combine the outputs of the first flip flop and the inverted output of the third flip flop, with an AND gate, then we get a signal which goes high for two clock pulses in
duration. If we now AND this with an inverted clock signal we get two clock pulses at the "2STEP" output. The timing diagram
(Figure 2.12 (b)) shows the timing of this operation. The cicuit will only give two pulses out while the STEP input remains high. It will only give another "TWO STEP" output when the STEP input goes low and then goes high again.
The Clock for the stepper motor is provided by a simple CMOS clock circuit (see Figure 2.13). VR4 was set by experiment to give the maximum stepping rate for the stepper motor that does not cause it to miss steps under the inertial load of the probe assernbly. The frequency of the clock was set to approximately 100 Hz.
The direction of rotation of the stepper motor is controlled by the Hall effect limit switches which are mounted at the
of the probe has been reached (in either the forward or reverse direction) the MSRQ (message request) line on the HP-IL board is pulled low if either of the outputs from the inverters goes low. This is achieved by an OR gate and then an inverter. This whole circuit thus has the effect of a NOR gate, but since this would require the use of an extra integrated circuit, the circuit was designed to use the gate out of a quad OR gate (as other elements of this were needed elsewhere in the cirCuit).
rgaVi
H L
wrefe.F-AcE+5V
KA
,
55 -p- OlPCrIcN
_Et
r-fe-/L, 4 MSRO 2
WEIZFACe
itwx+ 044332
Figure 2.14 Stepper motor direction control.
In order to give a direction signal for the stepper motor, the two signals from the limit switches are fed into a JK flip flop. The flip flop can be reset with the TRIGGER line from the HP-IL interface. This allows the direction of rotation to be set to the rewind direction at any time, under control of the HP 41 CV calculator. Hence if the equipment is turned on and it is detected from the limit switches, via the MSRQ line, that the probe is not in the rewound position, then it can be rewound to its starting position under the control of the calculator. The direction signal is fed to the SAA 1027 stepper motor driver IC via a 5V logic to 12 V logic convertor. This is an opto isolator
mou.teol )
ow, EFFEr-r jdnvr3 ,-/IMME
swiftltes are Thanmet
thi
RS
307 -
44-6
RS 3 07 -
44-6
3
I KA-
74c-04-
7
which effectively converts the voltage and also provides
isolation of the electronics supplies from that of the stepper motor, thus helping to reduce interference to the filter cicuit.
In order to allow the stepper motor to step using the "Two Step" circuit in the forward direction and to use just the clock pulses in the reverse direction, the following logic circuit was used (see Figure 2.15). This allows the clock pulses to be fed to the motor when the direction is correct (i.e. after the probe is
M
at the end of its travel and has set the direction flip flop). This is controlled also by the calculator, which sets the REWIND line high via DA3 from the HP-IL interface board. In order to allow clock pulses to be fed to the stepper motor drive IC they are AND'ed with the DIRECTION line as well as the REWIND line. The output of this is OR'd with the output of the "Two Step" circuit
(these being mutually exclusive events).
CLOCK --al
L
_) D
To 1,5refP„
"two sTEP'„ s INPUT-
"gEWIN DA
DIRECT/oft/
Figure 2.15 Stepper motor logic circuit.
STEPPER.
Motoli
0.1/IF 2-1•13566
()FEIWk Morck soPPtY com-0204_
+12.‘%(4",,,
,„, slept.- -0+0- supPly °nix)
STEPPER MOTOR 5 UPPLY
Svitrc.
4-70J2..
STEPPER
MOTOR-ORJ VER. IL.
12.
+5v
SV LcGic. TO —
23/- c-06.
_ on/v&Rroft
p So a or
_L- 5V Locdc. To —
,12.V Loc,(c. coNVERTOR
(oe° - tsolgtoe)
"OtREcnope"INPor •
protect the switching transitors from switching off an inductive load, flywheel diodes are placed across each of the four poles of the stepper motor. These were chosen to be 1N4002's.
The power to the stepper motor is turned off when it is not being used in order to conserve the battery power. This is done under control from the HP 41CV calculator, via the DA1 port of
[image:28.554.25.506.94.731.2]the HP-IL interface board. This signal is latched by one flip flop in the 74LS174 and amplified by a 2N3568 NPN transitor in order to drive the BD140 power transistor, which is used to switch the 12 V supply to the stepper motor off and on (see Figure 2.16).
Figure 2.16 Stepper motor drive circuit,
The battery charger uses constant voltage charging for the 4 lead calcium batteries (see Sheet 2, Appendix E (a)). These
batteries are sealed and can be mounted and charged in any position. The particular size of 1.9 AH was chosen to give the instrument sufficient battery life when operating in the field and also because they were a convienient size for mounting in the chassis. They are charged at a constant voltage of 14.4 V. This is not the highest voltage that these batteries can be charged at. This means that the charge rate is not very high, but the batteries can still be charged overnight quite easily.
The constant voltage charging supply is provided by a 240 V to 18 V '60 VA transformer which is rectified by a 10 A full wave rectifier bridge and filtered by a 470 1 AY capacitor. The voltage is regulated by a LM350 voltage regulator, which, using a typical circuit, is adjusted to give an output voltage of 14.4 V DC. This provides a 1.5 A maximum, constant voltage supply to charge the batteries. If the batteries flat then they may have a
terminal voltage of 9 V DC or so. In order to prevent this condition causing excessive current being drawn from the
regulator, two series current limiting resistors are provided. The batteries are arranged in order to seperate the stepper motor supply from the supply for the electronics, thus helping to redilce interference to the small SCm voltages from the stepper motor drive.
To simplify the switching arrangement for the batteries to be charged,' a double throw double pole 2 A switch is used to switch the output from the current limiting resistors to the
batteries. This switch is also used to connect the batteries to the rest of the equipment when it is turned on. In order to
the following method was used:
Assume that the battery terminal voltage is 9 V when it is flat
The output of the voltage regulator of the battery charger is set to 14.4 V DC.
This means that there must be a 5.4 V drop between the voltage regulator and the batteries, when they are flat. The maximum charging current for these batteries is 0.47 A. As there are four batteries, with each current limiting resistor in series with two batteries in parallel then the maximum current through each resistor is 0.94 A.
Therefore each resistor needs to be 5.4/0.94 = Thus choose 6.8,2-resistors to be on the safe side. Check power dissipation in each resistor
P = 5.4*5.4/6.8 = 4.2 W Therefore use 5 W resistors.
To protect against damage to the wiring by shorting the batteries to ground, fuses are placed in the supply lines to the ON/OFF switch.
A 5V DC supply is provided for the electronics via a 5V
regulator, a 7805. This provides a 0.5 A supply. The circuit used is as per the Motorola Linear Handbook (see Reference 1).
2.2 (d) HP-IL Interface Board.
The HP-IL Interface Board was taken from the circuit
diagrams from the HP 82166C Interface Kit Technical Guide (see Reference 7). This kit provides a link between the HP 41CV calculator and the "outside world" via the HP-IL serial communications loop. The kit provides all the neccessary components and technical information needed to build the
circuit board was designed by the author for this application. The board also contains all the logic for the stepper motor
control. The circuit board layout is not included in this thesis as ARR-1 was a laboratory prototype and a similar rotation rig is unlikely to be built again.
2.3 HP-IL Programming.
The program for ARR-1 is written in the "language" used by the HP 41CV calculator. This language uses the normal instruction set (see Reference 6) for the calculator along with some special instructions that are used with the HP-IL serial interface loop and the other devices connected to it. A flowchart showing the operation of the control program,, as well as the program listing is shown in Appendix C (a). These can used as aids to the
following program description. In this listing note that the comments to the program have been added in and are not included in the •HP 41CV memory.
In order for the progrii'm to run correctly the HP-IL module must be plugged into the calculator and connected in the correct manner to the HP 3468B multimeter and the HP 82166C interface kit. The HP 000041-15043 HP-IL Development Module must also be plugged into the HP 41CV calculator.
or cleared by the user of the calculator with the normal clear flag (CF) and set flag (SF) keystrokes (this flag is not cleared when the calculator is turned on). As the HP-IL loop will not operate if this flag is set, then it must be cleared. This can only be done conveniently by the module program "CF 33" (the other method is to remove the calculator batteries to give a memory lost condition, which is inconvenient).
The HP-IL loop is then set up for automatic loop operation by the "AUTOIO" command. This assigns device numbers to each peripheral device connected to the loop. These need to be used when "talking" to them from the loop controller (the calculator in this case). Hence their loop numbers are obtained by finding their assigned identification numbers. This is done by using the "FINDID" function of the HP-IL module. These identification
numbers are stored for future reference.
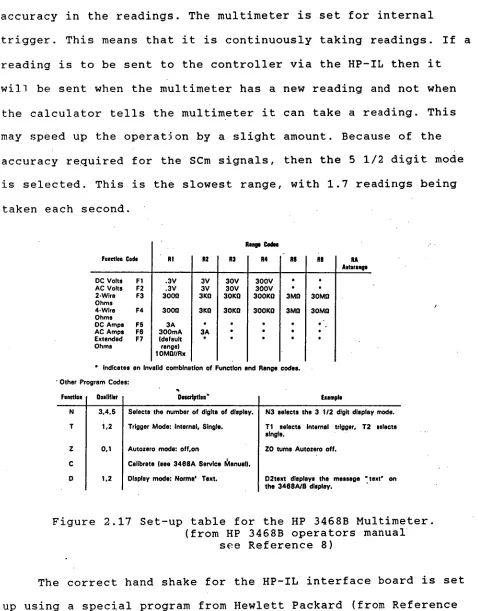
accuracy in the readings. The multimeter is set for internal
trigger. This means that it is continuously taking readings. If a reading is to be sent to the controller via the HP-IL then it will be sent when the multimeter has a new reading and not when
the calculator tells the multimeter it can take a reading. This may speed up the operation by a slight amount. Because of the
accuracy required for the SCm signals, then the 5 1/2 digit mode is selected. This is the slowest range, with 1.7 readings being taken each second.
Function Cads RI RS
Rasps Cedes
R4 RS Re RA Attorms DC Volts Fl .3V 3V 30V 300V • •
AC Volts F2 .3V 3V 30V 300V
2.Wire F3 3000 3K0 30K0 300K0 3M0 30M0 Ohms
4-Wire F4 3000 31(0 30K0 300K0 3M0 30M0 Ohms
DC Amps F5 3A •
AC Amps F6 Extended F7 Ohms
300mA (default range)
3A
•
10M0//Ax
• indicates an invalid combination of Function end Range codes. ' Other Program Codes:
um= umm umnpu umm
N 3.4,5 Selects the number of digits of display. N3 selects the 3 1/2 digit display mode. T 1,2 Trigger Mode: Internal, Single. Ti selects Internal trigger, T2 selects
single.
Z 0,1 Autozero mode: off,on ZO turns Autozero off. C Calibrate (see 3468A Service Manual).
[image:33.554.39.517.49.660.2]D 1,2 Display mode: Norms' Text. D2text displays the message "text on the 3468A/8 display.
Figure 2.17 Set-up table for the HP 3468B Multimeter. (from HP 3468B operators manual
see Reference 8)
The correct hand shake for the HP-IL interface board is set up using a special program from Hewlett Packard (from Reference 9) called "WGPIO". This program allows the control registers of the ILB3-0003 HP-IL integrated circuit to be altered. The
units is set to 255. This means that the total DAVO pulse length is 13mS. All other handshake functions are as per the default values (see Reference 7). The program to set up these registers
is described following. The statistical registers are set to begin at register 20 and the initialisation program returns to
the main program.
The main program now continues with a program label, called "SET" which allows the operator to start at the beginning of the program, but without needing to go through the time consuming initialisation procedure if it has already been done. This
function can be seen as a "reset" one, i.e. a new set of readings can be taken, after terminating the operation of ARR-1. This
program label can be allocated to the keyboard of the HP 41CV calculator, so that it can be run under the "user" mode.
The next label on line 04 is the main loop label 06. This is where the program returns to take a new set of readings. Directly after this, the stepper motOr is directed to rewind the probe to its starting position. This is done by the sub-program "REWIND".
010010102. This allows the correct logic signal to be sent to the quad latch circuit connected to the output port of the HP-IL
interface. The end of line characters must be supressed so that the ASCII value of "J" is stored and not that of the end of line character. This is done by setting flag 17. The "OUTA" command sends the control character to the HP-IL interface.
The program then pauses in order to allow the stepper motor time to rewind. The error counter is checked to see if it has exceeded five. If it hasn't then the program goes to line 16 where the status register of the HP-IL interface is checked to see if the MSRQ has been set. If it has, flag 00 has been
set, if it hasn't, then the program returns to line 04 and
repeats the process. If the MSRQ has been set, then the probe has been rewound, so the program returns to the main program. The program will only try to rewind the motor five times. If the
probe has not been rewound after these attemps then it is assumed that something is wrong, Hence a message "NO REWIND" is displayed on the calculator screen. The program then stops. If the operator wishes, the main program can be run again by pressing R/S on the
calculator keyboard.
With the probe successfully rewound to its starting point ,the main program, starting at line 06, starts taking readings from the probe. The main loop counter is set on line 06 so that 24 readings are taken at 24 different angular positions. Storage register 01 keeps the loop counter value. Lines 08 to 14 clear the various registers used to store the minimum and maximum SCm values and the average SCp values.
The main program then branches to a sub-program called "READING". This subroutine takes a SCm reading. This first
will now be described.
The SCm reading program first recalls the identification number of the HP 3468B multimeter from storage register 3, sets normal end of line character, and then selects the multimeter as the device which the calculator wishes to communicate with. On line 05 the multimeter is triggered, which means that it will trigger the multimeter to take a voltage reading. The IND command on line 06 tells the multimeter to send the voltage reading as a serial data stream on the HP-IL. This is recorded by the
calculator. The reading program then returns to the main program. The SCm voltage obtained is stored in two storage registers, one is used as a temporary storage register (05) and the other
(18) is used to compare the reading obtained from this first position with that obtained later for the last stepped position of the probe. The main program now steps the stepper motor to move the probe to the first of the twenty three angular positions remaining.
The "STEP" program is another sub-program. Firstly this program selects the HP-IL interface board (lines 01 to 03). The normal end of line characters are deleted by the use of SF 17 on line 04. This is done, as in the rewind program, so that the stored data for the stepper motor drive circuit is the correct control command and not the end of line character. The correct command for the steping of the motor is "F". This will turn on the power to the stepper motor and allow the "two step" circuit to send two step pulses to the stepper motor drive integrated circuit (SAA 1027). These two step pulses will then move the
presved. This is done by lines 06 and 07. The step program then returns to the main program.
The main program now clears the flags used by the program. Flag 08 is set when the first maximum is found, flag 09 is set when the first minimum has been found and flag 10 is set when two maximums and two minimums have been found. This is done because if the stress reading is taken under normal conditions, we would expect there to be two maximums and two minimums in the 24 SCm readings. If this occurs/ we know, to some extent, that the stress reading has been taken correctly (unfortunately, further work has shown that this may not be the case for all stressed steel
samples, hence the program used in future ARR's was modified to tackle the problem of getting SCm values using a different
algorithm).
The main program now enters the main reading loop at line 22. In order for the signal levels at the output of the filters to settle to a steady value, as the stepper motor to comes to a complete stop, the program pauses for 1 second at line 23. The program then takes another SCm reading from the multimeter using the "READING" sub-program as described before. This reading is stored in the temporary storage register 12 and then the program checks how many readings have been taken. If 24 SCm readings have been taken then the program will jump to the output stage of the program; If more SCm readings need to be taken, then the program will continue to get these and more SCp readings as well.
results. If the two maximums and minimums have not been found then the program proceeds to find more SCm readings. At this stage (lines 33 to 36) the program checks the SCm results taken so far to see which is bigger. The value that was stored in the temporary storage location 12 is stored in location 05 for use later in the program. The trend of these results will show whether or not the readings are increasing to a maximum or
decreasing to a minimum. Here the program splits into one of two paths depending whether or not the readings are increasing or decreasing in value.
If the SCm readings are increasing then the program branches to label 10 on line 73, otherwise the program keeps going to
label 12 on line 38. In both of these paths another SCm reading is taken (the probe already being rotated to a new position
previously). This allows a time delay to allow the probe to stop rotating and for the filters outputs to settle to their new
values. This reading is stored in register 12. The previous SCm value from storage register 05 is compared to this new value. If this new value is greater than the previous one, then we have found a minimum SCm value. The program goes to line 52, or label 13 and checks to see if this is the first or second minimum found by checking if flag 09 has been set. If it is not set, then the first minimum SCm value is stored in register 06. Flag 09 is then set in order to indicate that the first minimum has been found.
If the first maximum has been found (indicated by flag 08 being set) then on line 58, the program will test to see if the sequence first SCm maximum then next SCm minimum has occured. This is used to get the angular direction of the principal
angle half way between the position of the first maximum and next minimum. Thus if flag 08 has been set, then we have the correct sequence and we need to store the angular position of the probe (obtained from the loop counter). This is done from line 66, or label 26. To correct this value, 1 is subtracted from the loop counter and this is stored in register 10. Flag 10 is set to indicate that the angular position of the principal stress has been found. Note that flag 08 is cleared when it is checked on line 58. This prevents the process of finding the angular
position of the principal stresses from being repeated if we find another sequence of SCm maximum followed by 'a SCm minimum.
If the minimum we have just found is not the first one then we go to label 14 on line 61 and store this SCm value in storage register 07. Flag 09 is cleared to indicate that we have found two minimums.
If the program has not found a minimum , then it stores the last SCm value in storage register 05, increments the loop
counter and if the total number of readings have not been taken, steps the motor (line 50) and then returns to line 38 to get another reading. If 24 SCm readings have been taken then the program goes to line 125 to check the last SCm value with the first SCm value obtained.
The program for finding the positions and magnitudes of the maximum SCm values works in the same manner except that the flags and storage registers are different (and it finds maximums
of the program to do this starts at line 101 or label 03. Firstly the HP-IL interface board is selected and then the character "A" is sent to it to control the position of the relay. The relay connects the SCp signal to the multimeter. The program then
instructs the multimeter to get a reading on line 107, using the sub-program "READING". Thus the SCp reading is stored in register 04. Note that the store instruction used here, is a "add and
store" instruction "ST+". Thus register 04 contains an
accumlative value for SCp. Later in the program, in order to calculate the true SCp value, the stored value is divided by four. This means that the displayed value for SCp is an average one. In order to check that four readings of SCp are taken as expected (we assume that there should be two maximums and two minimums SCm values found) the number of SCp values taken is stored in register 13. The program then checks to see if we have completed the required number of readings. If we have, then the program goes to the output routine. If not, then the stepper motor is stepped again to a new position and the program returns
to the start of the main loop again after the "old" value of SCm is stored in register 05 (so that it can be compared with the new SCm value about to be taken). The above process is repeated until all the 24 SCm and 4 SCp values have been taken.
are stored in the relavent storage registers. This is 07 for the second minimum and 09 is the second maximum SCm value. If either the second maximum has been found, or the second minimum, then the program goes and gets the fourth value of SCp at label 25 (at line 146). This program is a repeat of the program used
previously to get the SCp values by switching the relay at the input to the multimeter.
If all the readings have been taken then the program has reached the output stage. This starts at label 08, which is on line 156. The program first checks that the probe has reached the end of its travel, and has made 24 SCm readings at 24 different angular positions. This is done by selecting the HP-IL interface and reading the status register using the "INSTAT" function. If Flag 00 has not been set then the MSRQ line is not low. This means that the stepper motor has not reached the mechanical stop at the end of its travel. Hence a "stepping error" has taken place and the results awe not valid. In order to warn the
operator of this error, the message "STEP ERROR" is placed on the screen of the calculator using the PROMPT command (see lines 165 to 166). In order to give a audible warning to the operator of this condition, the TONE command is used. This beeps the internal piezo buzzer in the HP 41CV calculator. This is done on line
164. The tone frequency is set by the number following the TONE command.- The value of TONE 5 was chosen so as to distiguish the warning of a step error from the other audible beeps used in the rest of the program. If there has not been a step error then the calculator proceeds with the rest of the calculations.
readings taken. then the calculator will display a warning to the operator. This is done from lines 231 to 234, in a similar manner to that used to warn the operator of a step error. The warning to the operator in this case is "SMALL SCM". This warning should ideally be "SUSPECT SCM", qs the usual condition for other than four SCp values, or more accuratly two maximum and two minimum SCm values, is when there is little stress in the sample being measured. This condition gives an almost constant SCm output near to zero. Hence it is difficult for the program to accuratly
determine the peaks of the signal as the probe is rotated. If the operator wishes to continue after this warning the R/S button is pressed and the program goes to the start again (line 04).
If the correct number of SCp readings have been taken then the program calculates the average SCp value by dividing the contents of register 04 by the contents of register 13 (which equals four). The display is then set to give four decimal places
(by using the FIX 4 command on line 175) and the average SCp /\ value is displayed on line 175. In order to mix the numerical SCp data will the prompt "SCP=" then command "+ is used along with
the command "ARCL X" (alpha recall X register). This combines the alphabetical string with the numerical data stored in the x
register of the calculator (the SCp value) into an alpha-numeric message. The calculator then beeps to indicate that a reading has
successfully been taken and stops on line 181, awaiting further command from the operator with the SCp value dispayed on the LCD calculator screen.
R/S button on the calculator keyboard. This starts the program running again from line 182. Between lines 183 and 193 the calculator gets the average of the two minimums, stored in
registers 06 and 07, and subtracts this from the average of the two maximums stored in registers 08 and 09. This difference in
/\
the SCm values is related to the stress in the steel. The
averages of the extreme values are taken to enhance the accuracy of the measurement method. The SCm value is stored in register 14 for display later on. The next algorithm, from line 195
calculates the direction of principal stress. This is done by finding the angular position half way beween the first maximum and the next minimum. As the step position of the first maximum and the next minimum are stored in registers 11 and 10
respectively, then the angle half way between them can be found by averaging the two step positions and then multiplying this value by 15. This is done because each "STEP" routine rotates the probe 15°. On line 235 the calculated angle of the direction of principal stress is checked to see if it is less than or greater
than 135°. If it is less than 135 0 then the SCm value is deemed to be tensile and hence is given a negative sign. If the angle is greater that 135 0 , then the SCm value is considered to be
compressive and its sign remains unchanged. The angle value is stored in register 15 on line 203 and the correctly signed SCm value is combinedwith the message "SCM=" on lines 212 to 214. The SCm value is displayed on the calculator screen on line 215 as an alphanumeric display and the program stops. In order for the operator to know the angular direction of the principal stresses the R/S button is pressed.
=". This is done between lines 218 and 221. The display is set from 6 decimal places as used in the SCm display (on line 182) to no decimal places for the angle display. Hence the angle
displayed is in degrees. The program now selects the interface board and sends the command "A" to the control register. This controls the relay to switch the multimeter to display the SCp value continuously on its display. This is done so that the probe can be checked that it is correctly positioned on the steel and also so that the level control on the front panel of ARR-1 can be reset, if needed, to the correct SCp value of 80 mV (this may have drifted with time and temperature). The program then stops and awaits command from the operator. The readings may be retaken by pressing the R/S button, this returns the program to label 06 and the whole process is repeated.
The programs "WGPIO" and "RGPIO" were obtained from the HP-IL Development Module Manual (see Reference 9). These programs allow the programmer to write and read any of the control
registers of the HP-IL intergrated circuit. Thus the handshaking etc. can be set up at will. Some of the commands used by this program are from the HP-IL development and as such will not work if the module is not plugged into the calculator. These commands are a manual way of excecuting HP-IL commands that are normally carried out automatically about the loop. Note that there is an error in the WGPIO program in the manual. After the 0 DDL
sequence there should be the commands "0 PT=". Also note that the programs used in this application finds the required device
2.4 ARR-1 Performance Summary.
In general the equipment worked well, but there were a few problems which needed to be solved before it would be useful in the field. The first problem was that the equipment was far too slow in obtaining a set of readings. This was due to a
combination of factors. Firstly the HP-IL is slow in
communicating the messages between the calculator and the other devices on the loop. The calculator is slow in itself because it is not dedicated to the task in hand. The method used by the
/\ ,\
program in getting the SCm value is slow (i.e. finding the two minimums and two maximums, then the diffeOice between them) and
the frequency used by the oscillator is low, hence the time constants used in the filters was long (these were also conservatively designed). This led to a time taken between readings of around 90 seconds. This was considered to be too long.
Another problem with ARR-1 was that the direction of principal stress was given relative to the probe starting
position, and the sign of SCm was changed to say whether or not it was tensile or compressive. This method was very confusing to use. Also the assumption that a correct stress measurement should have two maximum and two minimum SCm values was not found to hold for all stress measurements. Thus a different approach to getting SCm was needed.
Other minor problems encountered were; the probe design did not allow for easy manufacture, the equipment was bulky and expensive (due to the use of commercial equipment in the design) and the excitation oscillator did not have a very stable
CHAPTER 3
AUTOMATIC ROTATION RIG 2
3.1 Introduction to ARR-2.
ARR-2 (Automatic Rotation Rig number 2) was designed to solve some of the problems with ARR-1 (as described previously) and make it more suitable for field operation. The electronics design was changed (see Figure 3.1) by using a JED STD 800 CMOS computer board as the controller. This allowed the slow HP-IL loop to be removed, along with the digital multimeter (this being replaced by amplifiers for SCm and SCp and the A to D convertor on the JED STD 800). The results from each stress reading are displayed to the user of ARR-2 by a LCD display (JED STD 860) and information from the user is fed to the JED STD 800 via a keypad mounted on the front panel (see Figure 5.1).
The stepper motor is driven in a similar manner to that used on ARR-1, using a SAA 1027 stepper motor driver. The probe layout is similar to that used in ARR-1, but it is more refined (this is described in more detail in Chapter 5). The electronic circuits were redesigned to complement the JED STD 800. One of the major changes from ARR-1 is the excitation oscillator circuit.
The main problem with the excitation oscillator used in ARR-1 was that it did not produce a very stable in amplitude
4X#
MUMAL
101WIlD
I
JED LTD ISO 2 LAT X 40 CAPIALIVA LeD DartAv• Sc.," MPRCfl AND farseats MIAs osracarat
PFL-
1-
I
IT5E65=564
•
-750 STO sea Some 120A520 embs
P45 ma eaultn515
CP& 11A1 Rah-U:4 PEofIC AMMON Anunceissai
SAA ,o27 4M555
OSCAR 7.6
Moro& &WAIL MYER. Atnve
MO
Alafa Aiwa*
designed to be stable in frequency but not in amplitude. The oscillator for this device does not need to be particularily stable in frequency because this only effects the depth of
penetration of the excitation flux into the steel. This will not affect the SCm readings to any great extent.
In ordr to have an oscillator that was stable in
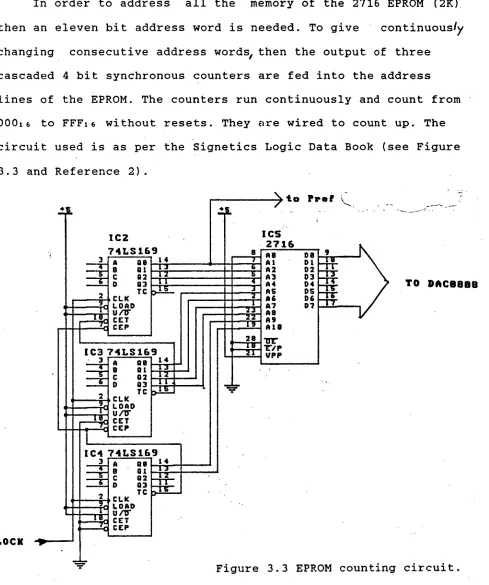
amplitude, the following circuit was developed. A sinewave was converted into 8 bit binary, words with each word representing the value of the sine function at a particular angle. These words were stored in a 2K EPROM (a 2716). Thus each value represents
the sine value at 360/2048 degree increments. Each of these
values is fed in turn to a D to A convertor. The whole 360 0 being stepped through continuously by a 12 bit counter. The counter is
. t
clocked by a "3 CMOS inveer" clock circuit.
The frequency of oscillation of the excitation oscillator was increased to 144 Hz. This frequency is not critical as long as it is not a harmonic'of 50 HZ (this would be 60 Hz in the case where this is the mains supply frequency) as this may make the signal processing of ARR-2 susceptable to noise from the mains.
NOTE — BATTERY CitAl2CER AN') POWER. suPPL/65 Nor
sHowN •
The reason for the frequency increase was to allow for
shorter time constant low pass filters in the signal processing.
This allows ARR-2 to measure the stress in the steel faster.
3.2 Electronics Design.
The complete circuit diagrams for ARR-2 are shown in
Appendix E (b). In order to simplify the description of the
circuit used for ARR-2, it has been seperated into sections.
These are described following:
3.2 (a) Oscillator Circuit.
The complete circuit for the oscillator is shown on drawing
1 sheet 3 (Appendix E (b)). To aid the description of this
circuit it has been seperated into further "building blocks".
Each of these will be described along with a corresponding circuit.
The circuit used for the clock to derive the counting signal
for the EPROM is a simple "three CMOS inverter" clock circuit as
shown in Figure 3.2. The capacitor and 180Aresistor values were
obtained by experiment to give the correct output frequency of
144 Hz from the sinewave oscillator. The 82 kxLresistor is a
standard design value for this circuit. In order to aid the
frequency stabillity of the circuit, although this is not that
critical in this application, metal oxide resistors and a
polyester capacitor were selected. The output of the clock is
buffered by three CMOS inverter gates in parallel to give the
required fan-out conditions for driving the following TTL gates.
ICI:D Id: R IC1:F 74HC84 74HC84 74HC84
c 19
0 11 I< 13
114' RS
Ne.^
821I
las
ICI:C 74HC84