INTRODUCTION
Investigations of foraging strategies of top preda-tors within ecosystems are an important step towards understanding ecological structure and function for fisheries management. Hagfish (Myxinidae) are an important group of demersal fishes because they are often found in high abundance, and have a growing commercial interest for fisheries and pharmaceutical resources (Downing et al. 1984, Powell et al. 2005, Knapp et al. 2011). Knowledge of their feeding and population ecology will be critical to regulation and sustainable fisheries management.
Hagfish have elongated eel-like bodies with a leathery skin and secrete significant amounts of slime that they use as a defence mechanism against predation (Zintzen et al. 2011). They are commonly considered to be scavengers, but acquisition of food by predation has been suspected (Shelton 1978, Mar-tini 1998) and recently observed (Zintzen et al. 2011). Hagfish often burrow in sediments and create biotur-bation searching for invertebrate prey (Martini 1998). Stomach content analysis of several species of hagfish has revealed the presence of a large variety of prey, including polychaetes, shrimps, hermit crabs, cephalopods, brittlestars, bony fishes, sharks,
© Museum of New Zealand Te Papa Tongarewa and Massey University and GNS Science 2013. Open Access under Creative Commons by Attribution Licence. Use, distribution and repro-duction are un restricted. Author(s) and original publication must be credited. Publisher: Inter-Research · www.int-res.com *Email: vincentz@tepapa.govt.nz
Hagfish feeding habits along a depth gradient
inferred from stable isotopes
Vincent Zintzen
1,*, Karyne M. Rogers
2, Clive D. Roberts
1, Andrew L. Stewart
1,
Marti J. Anderson
31Museum of New Zealand Te Papa Tongarewa, 169 Tory Street, Wellington, New Zealand 2National Isotope Centre, GNS Science, 30 Gracefield Rd, Gracefield 5010, Lower Hutt 5040, New Zealand 3New Zealand Institute for Advanced Study (NZIAS), Massey University, Albany Campus, Auckland, New Zealand
ABSTRACT: Feeding habits of 3 hagfish species were investigated along a depth gradient (~50 to 900 m) in New Zealand using nitrogen (δ15N) and carbon (δ13C) stable isotopes. Neomyxine bini-plicatahad the lowest mean δ15N value (14.2 ‰), followed by Eptatretus cirrhatus(14.9 ‰) and Eptatretussp. 1 (15.8 ‰). Neomyxine biniplicata(~50 m depth) was characterized by (1) relative low lipid content in muscles and (2) consistent body condition index which together with its trophic position indicated that this species probably acquires its food by active predation, supple-mented by opportunistic scavenging. Eptatretus cirrhatus(48 to 912 m) and Eptatretussp. 1 (290 to 922 m) had similar morphology, but their δ15N signature indicated that they were feeding on slightly different trophic levels. For Eptatretussp. 1, the combination of (1) variable lipid content, indicating phases of feeding and fasting, (2) decreasing body condition index with depth, indica-ting less regular feeding at depth, (3) increasing δ15N with depth and (4) decreasing δ13C signature with depth, pointed towards a feeding behaviour specialized in scavenging on large but rare falls of high-level predators such as whales, sharks or bony fishes. On the other hand, E. cirrhatuswas characterized by (1) less variable lipid content, (2) a body condition index not influenced by depth, (3) δ15N values decreasing with depth and δ13C values constant across its depth range, which is likely to indicate a more opportunistic and mobile feeding behaviour on a range of prey.
KEY WORDS: Fish · Ecology · Nitrogen · Carbon · Body condition index · Lipid content · Eptatretus· Neomyxine
O
PEN
PEN
birds and whale flesh (Strahan 1963, Shelton 1978, Johnson 1994, Martini 1998). It is assumed from stomach contents that hagfish food resources are of mesopelagic origin in deeper-living species, but con-sist primarily of benthic invertebrates for living species (Martini 1998). This suggests that hag-fish from deep waters could preferentially feed on carrion falls, such as carcasses of marine mammals. For example, at 1310 m depth, Eptatretus deaniwas ob served feeding to satiation on bait fall (Smith 1985). Fishes with scavenging behaviour in the deep-sea are often considered to be opportunistic feeders because of the presumed rarity of potential feeding events. However, it is unclear to what extent hagfish are truly non-discriminatory in their food selection. For any given species, the potential degree of prey specificity has not been explored. Variation in prey or feeding strategies within a species and along impor-tant environmental gradients, such as depth, has not previously been explored.
Fasting is an important aspect of hagfish feeding strategy. It has been suggested that hagfishes often stay immobile between feeding events, which may be separated by long periods of time, as the probabil-ity of nekton fall can be low at depth (Smith & Baco 2003). A ‘sit and wait’ behaviour coupled with a low basal energy requirement make them good candi-dates for prolonged periods of fasting (Martini 1998, Cox et al. 2011, Drazen et al. 2011). One species, Eptatretus stoutii, has reportedly been kept in an aquarium for 9 to 11 mo without food (Tamburri & Barry 1999). Fasting would be a particularly useful adaptive strategy for species specializing in nekton falls, but would be less important for more oppor-tunistic species, which could also feed on benthic fauna. Fasting fishes tend to use their stored lipids first and to conserve proteins (Weatherley & Gill 1981, Rueda et al. 1998). As hagfishes stock lipids in their muscles (Flood 1998), it is likely that the lipids are used as a source of energy during fasting periods. Muscle of E. deani, a deep-living species, comprised an average of 34% lipids (dry weight) but demon-strated quite variable values in percent lipids be -tween individuals (Drazen et al. 2011), indicating that some individuals were fasting while others had recently eaten. The shallower species E. stoutii had much lower and less variable lipid content in their muscle (8%, Drazen et al. 2011), probably as a result of food being more frequently available at shallower depths.
Carbon and nitrogen stable isotopes are commonly used to study marine trophic relationships and, more recently, feeding patterns and habitats of mobile
marine species (Logan & Lutcavage 2008, Hückstädt et al. 2012). By measuring carbon and nitrogen iso-topes, one can gain insights into dietary variation and feeding strategies among species, and among popu-lations from different locations.
Carbon isotopes (13C/12C or δ13C) integrate infor-mation on the origin of resources, from primary pro-duction (pelagic vs. benthic) to higher trophic levels (Pinnegar & Polunin 2000). Heavier isotopes (13C) increase as trophic level increases, with tissues tend-ing to be weakly enriched in the heavier (13C) carbon isotope at a rate of approximately δ13C < 1 ‰ per trophic level (DeNiro & Epstein 1981).
Nitrogen isotopes (15N/14N or δ15N) increase with trophic transfer at a rate of 2 to 4 ‰ per trophic level (DeNiro & Epstein 1981, Peterson & Fry 1987), gener-ally allowing a clearer assessment of trophic position and feeding niche width than carbon isotopes. In addition, when long periods of fasting occur, individ-uals will catabolise endogenous amino acids to meet the demands of protein synthesis (Deschner et al. 2012), and consume their own body tissue. The result is 15N enrichment in the remaining muscle tissue (Hatch et al. 2006).
This study used stable isotopes to investigate the feeding habits of 3 species of Myxinidae found in New Zealand waters (one species of the genus Neo -myxine and 2 species of Eptatretus) along a depth gradient of 50 to ~900 m. The 2 Eptatretusspecies are morphologically very similar, E. cirrhatusbeing only differentiated from Eptatretussp. 1 (a recognized but still undescribed species) by having 1 or 2 extra pre-branchial slime pores and a white rim around some of its slime pores. We tested the following hypotheses: (1) different but morphologically similar species of hagfish occupy different niches by feeding at differ-ent trophic levels, (2) hagfishes at differdiffer-ent depths feed on different types of food resources, and (3) hag-fishes will show signs of food deprivation in some specimens, as measured by lipid contents and body condition, indicating that they can fast, waiting for the next feeding opportunity
METHODS
Hagfish collection
(37.5211° S, 177.1821° E) was sampled in March 2009 and Kaikoura (42.4315° S, 173.7087° E) was sampled in November 2010. The fish traps were deployed along 5 (White Island) and 3 (Kaikoura) transects running from 50 to 900 m. The fish trap design was circular (diameter: 1.6 m, height: 0.8 m, mesh size: 2 cm) and fitted with 3 funnelling entrances tapering from 0.4 to 0.2 m (square entrance). The bait con-sisted of 4 kg of Sardinops sagaxthat were thawed and chopped prior to being placed into 2 bait bags installed inside the fish traps. Each fish trap was equipped with a sensor (Star Oddi DST centi TD) that measured depth to a precision of 0.4 to 0.6% of the depth range (e.g. ±1 m at 50 m depth and ± 9 m at 1200 m depth). The fish traps were retrieved after 2 to 4 h, and the specimens of hagfish were immedi-ately bagged and frozen at –20°C.
Hagfish measurements
Hagfishes were identified after thawing and clean-ing of excess slime. Their length was measured to the nearest mm as total length (TL, excluding barbels). Specimens were then weighed to the nearest gram. Dorsal muscle thickness was measured using cal-lipers at mid-body length.
Stable isotope sample preparation
Muscle tissue samples were taken from under the skin at the mid-body dorsal region of each hagfish, freeze dried and ground finely. Due to variable inter-and intra-species lipid contents in hagfish muscle, chemical lipid extraction of samples is done prior to analysis or values must be corrected using normali-sation factors which deduct the lipid contribution from the base tissue value (Logan et al. 2008). Trophic changes in carbon isotopes can be altered or masked by lipids stored in tissues because they incor-porate less 13C than the protein fraction of the tissue,
due to a kinetic isotope effect (DeNiro & Epstein 1977). Chemical lipid extraction methods are found
to affect the δ15N values of fish tissue (Sweeting et al.
2006, Kolasinski et al. 2009), so samples should be analysed twice to determine accurate δ13C (lipid free
tissue) and δ15N (non delipidized tissue) values.
Chemical lipid extraction of ground muscle samples was done prior to analysis, following the method of Bligh & Dyer (1959), modified by Hobson et al. (2000), Kolasinski et al. (2009) and Rogers (2009). A portion (~1 g) of ground muscle was agitated for 1 h with 30 ml of a 2:1 solution of chloroform:methanol. The delipidized hagfish tissue was separated from the lipids by centrifuging at 3500 rpm for 5 min. The extracted lipids were decanted and the solids resus-pended with another 30 ml of a 2:1 mixture of chloro-form:methanol, agitated briefly and the centrifuge procedure repeated. This rinsing step was performed another 3 times until the solvent ran clear. The deli-pidized muscle was oven-dried overnight at 30°C to remove any residual solvent. Untreated samples con-taining lipids are referred to as ‘untreated’ samples (noted δ13C and δ15N) and delipidized samples as
‘extracted’ (noted δ13C’ and δ15N’).
Stable isotope analysis
Carbon and nitrogen content and isotopic composi-tion of the untreated and extracted hagfish were ana-lyzed according to methods described in Kolasinski et al. (2009) and Rogers (2009) at the Stable Isotope Laboratory, GNS Science, New Zealand. Analytical precision of the measurements is ± 0.2 ‰, and repro-ducibility of the results is within ± 0.2 ‰ for carbon and ± 0.3 ‰ for nitrogen (1 SD).
Lipid content and body condition of hagfishes
The atomic C:N ratio (%C×14/%N×12) or Δδ13C
values (with Δδ13C = δ13C’–δ13C) can serve as proxies
for lipid content in animal tissues because muscle tis-sues with higher lipid content will have greater neg-ative δ13C values (DeNiro & Epstein 1977). They can
also be used to indicate nutritional stress and loss of lipids from tissues due to fasting (Graves et al. 2012). Several equations are available in the literature to evaluate the percentage of lipid in different tissues from Δδ13C values or bulk C:N ratios (McConnaug
-hey & McRoy 1979, Kiljunen et al. 2006, Sweeting et al. 2006, Post et al. 2007, Logan et al. 2008). The results we obtained using those equations can
be found in Supplement 1 available at
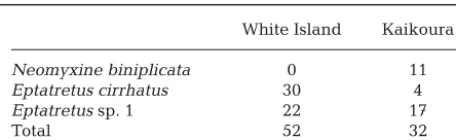
www.int-White Island Kaikoura
Neomyxine biniplicata 0 11
Eptatretus cirrhatus 30 4
Eptatretussp. 1 22 17
[image:3.612.61.289.102.172.2]Total 52 32
res.com/articles/suppl/m485p223_supp.pdf. Due to the inconsistency of those results, it was decided to use Δδ13C values as a proxy for the lipid content of
hagfish muscles in this study.
Lipids in muscles are used as energy storage and their state can give an indication of whether speci-mens have been feeding recently, or have been in a period of food deprivation. Within any species, spec-imens with high lipid levels have fed recently (within the last month), whereas specimens with low lipid levels have been using their lipid as an energy source (Tocher 2003).
A body condition index (Bc) was calculated for each
specimen after fixation in formalin and preservation in 70% isopropanol using:
where Wis the width (in mm) of the dorsal muscle
taken at mid-body length and Lis the length of the specimen (in mm). This index was chosen rather than a mass body index, based on length and weight, due to potential bias introduced when recording weight of specimens with food in their stomach and intes-tine. The dorsal muscle is the most important one in hagfishes and is responsible for most of their move-ments and swimming activity. We anticipate that well-fed specimens over an extended period of time (at the scale of a year) will have greater muscle mass which will be mostly accumulated in the dorsal muscle. For each species, Bcwas scaled from 0
(spec-imen with the lowest Bcvalue) to 100 (specimen with
the highest Bc value) to allow meaningful
compar-isons of values between species.
Data analysis
The extracted (lipid free) samples for stable carbon (δ13C’) isotopes and untreated samples for stable
nitrogen (δ15N) isotopes were used for the analysis.
An initial permutational multivariate analysis of vari-ance (PERMANOVA) (Anderson 2001) was fitted on the 2 isotopic variables to test for the effect of location (Lo, a fixed factor with 2 levels), species (Sp, a fixed factor with 3 levels) and depth (De, a continuous vari-able) as a covariate. The PERMANOVA was done using a Type I (sequential) sum of squares which meant that each term was fitted taking into account all previous terms in the model. Normalised Euclid-ean distances between hagfish individuals, based on their δ13C’ and δ15N signature, was used as a
dissimi-larity measure.
Hagfish specimens from the 2 locations (White Island and Kaikoura) were pooled together for the analysis (see Supplement 2). To further investigate the a priori grouping by species based on δ15N and
δ13C’ values, a canonical analysis of principle
coordi-nates (CAP) was performed on the data using
nor-malised Euclidean distances between specimens
(Anderson & Willis 2003). In this form, CAP is equiv-alent to a classical discriminant analysis. Leave-one-out mis-classification error (Lachenbruch & Mickey 1968) was used to obtain a direct measure of the abil-ity of the CAP discriminant model to identify species on the basis of these 2 stable isotope measures alone. This cross-validation approach provided a rigorous assessment of the distinctiveness of the isotopic signatures for the 3 species.
The effects of species, depth of capture and speci-men lengths (a continuous variable) were investi-gated separately on both δ13C’ and δ15N values using
ANCOVA. For each species, the effect of depth on
δ15N, δ13C’, lipid content (Δδ13C) and body condition
(Bc) was then evaluated using linear regression.
Mul-tiple comparisons between species were done using Tukey’s honestly significant differences (HSD). The effect of δ15N values on lipid content and body
condi-tion were also inspected for each species using linear regressions. The distributions of the residuals were inspected to assess the adequacy of linear regression models and did not show any violation of assump-tions. Prior to ANCOVA and regressions, data were checked for homogeneity of variances using the Fligner test and approximate normality using Q-Q plots. Finally, correlation between the 3 variables of δ15N, lipid content and body condition were in -vestigated to identify any potential signs of food deprivation.
CAP and PERMANOVA analyses were done using PERMANOVA+ (Anderson et al. 2008), the add-on for PRIMER v6 (Clarke & Gorley 2006) and all other statistical analyses were done using R (R Develop-ment Core Team 2012).
RESULTS
The 3 hagfish species were identifiable as 3 sepa-rate groups on the basis of stable carbon and nitro-gen values (Fig. 1, Table 2). The PERMANOVA par-titioning showed a significant effect of species on
δ13C’ and δ15N, even after taking into account the
effect of location (Table 3). However, a significant interaction between depth and species was still detected, even after fitting the depth by location
B W
L
interaction. This means that, even though the depth effects on isotopic signatures depended on the factor location, the depth by species interaction was still significant over and above any variation in the effects of depth from one location to the next. The diagnos-tics of the CAP analysis showed that, overall, 77% of the specimens were correctly classified into their respective species using δ13C’ and δ15N information. By species, the percentage of ‘left-out’ specimens correctly classified by the CAP discriminant model was 73% for Neomyxine biniplicata, 87% for Epta-tretussp. 1 and 68% for E. cirrhatus. Mean δ13C’ val-ues (± SD) were broadly similar but N. biniplicata dif-fered significantly from Eptatretus sp. 1 (Tukey’s HSD test, p < 0.01). N. biniplicata had the lowest mean δ13C’ value (–16.0 ± 0.2 ‰), followed by E.
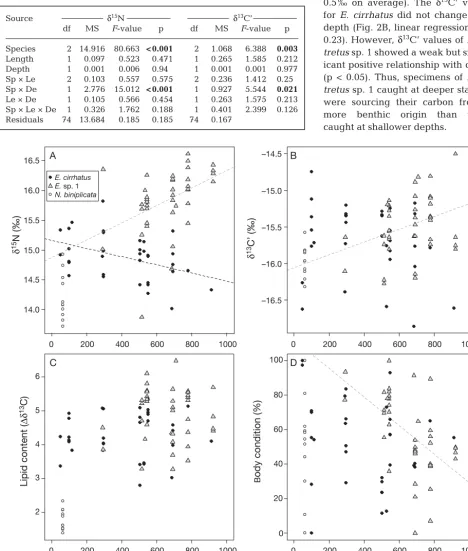
cir-rhatus(–15.7 ± 0.5 ‰ ) and Eptatretussp. 1 (–15.5 ± 0.4 ‰). N. biniplicataalso had the lowest mean δ15N value (14.2 ± 0.4 ‰), followed by E. cirrhatus(14.9 ± 0.4 ‰) and Eptatretus sp. 1 (15.8 ± 0.5 ‰). Stable nitrogen values also differed significantly between every pair of species (Tukey’s HSD tests, p < 0.001). Although hagfish length did not explain significant variation in either of the stable isotopes, a significant interaction between depth and species was detected for δ15N and also for δ13C’ values (Table 4). Neomy -xine biniplicata was restricted to 50 m depth, while Eptatretus cirrhatus was sampled along the entire depth range (48 to 912 m) and Eptatretus sp. 1 occurred from 290 to 922 m. δ15N values significantly decreased with depth for E. cirrhatus (linear regres-sion, p < 0.05) and significantly increased with depth for Eptatretussp. 1 (p < 0.01, Fig. 2A). This suggested that captured specimens of E. cirrhatuswere feeding on lower trophic levels at deeper depths, while spec-imens of Eptatretus sp. 1 were either feeding on higher trophic levels or fasting at deeper depths. The variation around the mean δ15N value was slightly higher for Eptatretussp. 1 than for E. cirrhatus, indi-cating that Eptatretussp. 1 was feeding on a wider range of prey than E. cirrhatus.
Carbon isotopes indicated that Neomy xine binipli -catawas feeding on prey whose carbon was of a less E. cir
E. sp.
N. bin
–16.5 –16.0 –15.5 –15.0 –14.5 δ13C’ (‰)
14.0 14.5 15.0 15.5 16.0 16.5
δ
15
N (‰)
E. cirrhatus
E. sp. 1
N. biniplicata
Fig. 1. Eptatretus cirrhatus, Eptatretussp. 1 and Neomyxine biniplicata. Stable carbon (δ13C’) and nitrogen (δ15N) isotope
values for 3 species of hagfish. δ15N values are for untreated
muscle samples and δ13C’ values are for extracted
(lipid-free) samples. Also given are the mean (±1 SE) values for each species
Species n Depth Length Untreated Lipid-extracted Δδ13C
(m) (mm) δ13C (‰) δ15N (‰) C:N δ13C’ (‰) δ15N’ (‰) C:N (‰)
[image:5.612.53.290.82.311.2]N. biniplicata 11 63 278−410 –17.7 ± 0.3 14.2 ± 0.4 5.6 ± 0.4 –16.0 ± 0.2 15.1 ± 0.4 3.7 ± 0.1 1.8 ± 0.3 E. cirrhatus 34 48−912 538−788 –20.0 ± 0.7 14.9 ± 0.4 11.1 ± 0.7 –15.7 ± 0.5 16.0 ± 0.4 3.8 ± 0.1 4.3 ± 0.7 Eptatretussp. 1 39 290−922 379−716 –20.4 ± 0.7 15.8 ± 0.5 13.0 ± 0.7 –15.5 ± 0.4 16.9 ± 0.5 3.8 ± 0.1 4.9 ± 0.8 Table 2. Eptatretus cirrhatus, Eptatretussp. 1 and Neomyxine biniplicata. Mean (± SD) stable carbon and nitrogen isotope values from muscles of each of 3 species of hagfish, either before (untreated) or after chemical lipid extraction. C:N indicates the atomic C:N ratio
(%C×14/%N×12). Δδ13C is the difference between δ13C’ and δ13C values
Source df MS Pseudo-F p
Location 1 88.067 87.905 0.0008
Species 2 30.252 30.196 0.0001
Depth 1 29.772 29.717 0.0652
Depth × Location 1 10.458 10.438 0.0005 Depth × Species 1 61.125 61.013 0.0062
Residual 77 10.018
[image:5.612.46.558.649.720.2]Total 83
Table 3. PERMANOVA results for the effect of location (fixed, 2 levels), species (fixed, 3 levels) and depth as a co -variate on isotope signature (δ13C’ and δ15N) of hagfishes.
Euclidean distances were used on normalised variables, par -titioning was done using Type I (sequential) sum of squares
benthic (or more pelagic) origin (lower mean δ13C’ values), although the differences between the 2 Epta-tretus spe cies were small (less than 0.5 ‰ on average). The δ13C’ values for E. cirrhatus did not change with depth (Fig. 2B, linear regression, p = 0.23). However, δ13C’ values of Epta-tretussp. 1 showed a weak but signif-icant positive relationship with depth (p < 0.05). Thus, specimens of Epta-tretus sp. 1 caught at deeper stations were sourcing their carbon from a more benthic origin than those caught at shallower depths.
Source δ15N δ13C’
df MS F-value p df MS F-value p
Species 2 14.916 80.663 < 0.001 2 1.068 6.388 0.003 Length 1 0.097 0.523 0.471 1 0.265 1.585 0.212
Depth 1 0.001 0.006 0.94 1 0.001 0.001 0.977
[image:6.612.61.529.138.689.2]Sp × Le 2 0.103 0.557 0.575 2 0.236 1.412 0.25 Sp × De 1 2.776 15.012 < 0.001 1 0.927 5.544 0.021 Le × De 1 0.105 0.566 0.454 1 0.263 1.575 0.213 Sp × Le × De 1 0.326 1.762 0.188 1 0.401 2.399 0.126 Residuals 74 13.684 0.185 0.185 74 0.167
Table 4. Eptatretus cirrhatus, Eptatretus sp. 1 and Neomyxine biniplicata. Analysis of covariance showing the effect of hagfish species (Sp; categorical with 3 levels), depth (De; as a continuous variable) and length (Le; also as a continuous variable) of specimens on each of δ15N and δ13C’, as indicated.
p-values < 0.05 are shown in bold
δ
15
N (‰)
14.0 14.5 15.0 15.5 16.0 16.5 A
E. cirrhatus
E. sp. 1
N. biniplicata
δ
13
C’ (‰)
–16.5 –16.0 –15.5 –15.0 –14.5 B
Depth (m)
Lipid content (
∆δ
13
C)
0 200 400 600 800 1000
2 3 4 5 6
C
B
ody condition (%)
0 200 400 600 800 1000
0 200 400 600 800 1000 0 200 400 600 800 1000
0 20 40 60 80 100 D
Fig. 2. Eptatretus cirrhatus, Eptatretussp. 1 and Neomyxine biniplicata. Effect of depth on (A) stable nitrogen isotope values (δ15N), (B) stable carbon isotope values (δ13C’), (C) lipid content in muscles (Δδ13C) and (D) body condition index in 3 hagfish
The mean estimate for lipid content (Δδ13C) of Eptatretus cirrhatus and Eptatretus sp. 1 did not change overall with depth (linear regression, p = 0.48 and p = 0.91, respectively, Fig. 2C). However, the variation in lipid content around the mean was lower at shallow depths (50 to 300 m), indicating that those specimens were feeding regularly (i.e. no part of this population was either overfed or starving). At greater depth, the variation in lipid content of E. cirrhatus increased, indicating that some specimens had recently fed while others were consuming their stored lipids. Variation in the mean lipid content of muscles for Eptatretus sp. 1 was larger than for E. cirrhatus.
There was no effect of depth on the body condition index for Eptatretus cirrhatus, but variation around the mean was higher at shallow than at deeper depths (Fig. 2D). The body condition index signifi-cantly decreased with depth for Eptatretussp. 1 (lin-ear regression, p < 0.001). Eptatretussp. 1 had less muscle tissue at depth than in shallow water. How-ever, there was large variation in body condition values at all depths except for 300 and 900 m.
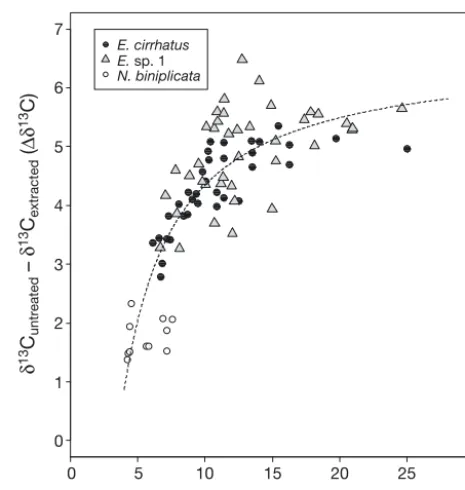
The range in the untreated C:N ratio varied consi -derably between individuals: 4.2 to 7.6 (mean = 5.6) for Neomyxine biniplicata, 6.1 to 24.9 (mean = 11.1) for Eptatretus cirrhatusand 6.7 to 24.6 (mean = 13.0) for Eptatretus sp. 1 (Table 2). After lipid extrac -tion, C:N ratios of the 3 studied species were all comparable to each other with mean (± SD) values of 3.7 ± 0.1 for N. biniplicata, 3.8 ± 0.1 for E. cirrhatus and 3.8 ± 0.1 for Eptatretussp. 1 (Table 2). There was a strong relationship be tween bulk C:N ratios and Δδ13C (Fig. 3). Estimates for the lipid content of hag-fish muscle (Δδ13C) ranged from 1.38 to 6.48. N. bini-plicata had significantly lower muscle lipid content (mean ± SD Δδ13C = 1.76 ± 0.09 ‰, t-test p < 0.001) than the 2 Eptatretusspecies (E. cirrhatus: Δδ13C = 4.31 ± 0.12 ‰; Eptatretussp. 1: Δδ13C = 4.89 ± 0.13 ‰), which were also significantly different from each other for that parameter (Fig. 2C, 2-sample t-test, p < 0.001).
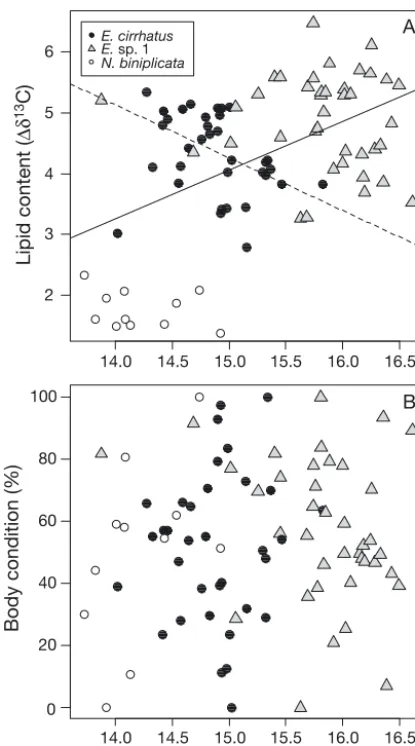
There was a clear and positive relationship be -tween lipid content in hagfish muscles and δ15N values (Fig. 4A, linear regression, p = 0.001). Species feeding at higher trophic levels accumulated more lipids in their muscle than did those feeding at lower trophic levels. Although this pattern held when com-bining all species of hagfish together, it was not observed when looking at species individually and there was even an opposite trend for Eptatretus cirrhatus, which had increasing δ15N values with de -creasing lipid content (linear regression, p < 0.001 —
omitting one outlier which was the only individual having both a relatively low lipid content and a low δ15N value).
The body condition index had no clear relationship with either δ15N values (Fig. 4B) or the lipid content (Fig. 5). For Neomyxine biniplicata, there was a trend for spe cimens with high body condition index to feed at a higher trophic level (Fig. 5A). There was no sig-nificant relationship detected between lipid content and either body condition or trophic level, although this could be due to the low number of N. biniplicata specimens available. For Eptatretus cirrhatus, 26, 50 and 24% of the specimens had a body condition index ranging from 0–33, 34–66 and 67–100%, respectively (Fig. 5B, as indicated by the proportion of specimens between the different dotted lines). The specimens with low lipid content and a low body con-dition index (‘skinny’) had intermediate values for δ15N, as did the lipid-rich specimens with a high body condition index (‘fat’). Specimens with intermediate lipid content generally fed on organisms from a higher trophic level, and this was particularly visible for specimens having also an intermediate body
con-0 5 10 15 20 25 30
C:Nuntreated
0 1 2 3 4 5 6 7
δ
13
Cuntreated
–
δ
13
Cextracted
(
∆δ
13
C)
E. cirrhatus
E. sp. 1
[image:7.612.308.541.82.327.2]N. biniplicata
Fig. 3. Eptatretus cirrhatus, Eptatretussp. 1 and Neomyxine biniplicata. Relationship between C:N ratios of untreated samples and stable carbon isotopic values of the lipid frac-tion from hagfish muscles. δ13C and δ13C’ values are for the
untreated and extracted (lipid-free) samples, respectively. C:N ratios are from untreated samples. The regression line is from the lipid-normalization model of McConnaughey & McRoy (1979), where the constants have been estimated by iterative non-linear least square regression to be D = 7.692
Lipid content (
∆δ
13
C)
14.0 14.5 15.0 15.5 16.0 16.5 2
3 4 5 6
E. cirrhatus
E. sp. 1
N. biniplicata
A
δ15N (‰)
Body condition (%)
14.0 14.5 15.0 15.5 16.0 16.5 0
20 40 60 80
[image:8.612.70.278.83.456.2]100 B
Fig. 4. Eptatretus cirrhatus, Eptatretussp. 1 and Neomyxine biniplicata. Effect of stable nitrogen isotope values (δ15N)
on (A) lipid content in muscles (Δδ13C) and (B) body
condi-tion index in 3 hagfish species. Only significant regression lines (p < 0.05) are shown. The dotted regression line is for
E. cirrhatusand the plain line is for all species combined
B A
C
0 20 40 60 80 100
1.0 1.5 2.0 2.5
Skinny-lipid rich
Skinny-lipid poor Fat-lipid poor Fat-lipid rich Neomyxine biniplicata
0 20 40 60 80 100
1 2 3 4 5 6 7
Lipid content (
∆δ
13
C)
Skinny-lipid rich
Skinny-lipid poor Fat-lipid poor Fat-lipid rich Eptatretus cirrhatus
0 20 40 60 80 100
1 2 3 4 5 6 7
Body condition (%) Skinny-lipid rich
[image:8.612.315.527.84.712.2]Skinny-lipid poor Fat-lipid poor Fat-lipid rich Eptatretus sp. 1
Fig. 5. Eptatretus cirrhatus, Eptatretussp. 1 and Neomyxine biniplicata. Relationship between lipid content in muscles and body condition index for each of 3 species of hagfishes. Superimposed as bubbles on the plot is the trophic level for each individual (as indicated by their δ15N values); bubbles
are scaled for each species from 0 (specimen feeding on the lowest trophic level, low δ15N values; no bubble) to 100
(specimen feeding on the highest trophic level, high δ15N
values; largest bubbles). The dotted lines arbitrarily divide the ordered data in each scatter-plot into 9 equal-area zones based on the level of lipid content and body condition values (low, medium and high, respectively). Certain zones are qualified as comprising ‘skinny’ or ‘fat’ individuals (by refer-ence to their relative body condition index), and comprising ‘lipid rich’ or ‘lipid poor’ individuals (by reference to their relative lipid content). (A) N. biniplicata, (B) E. cirrhatus, (C)
dition index. In general, specimens which had a higher lipid content fed at a relatively low trophic level but this had no apparent impact on the body condition index. For Eptatretussp. 1, 13, 49 and 38% of the specimens had a body condition index ranging from 0–33, 34–66 and 67–100%, respectively (Fig. 5C). The largest fraction of the specimens had an intermediate lipid content and body condition index. There were a few specimens that were both lipid-rich and had a low body condition index. For this species, there were no clear patterns in the distribution of δ15N values in relation to the body con-dition index or lipid content.
DISCUSSION
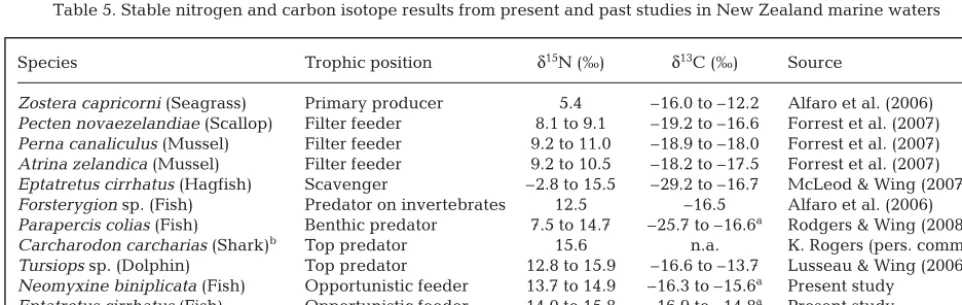
Assessment of the stable isotopes, body condition and lipid content of tissues of New Zealand hagfishes Neomyxine biniplicata, Eptatretus cirrhatusand Ep-tatretus sp. 1 indicate that they feed consistently on higher trophic levels (δ15N values: 13.7 to 16.6 ‰) when compared to other marine species found in New Zealand (Table 5); it is likely that the 3 hagfish species from this study generally feed 1 to 3 trophic levels above primary consumers (i.e. TL3 to TL5). N. binipli-catahad the lowest δ15N values. This species is rela-tively small with a slender body (Richardson & Jowett 1951) and is very active when observed using baited underwater video (Zintzen et al. 2012). Stable isotopes suggest that this species employs an active feeding strategy, consuming small carrion and also actively preying on inver tebrates from soft sediments. A closely associated species,Neo myxinesp. 1, was also observed actively hunting live Cepola haastii, a ben-thic fish species (Zintzen et al. 2011).
The stable nitrogen isotope values confirm that Neomyxine biniplicata feeds relatively high up the trophic chain, although maybe not so high as to scavenge preferentially on carrion from apex pre -dators. The lipid fraction in its muscle was low com-pared to the other 2 species which could indicate that this species has low nutritional stress and regu-larly feeds, actively preying on lipid-poor benthic prey such as invertebrates. Eptatretus cirrhatuswas feeding at a slightly higher trophic level than N. biniplicata, but at a lower level than Eptatretus sp. 1. The 2 Eptatretusspecies are morphologically very similar and sympatric, having been recognized as separate species only recently (V. Zintzen pers. obs.). Nonetheless, evidence here suggests that they may occupy a slightly different niche by specializing on different types of prey. The known depth range for E. cirrhatusin New Zealand waters is 1 to 922 m although it is more common at 90 to 700 m. Eptatre-tussp. 1 is found from 290 to 922 m, but is more reg-ularly caught deeper than 500 m (Te Papa Museum database). δ15N values decrease with depth for E. cirrhatus; perhaps Eptatretus sp. 1 has a competitive advantage over E. cirrhatuswhen feeding at deeper sites, where a larger fraction of the food resource is likely to come from carrion falls. It is also possible that E. cirrhatus tends to consume a greater pro -portion of benthic prey from lower trophic levels, leading to lower δ15N values for this species. This hypothesis is supported by the values of δ13C’ re -maining fairly constant with depth for E. cirrhatus, indicating similarity of carbon sources for its prey across this depth range. If E. cirrhatusmostly feeds on carrion from large megafauna at deeper depths, this would be reflected in its δ13C’ values because these animals would presumably have a range of
Species Trophic position δ15N (‰) δ13C (‰) Source
Zostera capricorni(Seagrass) Primary producer 5.4 –16.0 to –12.2 Alfaro et al. (2006) Pecten novaezelandiae(Scallop) Filter feeder 8.1 to 9.1 –19.2 to –16.6 Forrest et al. (2007) Perna canaliculus(Mussel) Filter feeder 9.2 to 11.0 –18.9 to –18.0 Forrest et al. (2007) Atrina zelandica(Mussel) Filter feeder 9.2 to 10.5 –18.2 to –17.5 Forrest et al. (2007) Eptatretus cirrhatus(Hagfish) Scavenger –2.8 to 15.5 –29.2 to –16.7 McLeod & Wing (2007)
Forsterygionsp. (Fish) Predator on invertebrates 12.5 –16.5 Alfaro et al. (2006)
Parapercis colias(Fish) Benthic predator 7.5 to 14.7 –25.7 to –16.6a Rodgers & Wing (2008)
Carcharodon carcharias(Shark)b Top predator 15.6 n.a. K. Rogers (pers. comm.)
Tursiopssp. (Dolphin) Top predator 12.8 to 15.9 –16.6 to –13.7 Lusseau & Wing (2006) Neomyxine biniplicata(Fish) Opportunistic feeder 13.7 to 14.9 –16.3 to –15.6a Present study
Eptatretus cirrhatus(Fish) Opportunistic feeder 14.0 to 15.8 –16.9 to –14.8a Present study
[image:9.612.58.539.551.703.2]Eptatretussp. 1 (Fish) Opportunistic feeder 13.9 to 16.6 –16.3 to –14.5a Present study aDelipidized samples; bjuvenile (size: 2.85 m), Wellington harbour (NZ), 4 Oct 2010
carbon isotopic signatures due to their higher mobil-ity. Our results did not show this. Eptatretus sp. 1 showed increasing δ13C’ values with depth. This could indicate a higher reliance on prey which had obtained their carbon from a different, more benthic, pathway. Sperm whales Physeter macro -cephalus are common in the canyons off Kaikoura and could represent a source of food, primarily for Eptatretus sp. 1. These cetaceans are apex preda-tors, their diet consisting mostly of cephalopods and fishes (Gaskin & Cawthorn 1967, Evans & Hindell 2004, Gómez-Villota 2007) and they have mostly been sighted in water deeper than 500 m and never shallower than 200 m (Jaquet et al. 2000). Consider-ing the importance of scavengConsider-ing on epi pelagic prey versus benthic prey, Drazen et al. (2008) found that 2 deep-sea macrourids (4100 m depth) by -passed the benthic food web by consuming rela-tively large amounts of epipelagic taxa, supple-mented by benthic prey. As a result, the macrourids displayed intermediate δ15N values because benthic prey had high stable isotope values for nitrogen compared to epipelagic fishes. If benthic prey dis-play a general increase in δ15N values with depth, then the interpretation of our results is not so straightforward. In this case, the increase of δ15N and δ13C’ values with depth for Eptatretus sp. 1 could simply be explained by a diet containing an increased amount of benthic prey. The analysis of δ15N from additional taxa in this food web or the use of compound-specific nitrogen isotope analysis of individual amino acids (Choy et al. 2012) could improve our understanding of these patterns.
For both Eptatretus species, the lipid content in muscle was high compared to other values for fishes from the literature (e.g. Hoffman & Sutton 2010) and did not change with depth, but Eptatretussp. 1 had slightly more variable values, suggesting some nutri-tional stress. High but variable lipid content in mus-cle tissue has previously been observed in E. deani, a deep-living species (Drazen et al. 2011). A possible explanation for this variability is that deep-living hagfish individuals are using their lipid reserve be -tween feeding opportunities, so that at any one time, intraspecific variability in lipid content will reflect time lapsed since the last meal. This strategy is again in line with the hypothesis that Eptatretus sp. 1 would be a deeper living species relying on less fre-quent meals. Another explanation is that lipid con-tent varies with the type of prey the hagfish recently fed on. Our results clearly show a positive relation-ship between trophic level and lipid content which supports the idea that diet affects lipid metabolism
(Bailey & Robison 1986). This relationship only holds at the interspecific level, however, not within a species. For E. cirrhatus, there is an increase in δ15N values with decreasing lipid content which was not observed with Eptatretussp. 1. Previously it has been shown that fasting or nutritional stress can cause ele-vated δ15N values in tissue (Hobson et al. 1993, Gaye-Siessegger et al. 2004), due to a faster recycling of the lighter 14N isotope. It suggests that E. cirrhatushas a reduced capacity compared to Eptatretus sp. 1 to sustain periods of fasting and more quickly enters a starvation mode where proteins are preferentially used as an energy source.
Several authors have linked Δδ13C and C:N ratios to lipid content (see Supplement 1). The maximum hagfish C:N ratio in this study was 24.9 (mean value of 11.2) which is extremely high compared to what has been observed in other fishes (Kiljunen et al. 2006, Hoffman & Sutton 2010). Glycogen granules have been identified as ‘abundant’ within the ultra-structure of muscle fibres in hagfish (Mellgren & Mathisen 1966, Korneliussen & Nicolaysen 1973). Glycogen comprises very little nitrogen, so it is possible that the high C:N ratios observed in this study could also be due to high levels of this com-pound. Lipids could be used to add buoyancy or as an energy source between periods of feeding for scavengers (Drazen 2007). However, hagfish starved for 1 mo consumed more than 90% of their glycogen in the liver and skeletal muscle, whereas protein and triglyceride contents appeared less affected (Emdin 1982). These results suggest that fasting for more than 1 mo is necessary for the hagfish to start using its lipid reserve. In light of the high variability in lipid content observed in this study, it is possible that several specimens had been fasting for an ex -tended period of time, possibly several months or more.
Acknowledgements. The MV ‘Tranquil Image’ crew N. Fur-ley, G. Gibbs and S. Kelly helped to organize all of the field-work using baited fish traps. R. Crech’riou, A. Smith, C. Bed-ford, O. HannaBed-ford, K. Rodgers, C. Struthers and T. Schultz contributed to the sampling effort. J. Barker helped with the sorting of specimens. We thank the staff of the Stable Iso-tope Laboratory, National IsoIso-tope Centre, GNS Science in Lower Hutt, New Zealand for isotope analysis. This work was supported by a Royal Society of New Zealand Marsden grant (MAU0713), Te Papa Collection Development Pro-gramme (AP3126) and FRST/NIWA Marine Biodiversity and Biosecurity OBI (contract COIX0502).
LITERATURE CITED
Alfaro AC, Thomas F, Sergent L, Duxbury M (2006) Identifi-cation of trophic interactions within an estuarine food web (northern New Zealand) using fatty acid biomarkers and stable isotopes. Estuar Coast Shelf Sci 70: 271−286 Anderson MJ (2001) A new method for non-parametric
mul-tivariate analysis of variance. Austral Ecol 26: 32−46 Anderson MJ, Willis TJ (2003) Canonical analysis of
princi-pal coordinates: a useful method of constrained ordina-tion for ecology. Ecology 84: 511−525
Anderson MJ, Gorley RN, Clarke KR (2008) PERMANOVA+ for PRIMER: guide to Software and Statistical Methods. PRIMER-E, Plymouth
Bailey TG, Robison BH (1986) Food availability as a selective factor on the chemical-compositions of midwater fishes in the eastern North Pacific. Mar Biol 91: 131−141 Bligh EG, Dyer WJ (1959) A rapid method of total lipid
extraction and purification. Can J Biochem Physiol 37: 911−917
Choy CA, Davison PC, Drazen JC, Flynn A and others (2012) Global trophic position comparison of two dominant meso pelagic fish families (Myctophidae, Stomiidae) using amino acid nitrogen isotopic analyses. PLoS ONE 7: e50133
Clarke KR, Gorley RN (2006) PRIMER v6: user manual/ Tutorial. PRIMER-E, Plymouth, UK
Cox GK, Sandblom E, Richards J, Farrell A (2011) Anoxic survival of the Pacific hagfish Eptatretus stoutii.J Comp Physiol B 181: 361−371
DeNiro MJ, Epstein S (1977) Mechanism of carbon isotope fractionation associated with lipid synthesis. Science 197: 261−263
DeNiro MJ, Epstein S (1981) Influence of diet on the distri-bution of nitrogen isotopes in animals. Geochim Cos-mochim Acta 45: 341−351
Deschner T, Fuller BT, Oelze VM, Boesch C and others (2012) Identification of energy consumption and nutri-tional stress by isotopic and elemental analysis of urine in bonobos (Pan paniscus). Rapid Commun Mass Spec-trom 26: 69−77
Downing SW, Spitzer RH, Koch EA, Salo WL (1984) The hagfish slime gland thread cell. I. A unique cellular sys-tem for the study of intermediate filaments and interme-diate filament-microtubule interactions. J Cell Biol 98: 653−669
Drazen JC (2007) Depth related trends in proximate compo-sition of demersal fishes in the eastern North Pacific. Deep-Sea Res I 54: 203−219
Drazen JC, Popp BN, Choy CA, Clemente T, De Forest L, Smith KL (2008) Bypassing the abyssal benthic food web:
Macrourid diet in the eastern North Pacific inferred from stomach content and stable isotopes analyses. Limnol Oceanogr 53: 2644−2654
Drazen JC, Yeh J, Friedman J, Condon N (2011) Metabolism and enzyme activities of hagfish from shallow and deep water of the Pacific Ocean. Comp Biochem Physiol A Mol Integr Physiol 159: 182−187
Emdin SO (1982) Effects of hagfish insulin in the atlantic hagfish, Myxine glutinosa— the in vivo metabolism of [14C]glucose and [14C]leucine and studies on starvation
and glucose-loading. Gen Comp Endocrinol 47: 414−425 Evans K, Hindell MA (2004) The diet of sperm whales (Phy-seter macrocephalus) in southern Australian waters. ICES J Mar Sci 61: 1313−1329
Flood PR (1998) The skeletal muscle fibre types of Myxine glutinosa. In: Jorgensen JM, Lomholt JP, Weber RE, Malte H (eds) Biology of hagfishes. Chapman & Hall, London, p 173–202
Forrest BM, Gillespie PA, Cornelisen CD, Rogers KM (2007) Multiple indicators reveal river plume influence on sedi-ments and benthos in a New Zealand coastal embay-ment. NZ J Mar Freshw Res 41: 13−24
Gaskin DE, Cawthorn MW (1967) Squid mandibles from the stomachs of sperm whales (Physeter catodon L.) cap-tured in the cook strait region of New Zealand. NZ J Mar Freshw Res 1: 59−70
Gaye-Siessegger J, Focken U, Muetzel S, Abel H, Becker K (2004) Feeding level and individual metabolic rate affect
δ13C and δ15N values in carp: implications for food web
studies. Oecologia 138: 175−183
Gómez-Villota F (2007) Sperm whale diet in New Zealand. Master of Applied Science, Auckland University of Technology
Graves GR, Newsome SD, Willard DE, Grosshuesch DA, Wurzel WW, Fogel ML (2012) Nutritional stress and body condition in the Great Gray Owl (Strix nebulosa) during winter irruptive migrations. Can J Zool 90: 787–797 Hatch KA, Crawford MA, Kunz AW, Thomsen SR, Eggett
DL, Nelson ST, Roeder BL (2006) An objective means of diagnosing anorexia nervosa and bulimia nervosa using
15N/14N and 13C/12C ratios in hair. Rapid Commun Mass
Spectrom 20: 3367−3373
Hobson KA, Alisauskas RT, Clark RG (1993) Stable-nitrogen isotope enrichment in avian-tissues due to fasting and nutritional stress: implications for isotopic analyses of diet. Condor 95: 388−394
Hobson KA, Sirois J, Gloutney ML (2000) Tracing nutrient allocation to reproduction with stable isotopes: a prelim-inary investigation using colonial waterbirds of Great Slave Lake. Auk 117: 760−774
Hoffman JC, Sutton TT (2010) Lipid correction for carbon stable isotope analysis of deep-sea fishes. Deep-Sea Res I 57: 956−964
Hückstädt LA, Koch PL, McDonald BI, Goebel ME, Crocker DE, Costa DP (2012) Stable isotope analyses reveal indi-vidual variability in the trophic ecology of a top marine predator, the southern elephant seal. Oecologia 169: 395−406
Jaquet N, Dawson S, Slooten E (2000) Seasonal distribution and diving behaviour of male sperm whales off Kaik-oura: foraging implications. Can J Zool 78: 407–419 Johnson EW (1994) Aspects of the biology of Pacific
(Epta-tretus stouti) and Black (Eptatretus deani)hagfishes in Monterey Bay, California. Master thesis, Fresno Califor-nia State University, CA
Kiljunen M, Grey J, Sinisalo T, Harrod C, Immonen H, Jones RI (2006) A revised model for lipid-normalizing δ13C
val-ues from aquatic organisms, with implications for isotope mixing models. J Appl Ecol 43: 1213−1222
Knapp L, Mincarone MM, Harwell H, Polidoro B, San-ciangco J, Carpenter K (2011) Conservation status of the world’s hagfish species and the loss of phylogenetic diversity and ecosystem function. Aquatic Conserv Mar Freshw Ecosyst 21: 401−411
Kolasinski J, Frouin P, Sallon A, Rogers K, Bruggemann HJ, Potier M (2009) Feeding ecology and ontogenetic dietary shift of yellowstripe goatfish Mulloidichthys flavolinea-tus(Mullidae) at Reunion Island, SW Indian Ocean. Mar Ecol Prog Ser 386: 181−195
Korneliussen H, Nicolaysen K (1973) Ultrastructure of four types of striated muscle fibers in the atlantic hagfish (Myxine glutinosa, L.). Z Zellforsch Mikrosk Anat 143: 273−290
Lachenbruch PA, Mickey MR (1968) Estimation of error rates in discriminant analysis. Technometrics 10: 1−11 Logan JM, Lutcavage ME (2008) A comparison of carbon
and nitrogen stable isotope ratios of fish tissues following lipid extractions with non-polar and traditional chloro-form/methanol solvent systems. Rapid Commun Mass Spectrom 22: 1081−1086
Logan JM, Jardine TD, Miller TJ, Bunn SE, Cunjak RA, Lut-cavage ME (2008) Lipid corrections in carbon and nitro-gen stable isotope analyses: comparison of chemical ex traction and modelling methods. J Anim Ecol 77: 838−846
Lusseau SM, Wing SR (2006) Importance of local production versus pelagic subsidies in the diet of an isolated popula-tion of bottlenose dolphins Tursiopssp. Mar Ecol Prog Ser 321: 283−293
Martini FH (1998) The ecology of hagfishes. In: Jorgensen JM, Lomholt JP, Weber RE, Malte H (eds) Biology of hagfishes. Chapman & Hall, London, p 57–77
McConnaughey T, McRoy CP (1979) Food-Web structure and the fractionation of carbon isotopes in the Bering Sea. Mar Biol 53: 257−262
McLeod RJ, Wing SR (2007) Hagfish in the New Zealand fjords are supported by chemoautotrophy of forest car-bon. Ecology 88: 809−816
Mellgren SI, Mathisen JS (1966) Oxidative enzymes, glyco-gen and lipid in striated muscle — a histochemical study in Atlantic hagfish (Myxine glutinosa(L)). Z Zellforsch Mikrosk Anat 71: 169−188
Peterson BJ, Fry B (1987) Stable isotopes in ecosystem studies. Annu Rev Ecol Syst 18: 293−320
Pinnegar JK, Polunin NVC (2000) Contributions of stable-isotope data to elucidating food webs of Mediterranean rocky littoral fishes. Oecologia 122: 399−409
Post DM, Layman CA, Arrington DA, Takimoto G,
Quat-trochi J, Montana CG (2007) Getting to the fat of the mat-ter: models, methods and assumptions for dealing with lipids in stable isotope analyses. Oecologia 152: 179−189 Powell ML, Kavanaugh SI, Sower SA (2005) Current knowl-edge of hagfish reproduction: implications for fisheries management. Integr Comp Biol 45: 158−165
R Development Core Team (2012) R: A language and envi-ronment for statistical computing. www.R-project.org Richardson LR, Jowett JP (1951) A new species of Myxine
(Cyclostomata) from Cook Strait. Zoology Publications from Victoria University College 12: 1−5
Rodgers KL, Wing SR (2008) Spatial structure and move-ment of blue cod Parapercis coliasin Doubtful Sound, New Zealand, inferred from δ13C and δ15N. Mar Ecol
Prog Ser 359: 239−248
Rogers KM (2009) Stable isotopes as a tool to differentiate eggs laid by caged, barn, free range, and organic hens. J Agric Food Chem 57: 4236−4242
Rueda FM, Martinez FJ, Zamora S, Kentouri M, Divanach P (1998) Effect of fasting and refeeding on growth and body composition of red porgy, Pagrus pagrusL. Aqua -cult Res 29: 447−452
Shelton RGJ (1978) On the feeding of the hagfish Myxine glutinosain the North Sea. J Mar Biol Assoc UK 58: 81−86 Smith CR (1985) Food for the deep-sea: utilization, dispersal, and flux of nekton falls at the Santa Catalina Basin floor. Deep-Sea Res I 32: 417−442
Smith CR, Baco AR (2003) Ecology of whale falls at the deep-sea floor. Oceanogr Mar Biol Annu Rev 41: 311−354 Strahan R (1963) The behaviour of myxinoids. Acta Zool 44:
73−102
Sweeting CJ, Polunin NVC, Jennings S (2006) Effects of chemical lipid extraction and arithmetic lipid correction on stable isotope ratios of fish tissues. Rapid Commun Mass Spectrom 20: 595−601
Tamburri MN, Barry JP (1999) Adaptations for scavenging by three diverse bathyla species, Eptatretus stouti, Nep-tunea amiantaand Orchomene obtusus.Deep-Sea Res I 46: 2079−2093
Tocher DR (2003) Metabolism and functions of lipids and fatty acids in teleost fish. Rev Fish Sci 11: 107−184 Weatherley AH, Gill HS (1981) Recovery growth following
periods of restricted rations and starvation in rainbow trout Salmo gairdneriRichardson. J Fish Biol 18: 195−208 Zintzen V, Roberts CD, Anderson MJ, Stewart AL, Struthers CD, Harvey ES (2011) Hagfish predatory behaviour and slime defence mechanism. Scientific Reports 1:131, doi: 10. 1038/srep00131
Zintzen V, Anderson MJ, Roberts CD, Harvey ES, Stewart AL, Struthers CD (2012) Diversity and composition of demersal fishes along a depth gradient assessed by baited remote underwater stereo-video. PLoS ONE 7: e48522
Editorial responsibility: Hans-Heinrich Janssen, Oldendorf/Luhe, Germany
Submitted: December 17, 2012; Accepted: March 13, 2013 Proofs received from author(s): May 27, 2013
➤
➤
➤
➤
➤
➤
➤
➤
➤
➤
➤
➤
➤
➤
➤
➤
➤
➤
➤
➤
➤
➤
➤
➤
➤
Massey Documents by Type Journal Articles