GENETICS
Variance Components and Selection Response
for Feather-Pecking Behavior in Laying Hens
G. Su,*
,1J. B. Kjaer,† and P. Sørensen*
*Department of Animal Breeding and Genetics; and †Department of Animal Health and Welfare, Danish Institute of Agricultural Sciences, Research Centre Foulum, P.O. Box 50, Tjele 8830, Denmark
ABSTRACT Variance components and selection re-sponse for feather pecking behavior were studied by ana-lyzing the data from a divergent selection experiment. An investigation indicated that a Box-Cox transformation with powerλ=−0.2 made the data approximately nor-mally distributed and gave the best fit for the model. Variance components and selection response were esti-mated using Bayesian analysis with Gibbs sampling tech-nique. The total variation was rather large for the investi-gated traits in both the low feather-pecking line (LP) and the high feather-pecking line (HP). Based on the mean of marginal posterior distribution, in the Box-Cox trans-formed scale, heritability for number of feather pecking
(Key words: feather pecking, selection, heritability, Box-Cox transformation, poultry welfare)
2005 Poultry Science 84:14–21
INTRODUCTION
Feather pecking (FP) is characterized as pecking at and pulling out of feather of conspecifics. It is thought to be a form of redirected behavior, originating from ground pecking (Blokhuis, 1986), dust-bathing (Vestergaard and Lisborg, 1993), or socially related pecking (Riedstra and Groothuis, 2002). The physiological mechanisms are not well known, but there is evidence that birds with a strong tendency to perform FP have some kind of malfunction in the dopamine system. Treatment with haloperidol, a dopamine D2 receptor antagonist, was found to reduce FP (Kjaer et al., 2004). Feather pecking can have a range of harmful consequences. Feather removal is painful to the birds (Gentle and Hunter, 1990) and FP appears to be associated with fearfulness (Hughes and Duncan, 1972). Panic and fearful reactions to FP can cause trampling (Mills and Faure, 1990). Feather pecking sometimes leads to cannibalism and this can result in high mortality (Appleby et al., 1992; Savory, 1995; Kjaer and Sørensen, 2002). Feather pecking can cause extensive feather
dam-2005 Poultry Science Association, Inc. Received for publication June 21, 2004. Accepted for publication October 11, 2004.
1To whom correspondence should be addressed: guosheng.su@
agrsci.dk.
14
bouts (FP bouts) was 0.174 in line LP and 0.139 in line HP. For number of feather-pecking pecks (FP pecks), heri-tability was 0.139 in line LP and 0.105 in line HP. No full-sib group effect and observation pen effect were found in the 2 traits. After 4 generations of selection, the total response for number of FP bouts in the transformed scale was 58 and 74% of the mean of the first generation in line LP and line HP, respectively. The total response for number of FP pecks was 47 and 46% of the mean of the first generation in line LP and line HP, respectively. The variance components and the realized selection response together suggest that genetic selection can be effective in minimizing FP behavior. This would be expected to re-duce one of the major welfare problems in laying hens.
age and consequently a loss of heat, thus leading to higher feeding costs (Tauson and Svensson, 1980; Blokhuis and Wiepkema, 1998).
To reduce the harmful effects of FP, beak trimming of birds is widely used in poultry production. However beak trimming itself causes pain and suffering (Gentle, 1986; Duncan et al., 1989; Gentle et al., 1990; Hester and Shea-Moore, 2003). An alternative approach to reduce FP be-havior is genetic selection. Many investigations have found a variation in FP behavior between strains and between family groups (Richter, 1954; Hughes and Dun-can, 1972; Tind and Ambrosen, 1988; Craig and Lee, 1990; Kjaer, 2000). Low to moderate heritabilities (h2) for FP have been reported (Cuthbertson, 1980; Bessei, 1984; Kjaer and Sørensen, 1997; Rodenburg et al., 2003). These results indicate that there is a genetic basis for FP behavior.
Genetic change of the tendency to perform injurious pecking has been demonstrated. Using group selection, the incidence of beak-inflicted injuries, causing feather loss and cannibalism, was reduced after one generation of selection (Craig and Muir, 1993), and greatly reduced after 6 generations of selection (Muir, 1996). Using
diver-Abbreviation Key:FP = feather pecking; h2= heritability; HP = high
feather pecking line; LP = low feather pecking line; REML = restricted maximum likelihood
gent selection for number of FP bouts, Kjaer et al. (2001) obtained a high and a low feather-pecking line.
To properly plan and conduct a selection program, unbiased estimates of genetic parameters are required. In general, FP data are quite far from a normal distribution. Current methods to estimate genetic parameters, how-ever, usually assume that data, either in original scale or on an underlying scale, are normally distributed. There-fore, a proper transformation making the data normally distributed should be carried out to get an unbiased esti-mate of the genetic parameters. Several transformations can be used for this purpose. One of the most common methods is the Box-Cox power transformation (Box and Cox, 1964).
Response to selection can be evaluated by least square means if proper control lines are available. Otherwise, response to selection can be estimated as contrasts be-tween generation means of the additive genetic values obtained with the mixed model equations based on ani-mal models. Methods based on aniani-mal models include 2 approaches. The first is a 2-stage procedure (Sorensen and Kennedy, 1986; Harville, 1990), whereby variances are estimated first and then used in lieu of the true param-eters to solve the mixed-model equations. In this ap-proach, inferences about selection response ignore the uncertainty associated with the estimated variances. The second approach is to make use of Bayesian methods in which all parameters in the model are estimated simulta-neously, thereby accounting for the uncertainty of all other parameters of the model (Sorensen et al., 1994).
The objective of the present study was to investigate genetic variation in FP behavior and genetic change of this trait by selection, by analyzing the data from a divergent selection experiment. In the analysis, the data were trans-formed using Box-Cox power transformation. Variance components and selection response were estimated using Bayesian methods with Gibbs sampling and based on an animal model.
MATERIALS AND METHODS
The Populations and Selection Experiment
The data were collected from 2 experimental lines: line LP was selected for low FP, and line HP for high FP. The lines were established in 1995 and derived from a White Leghorn layer line formed in 1970. In the common base population, 123 hens were assessed for FP behavior at 67 wk of age. Then, the 30 females and 10 males with the highest breeding value of FP activity were selected as the founder animals of line HP, and the 30 females and 10 males with lowest breeding value were selected as the founder animals of line LP.
In the subsequent generations, a consistent selection procedure was followed. In each generation, at about 30 wk of age, females were transferred from cages to floor pens. Pen size was 2×4 m, and each pen held 20 females. After a settling-in period of 7 to 12 d, FP behavior of the females was recorded by video camera for 3 h. During
the measuring period, incandescent light was supplied with light intensity of approximately 25 lx at ground level. Feather-pecking behavior of individual hens was recorded from the tapes by counting the number of feather pecks (FP pecks) and grouping these into FP bouts (FP bouts). An FP bout was defined as a series of continu-ous pecks directed to the same recipient hen. Selection was based on the number of FP bouts. In each generation, 10 males (from about 50) and 30 females (from about 200) were selected as breeding birds in each line, based on breeding value, which was estimated using an animal model.
The selected birds were placed in individual cages and artificial insemination was conducted twice a week dur-ing the period of collectdur-ing eggs for hatchdur-ing. All the eggs were pedigreed. The newly hatched chicks were tagged with identification bands in the wing and randomly dis-tributed into floor pens. Birds in the 2 lines were mixed in the floor pens. At 18 wk, the birds were transferred to battery cages with 4 pullets in a cage and each male in a single-bird cage. The pullets in 1 cage came from the same line, but the cages with line LP or line HP birds were balanced over rows and within rows. Feed and water were supplied ad libitum during the experiment. The diets for 0 to 5 wk, 6 to 15 wk, and after 16 wk had crude protein content of 20.5, 13.2, and 16.4%, and an energy content of 2,771, 2,842, and 2,651 kcal/kg, respectively.
The data set in the present study covered generations 1 to 5 but excluded the observations for generation 0 (the common base population), because FP behavior was measured at 67 wk in this generation. As shown by Kjaer and Sørensen (1997), genetic correlation in FP behavior at 38 and 69 wk is about 0.5. The genetic correlation indicates that FP behavior measured at 67 wk in tion 0 and at about 30 wk of age in the following genera-tion should be taken as 2 different traits. Thus, observa-tions of FP in the data set came from 1,050 females in line LP and 1,060 females in line HP. For a more detailed description of the experiment and the testing procedure of feather pecking, see Kjaer et al. (2001).
Statistical Analysis
The data were analyzed separately for each trait (num-ber of FP bouts and num(num-ber of FP pecks) and each line (LP and HP). The following model was used to describe the component effects of an individual observation:
y=Xb+Zcc+Zff +Zaa+e
wherey is the vector of number of bouts or number of pecks in Box-Cox transformation scale (Box and Cox, 1964),bis the vector of year-hatch effects,cis the vector of random effects of observation pens,fis the vector of full-sib group effects,a is the vector of additive genetic values,eis the vector of random residuals, andX,Zc,Zf, Za are known design matrices associating b,c,f, anda
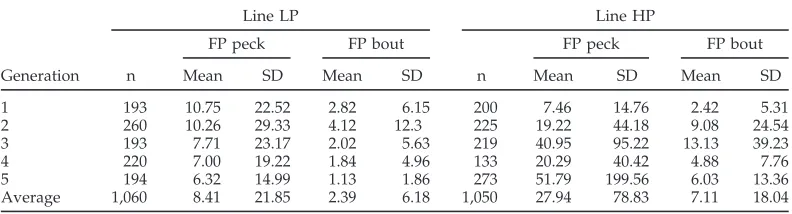
TABLE 1. Number of hens observed (n), mean, and SD for number of feather pecks (FP peck) and number of feather pecking bouts (FP bout) in each generation for the line selected
for low feather pecking (LP) and the line selected for high feather pecking (HP)
Line LP Line HP
FP peck FP bout FP peck FP bout
Generation n Mean SD Mean SD n Mean SD Mean SD
1 193 10.75 22.52 2.82 6.15 200 7.46 14.76 2.42 5.31
2 260 10.26 29.33 4.12 12.3 225 19.22 44.18 9.08 24.54
3 193 7.71 23.17 2.02 5.63 219 40.95 95.22 13.13 39.23
4 220 7.00 19.22 1.84 4.96 133 20.29 40.42 4.88 7.76
5 194 6.32 14.99 1.13 1.86 273 51.79 199.56 6.03 13.36
Average 1,060 8.41 21.85 2.39 6.18 1,050 27.94 78.83 7.11 18.04
c∼N(0,Iσ2c),f∼N(0,Iσ2f),a ∼N(0,Aσ2a),ande∼N(0,Iσ2e),
whereσ2c,σ2f,σ2a, andσ2e are variance of observation pen
effects, full-sib group effects, additive genetic values, and random residuals, respectively,Iis the identity matrix of appropriate order, and A is the matrix of genetic rela-tionships.
The Box-Cox transformation was done as
yt=(y
λ−1)
λ ,forλ≠0, yt= log(y),forλ= 0, (y> 0)
where y is number of FP bouts or number of FP pecks in original scale plus 1 (to meet y>0). A set ofλranging from –1 to 1 with interval 0.1 was used to do the transfor-mation. An approximate optimal value ofλwas obtained by judging the normality and the maximum likelihood based on the transformations with different values ofλ. The normality was evaluated by skewness and kurtosis for the transformed data after accounting for year-hatch effects. The maximum likelihood was obtained using REML (restricted maximum likelihood) procedure with the package DMU (Jensen and Madsen, 1993) based on the above model.
Variance components and breeding values were esti-mated using a Bayesian analysis with Gibbs sampling technique (Korsgaard et al., 2003) based on the transfor-mation with the approximate optimal value ofλ. In the Bayesian analysis, the prior distribution of fixed effects and variance components was assumed uniformly dis-tributed. The Gibbs sampler was run using a single chain of length 250,000. To ensure that the samples for posterior analysis drawn after the sampler had reached conver-gence, the first 100,000 were discarded.
RESULTS
Mean and standard deviation of FP pecks and FP bouts are shown in Table 1. After generation 1, mean number of pecks and bouts were consistently larger in line HP compared with line LP. In generation 5, bout number and peck number were 3 times higher in line HP compared with line LP. In addition, the phenotypic mean of the 2 traits decreased gradually in line LP but fluctuated in line HP. The variation in bout number and peck number was
rather larger. The standard deviation was about 2.5 times the mean in the 2 traits, and there was a scale effect on standard deviation, i.e., standard deviation increased with an increase of mean.
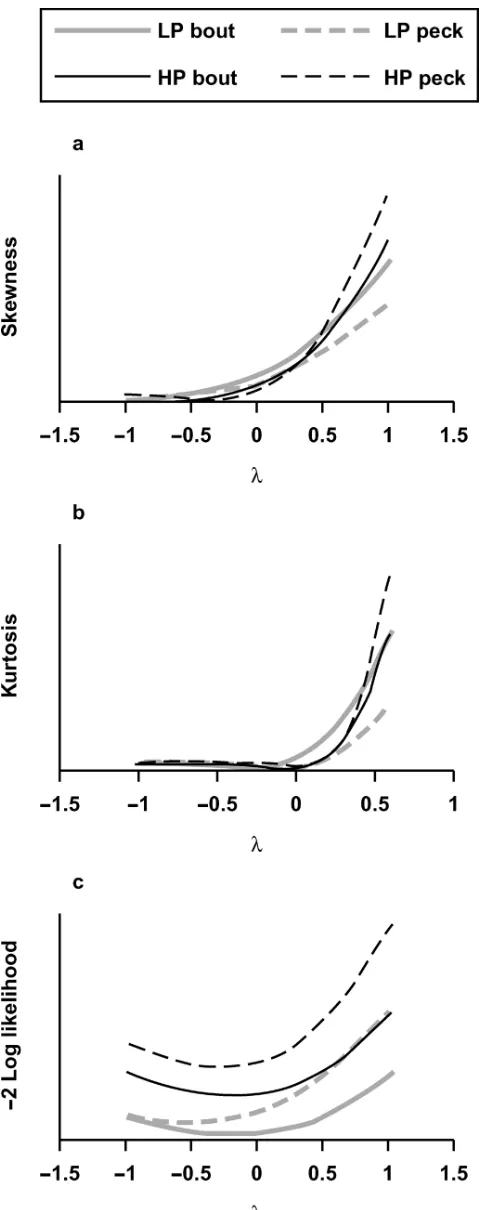
Figure 1 (a, b) shows the skewness and kurtosis (ex-pressed as absolute value) for the data transformed with different values ofλ(range from−1 to 1). The transforma-tion withλ=−1 gave a minimal skewness for number of FP bouts and number of FP pecks in line LP, but with
λ = −0.4 in line HP. The transformation with λ = −0.2 gave an optimal kurtosis for number of FP bouts and withλ = 0 for number of FP pecks in both 2 lines. The
−2 log maximum likelihood from REML analysis based on the given model is plotted in Figure 1c. The largest maximum likelihood (smallest −2 log maximum likeli-hood) was obtained from the data transformed usingλ=
−0.2 except for FP pecks in line LP, which had the largest maximum likelihood from the data transformed with
λ=−0.5.
As a compromise between minimizing skewness and kurtosis and maximizing likelihood as well as performing a transformation as consistent among the traits and lines as possible,λ= –0.2 was chosen as the approximate opti-mal value to be used in the Box-Cox transformation for FP bouts and FP pecks in both lines. Table 2 shows the mean and standard deviation of bout number and peck number in the first generation and over all generations, based on the data using the Box-Cox transformation with
λ= –0.2. In the first generation, bout number and peck number in the transformed scale were similar in the 2 lines. However, averaged over generations, bout number and peck number in line HP were about 1.5 times as high as in line LP. The standard deviations for the 2 traits in line LP were smaller than those in line HP, but the coefficients of variation in line LP were a little larger than those in line HP.
FIGURE 1.The skewness (a) and kurtosis (b) (expressed as absolute value) for the data transformed with different values ofλ(ranging from
−1 to 1), and the maximal likelihood (c) based on these transformations and the given model. LP bout = number of feather pecking bouts in the line selected for low feather pecking, LP peck = number of feather pecks in the line selected for low feather pecking, HP bout = number of feather pecking bouts in the line selected for high feather pecking, and HP peck = number of feather pecks in the line selected for high feather pecking.
tended to be larger than in line LP for FP bout but the difference was not statistically significant (P= 0.345). The h2for number of FP bouts was higher than that for number of FP pecks in both lines. The h2 for the 2 traits were higher in line LP than in line HP. However, these differ-ences between estimates of h2 were not statistically sig-nificant.
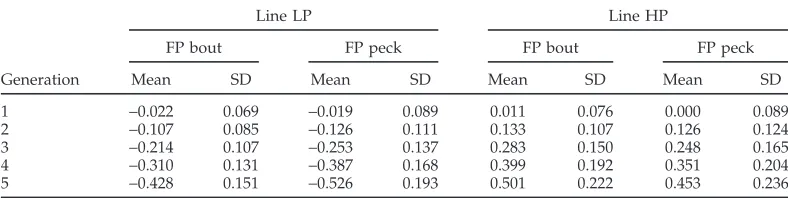
The mean and standard deviation of the marginal pos-terior distribution of the additive genetic mean in each generation are shown in Table 4. In contrast with the phenotypic mean, the average breeding value changes smoothly over generations. In line LP, the average breed-ing value for number of FP bouts and number of FP pecks decreased linearly over generations, whereas the average breeding value increased linearly over generations in line HP. The regression (coefficient of regression± standard error) of average breeding value on the number of genera-tions was−0.102±0.003 and 0.125±0.005 for number of FP bouts, and−0.128±0.004 and 0.125±0.003 for number of FP pecks in line LP and line HP, respectively.
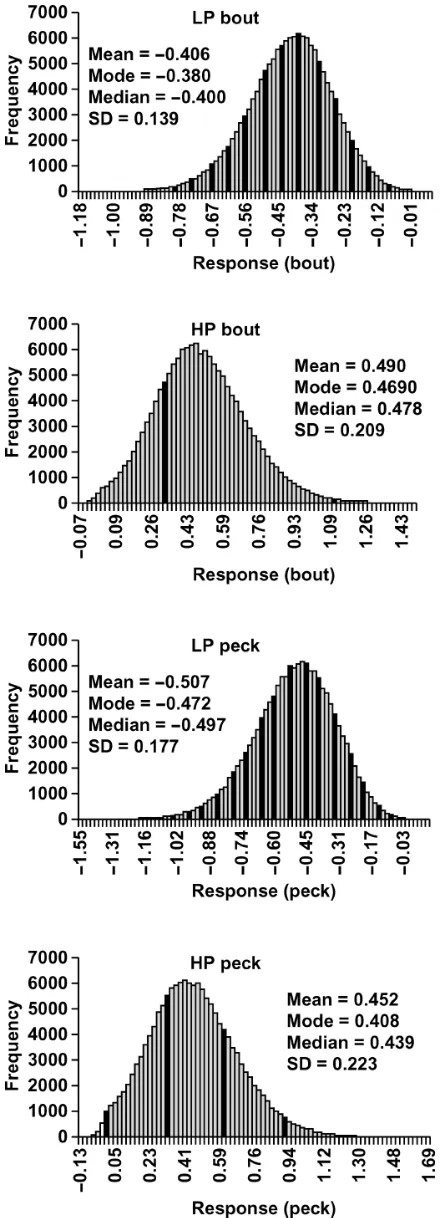
Figure 2 shows the marginal posterior distribution of the total response measured as the difference between average breeding values in the last generation and the first generation. The distribution was approximately normal with slight negative skew in line LP and slight positive skew in line HP. Based on the mean of the marginal posterior distribution, over 4 generations of selection for number of FP bouts, the total response for this trait was
−0.406 in line LP and 0.490 in line HP, and the total response for number of FP peck was −0.507 in line LP and 0.452 in line HP. In percentage of the mean of the first generation, the total response was 58% for number of FP bouts and 47% for number of FP pecks in line LP, and 74 and 46% in line HP, respectively.
The response in original scale (Figure 3) was approxi-mately estimated by the inverse transformation from the generation mean of breeding values in transformed scale. Although the response in the transformed scale was nearly symmetric in the 2 lines, the response in original scale was rather asymmetric. Total response for number of FP bouts (l.663) in line HP was 2 times as large as that (−0.772) in line LP. Total response for number of FP pecks (2.469) in line HP was nearly 2 times as large as that (−1.516) in line LP.
DISCUSSION
TABLE 2. Means and SD of number of feather pecks (FP peck) and number of feather pecking bouts (FP bout) in Box-Cox transformed scale withλ=−0.2 for the line selected for low feather pecking (LP)
and the line selected for high feather pecking (HP) in the first generation and over generations
Line LP Line HP
FP peck FP bout FP peck FP bout
Generation Mean SD Mean SD Mean SD Mean SD
First generation 1.07 0.99 0.70 0.68 0.99 0.93 0.66 0.66
Over generations 0.85 0.95 0.57 0.65 1.28 1.09 0.92 0.83
changes from nongenetic changes without the need for control lines assuming that the model is correct (Sorensen and Kennedy, 1986). Therefore, the present analysis was carried out for each line and based on an animal model. Genetic parameters are usually estimated by a linear model in which the dependent variables and the random effects are assumed to be normally distributed. When the distribution of the data departs far from a normal distribution, data transformation is often applied to make data close to normality to fulfill the model assumptions. In the current study, data were transformed using Box-Cox transformation with λ = −0.2. It was taken as an approximate optimal transformation with regard to maxi-mum likelihood and normality. The genetic parameters and selection responses estimated based on this transfor-mation were expected to be more reliable than those esti-mated on original data.
[image:5.612.107.504.80.152.2]In the present study, variance components and breed-ing values were estimated usbreed-ing a Bayesian approach. In the Bayesian analysis, all parameters in the model were estimated simultaneously. Thus the estimates of breeding values and selection response accounted for the uncer-tainty associated with all other parameters in the model. In addition, the standard error of selection response could be obtained directly from the standard deviation of the marginal posterior distribution of the selection response. The full-sib group effect in the model was expected to account for full-sib intraclass correlation caused by factors other than additive genetic effects. In the current study, the variance of this component appeared to be zero. It indicates that dominant and maternal effects as well as the environmental effect common to full-sibs were negli-gible for number of FP bouts and number of FP pecks. This is a very important result in relation to commercial
TABLE 3. The mean and SD of the marginal posterior distribution for phenotypic variance (σ2p), the ratios of variance for pen effect (c2) and full-sib group effect (f2), and heritability (h2) of bout number
and peck number in Box-Cox transformed scale withλ=−0.2
σ2
p c2 f2 h2
Trait1 Line2 Mean SD Mean SD Mean SD Mean SD
FP bout LP 0.435 0.022 0.001 0.003 0.000 0.000 0.174 0.069
HP 0.717 0.036 0.000 0.000 0.001 0.005 0.139 0.065
FP peck LP 0.892 0.044 0.000 0.000 0.000 0.000 0.139 0.056
HP 1.223 0.059 0.000 0.000 0.000 0.000 0.105 0.054
1FP bout = number of feather pecking bouts; FP peck = number of feather pecks.
2LP = the line selected for low feather pecking; HP = the line selected for high feather pecking.
selection programs, as these programs normally involve several line crosses for the production of the commercially available hybrid (Besbes and Ducrocq, 2003).
It has been suggested that FP may spread by social transmission in groups of laying hen chicks (Zeltner et al., 2000). The present analysis took observing pen as a random effect into the model to account for environmen-tal effect common to the birds in the same observing pen, which was expected to cover the effect of social transmission. However, no effect of observing pen could be found. This indicated that the effect of social transmis-sion is very small in relation to genetic effects. Alterna-tively, the effect of social transmission was too small to be detected in the current data by the present method. It may be due to the fact that the birds were too old and stayed in the observing pen for too short a period to modify their feather-pecking behavior by seeing the other birds performing feather pecking.
FIGURE 2.Histograms with mean, mode, median, and SD of mar-ginal posterior distributions for total additive genetic gain. LP bout = number of feather pecking bouts in the line selected for low feather pecking, LP peck = number of feather pecks in the line selected for low feather pecking, HP bout = number of feather pecking bouts in the line selected for high feather pecking, and HP peck = number of feather pecks in the line selected for high feather pecking.
FIGURE 3.Response to selection in original scale and in Box-Cox transformed scale for number of feather pecking bouts and number of feather pecks. LP(o) = original scale in the line selected for low feather pecking, LP(t) = transformed scale in the line selected for low feather pecking, HP(o) = original scale in the line selected for high feather peck-ing, and HP(t) = transformed scale in the line selected for high feather pecking.
h2 of 0.12, 0.08, 0.00, and 0.02 for number of gentle FP bouts, gentle FP pecks, severe feather pecking bouts, and severe FP pecks, respectively, at 6 wk of age; h2for these traits were 0.15, 0.16, 0.06, and 0.07, respectively, at 30 wk of age. In the present study, the FP behavior of the hens was recorded at about 30 wk. The estimates of herita-bility were 0.17 and 0.14 for number of FP bouts, and 0.14 and 0.11 for number of FP pecks in line LP and HP, respectively. These estimates were in agreement with these previous studies.
TABLE 4. The mean and SD of the marginal posterior distribution of average breeding values of each generation for number of feather pecking bouts (FP bout) and number of feather pecks
(FP peck) in Box-Cox transformed scale withλ=−0.2 for the line selected for low feather pecking (LP) and the line selected for high feather pecking (HP)
Line LP Line HP
FP bout FP peck FP bout FP peck
Generation Mean SD Mean SD Mean SD Mean SD
1 −0.022 0.069 −0.019 0.089 0.011 0.076 0.000 0.089
2 −0.107 0.085 −0.126 0.111 0.133 0.107 0.126 0.124
3 −0.214 0.107 −0.253 0.137 0.283 0.150 0.248 0.165
4 −0.310 0.131 −0.387 0.168 0.399 0.192 0.351 0.204
5 −0.428 0.151 −0.526 0.193 0.501 0.222 0.453 0.236
higher than that for number of FP pecks. The results indicated that it is an advantage to use number of FP bouts as a selection trait.
In spite of moderately low h2, selection for FP was still very effective due to large variation. Although h2 for number of FP bouts in line HP was lower than that in line LP, line HP showed a larger response in this trait, probably due to a larger genetic variation in line HP. On the other hand, line LP got a larger response for FP pecks than line HP. A possible explanation is that h2for number of FP pecks in line LP was higher than that in line HP, although additive genetic variances for number of FP pecks were similar in the 2 lines. As a whole, the response in the transformed scale was nearly symmetrical in the 2 lines, but it should be kept in mind that responses to divergent selections in a Box-Cox transformed scale are not necessarily symmetrical. On the other hand, in origi-nal scale, total response in line HP was much larger than that in line LP for number of LP bouts and number of FP pecks. This can be explained by the fact that the distri-bution of the data was negatively skewed.
In conclusion, estimates of genetic parameters for FP behavior in laying hens based on the longest selection history and largest data set available to date were pre-sented. Results from the current study showed there was a large phenotypic and genetic variation for FP within strain. Heritability for feather pecking behavior was low or moderate with higher h2for number of FP bouts and lower h2 for number of FP pecks. Even though h2 was not high, selection for and against FP resulted in a large genetic change in FP behavior due to the large variation within strain. No full-sib effect could be detected, indicat-ing that dominant and maternal effects were small. No variation between observation pens could be found; im-plying that social transmission of FP behavior for adult hens during a settling period of 7 to 12 d was negligible. The variance components and the actual selection re-sponse together suggest that genetic selection could be a useful tool in minimizing FP behavior in commercial stocks of laying hens. This would be expected to reduce one of the major welfare problems in egg production.
REFERENCES
Appleby, M. C., B. O. Hughes, and H. A. Elson. 1992. Poultry Systems, Behaviour, Management and Welfare. CAB Interna-tional, Wallingford, UK.
Besbes, B., and V. Ducrocq. 2003. Use of mixed model methodol-ogy in breeding strategies for layers. Pages 127–146 in Poultry Breeding and Biotechnology. W. Muir, and S. Aggrey, ed. CABI Publishing, Wallingford, UK.
Bessei, W. 1984. Untersuchungen zur Heritabilita¨t des Feder-pickverhaltens bei Junghennen. 1. Mitteilung. Arch. Geflu¨-gelkd. 48:224–231.
Blokhuis, H. J. 1986. Feather-pecking in poultry: Its relation with ground-pecking. Appl. Anim. Behav. Sci. 16:63–67.
Blokhuis, H. J., and P. R. Wiepkema. 1998. Studies of feather pecking in poultry. Vet. Q. 20:6–9.
Box, G. E. P., and D. R. Cox. 1964. An analysis of transformations. J. R. Stat. Soc. (B) 26:211–252.
Craig, J. V., and H. Y. Lee. 1990. Beak trimming and genetic stock effects on behaviour and mortality from cannibalism in White Leghorn-type pullets. Appl. Anim. Behav. Sci. 25:107–123.
Craig, J. V., and W. M. Muir. 1993. Selection for reduction of beak-inflicted injures among caged hens. Poult. Sci. 72:411–420.
Cuthbertson, G. J. 1980. Genetic variation in feather pecking behaviour. Br. Poult. Sci. 21:447–450.
Duncan, I. J. H., G. S. Slee, E. Seawrite, and J. Breward. 1989. Behavioural consequences of partial beak amputation (beak trimming) in poultry. Br. Poult. Sci. 30:479–488.
Gentle, M. J. 1986. Beak trimming in poultry. Worlds Poult. Sci. J. 42:268–275.
Gentle, M. J., and L. N. Hunter. 1990. Physiological and behav-ioural responses associated with feather removal in Gallus Gallusvardomesticus. Res. Vet. Sci. 50:95–101.
Gentle, M. J., D. Waddington, L. N. Hunter, and R. B. Jones. 1990. Behavioural evidence for persistent pain following par-tial beak amputation in chickens. Appl. Anim. Behav. Sci. 27:149–157.
Harville, D. A. 1990. BLUP (Best Linear Unbiased Prediction) and Beyond. Pages 239–276 in Advances in Statistical Meth-ods for Genetic Improvement of Livestock. D. Gianola, and K. Hammond, ed. Spinger-Verlag, New York, NY.
Hester, P. Y., and M. Shea-Moore. 2003. Beak trimming egg-laying strains of chickens. Worlds Poult. Sci. J. 59:458–474. Hughes, B. O., and I. J. H. Duncan. 1972. The influence of strain
and environmental factors upon feather pecking and canni-balism in fowls. Br. Poult. Sci. 36:525–530.
Jensen, J., and P. Madsen. 1993. A user’s guide to DMU. A package for analyzing multivariate mixed models. National Institute of Animal Science, Tjele, Denmark.
Kjaer, J. B. 2000. Diurnal rhythm of feather pecking behaviour and condition of integument in four strains of loose housed laying hens. Appl. Anim. Behav. Sci. 65:331–347.
Kjaer, J. B., B. M. Hjarvard, K. H. Jensen, J. Hansen-Møller, and O. Naesbye Larsen. 2004. Effects of haloperidol, a dopamine D2 receptor antagonist, on feather pecking behaviour in lay-ing hens. Appl. Anim. Behav. Sci. 86:77–91.
Kjaer, J. B., and P. Sørensen. 2002. Feather pecking and cannibal-ism in free-range laying hens as affected by genotype, level of dietary methionine + cysteine, light intensity during rear-ing and age at access to the range area. Appl. Anim. Behav. Sci. 76:21–39.
Kjaer, J. B., P. Sørensen, and G. Su. 2001. Divergent selection on feather pecking behaviour in laying hens (Gallus gallus domesticus). Appl. Anim. Behav. Sci. 71:229–239.
Korsgaard, I. R., M. S. Lund, D. Sorensen, D. Gianola, P. Madsen, and J. Jensen. 2003. Multivariate Bayesian analysis of Gaussian, right censored Gaussian, ordered categorical and binary traits using Gibbs sampling. Genet. Sel. Evol. 35:159–183.
Mills, A. D., and J. M. Faure. 1990. Panic and hysteria in domestic fowl: A review. Pages 248–272 in Social Stress in Domestic Animals. R. Zayan, and R. Dantzer, ed. Kluwer Academic Publishers, Dordrecht, The Netherlands.
Muir, W. M. 1996. Group selection for adaptation to multiple-hen cages: Selection program and direct responses. Poult. Sci. 75:447–458.
Richter, F. 1954. Experiments to ascertain the cause of feather-eating in the domestic fowl. Pages 258–262 in Proc. of the 10th World’s Poult. Congr., Edinburgh, UK.
Riedstra, B., and T. G. G. Groothuis. 2002. Early feather pecking as a form of social exploration: the effect of group stability on feather pecking and tonic immobility in domestic chicks. Appl. Anim. Behav. Sci. 127–138.
Rodenburg, T. B., A. J. Buitenhuis, B. Ask, K. A. Uitdehaag, P. Koene, J. J. van der Poel, and H. Bovenhuis. 2003. Heritability of feather pecking and open-field response in laying hens at two different ages. Poult. Sci. 82:861–867.
Savory, C. J. 1995. Feather pecking and cannibalism. Worlds Poult. Sci. J. 51:215–219.
Sorensen, D. A., and B. W. Kennedy. 1986. Analysis of selection experiments using mixed model methodology. J. Anim. Sci. 63:245–258.
Sorensen, D., C. S. Wang, J. Jensen, and D. Gianola. 1994. Bayes-ian analysis of genetic change due to selection using Gibbs sampling. Genet. Sel. Evol. 26:333–360.
Tauson, R., and S. A. Svensson. 1980. Influence of plumage condition on the hen’s feed requirement. Swed. J. Agric. Res. 19:35–39.
Tind, E., and T. Ambrosen. 1988. Egg layers in cages. Influence of shape of cage, group size, and area per hen. Report no. 643 (Danish with English summary), National Institute of Animal Science, Research Center Foulum, Tjele, Denmark. Vestergaard, K. S., and L. Lisborg. 1993. A model of feather
pecking development which relates to dustbathing in the fowl. Behaviour 123:291–308.