Multivariate Texture-based Segmentation of Remotely Sensed
Imagery for Extraction of Objects and Their Uncertainty
Arko Lucieer*, Alfred Stein* & Peter Fisher**
* International Institute for Geo-Information Science and Earth Observation (ITC), Department of Earth Observation Science,
P.O. Box 6, 7500 AA Enschede, the Netherlands Telephone: +31 (0)53 4874358, Fax: +31 (0)53 4874335
** University of Leicester, Department of Geography, Leicester, LE1 7RH, United Kingdom
Telephone: +44 (0)116 2523839, Fax: +44 (0)116 252 3854 Email: [email protected]
Keywords: multivariate texture, image segmentation, Local Binary Pattern (LBP) operator, uncertainty
Abstract
(LBP) operator, modeling texture, was integrated into a hierarchical splitting segmentation to identify homogeneous texture regions in an image. We proposed a multivariate extension of the standard univariate LBP operator to describe color texture. The paper is illustrated with two case studies. The first considers an image with a composite of texture regions. The two LBP operators provided good segmentation results on both grey-scale and color textures, depicted by accuracy values of 96% and 98% respectively. The second case study involved segmentation of coastal land cover objects from a multi-spectral Compact Airborne Spectral Imager (CASI) image, of a coastal area in the UK. Segmentation based on the univariate LBP measure provided unsatisfactory segmentation results from a single CASI band (70% accuracy). A multivariate LBP based segmentation of three CASI bands improved segmentation results considerably (77% accuracy). Uncertainty values for object building blocks provided valuable information for identification of object transition zones. We conclude that the (multivariate) LBP texture model in combination with a hierarchical splitting segmentation framework is suitable for identifying objects and for quantifying their uncertainty.
1. Introduction
focused on uncertainty of spectral classification on a pixel-by-pixel basis. As such, it partially ignored potentially useful spatial relations between pixels.
Object-oriented approaches to remotely sensed image processing have become popular with the growing amount of high-resolution satellite and airborne imagery. Segmentation techniques extract spatial objects from an image (Gorte and Stein 1998, Lucieer and Stein 2002). It extends classification, as spatial contiguity is an explicit goal of segmentation whereas it is only implicit in classification. Uncertainty in a segmented or classified image can affect further image processing. In particular, in areas where fuzzy objects or objects with indeterminate boundaries dominate, an indication of segmentation uncertainty is important.
A straightforward approach to identify fuzzy objects is to apply a fuzzy c-means (FCM) classification. This classifier gives membership values of belonging to each class for each pixel. A thematic map can be obtained from this result by labeling the pixels according to the class with the maximum membership value. However, pixel-based classifiers, like the FCM, do not take spatial relations between pixels into account, also known as pattern or texture. We argue that a texture-based segmentation approach (i.e. including the spatial component) can help to identify fuzzy objects. Texture reflects the spatial structure of pixel values and it is therefore indispensable in segmenting an area into sensible geographical units.
Pietikäinen 1999; Pietikäinen et al. 2000). Their Local Binary Pattern (LBP) measure is superior to most of the traditional texture measures in segmentation of texture images (Ojala et al. 1996). LBP is a rotation invariant grey scale texture measure.
The aim of this study is to develop and apply a supervised multivariate texture segmentation technique to identify objects from remotely sensed imagery. It is applied to an image with a texture composition and to an airborne multispectral image of a coastal area in northwest England. It builds on work of Lucieer and Stein (2002) and Lucieer et al. (2004) and further explores the use of multivariate texture. In addition, we focus on quantification of object uncertainty to identify transition zones.
2. Methods
2.1 Texture
Image texture can provide valuable information for identification of objects. The human visual system not only can distinguish objects based on color, but texture plays an important role as well. A major characteristic of texture is the repetition of a pattern or patterns over a region. The pattern may be repeated exactly, or as a set of small variations, possibly as a function of position. There is also a random aspect to texture, because size, shape, color and orientation of pattern elements (sometimes called textons) can vary over a region.
Ojala et al. 2002a). It is a theoretically simple yet efficient approach to grey scale and rotation invariant texture segmentation based on local binary patterns and non-parametric discrimination of sample and reference texture distributions.
2.2 Texture model – the Local Binary Pattern Operator (LBP)
Ojala et al. (2002a) derived the local binary pattern operator (LBP) by defining texture T in a local neighborhood of a grey scale image as the joint distribution of grey levels of P image pixels
0 1
( c, ,..., P )
T =t g g g − (1)
where gccorresponds to the grey-scale value of the center pixel ( pc) of the local neighborhood andgi (i=0,...,P−1) corresponds to the grey-scale value of a pixel in the neighborhood ofpc. In this study, we apply a circle of radius R with P equally spaced pixels that form a circularly symmetric neighborhood set (Ojala et al. 2002a, Lucieer et al. 2004). A circular neighborhood enables a definition of a rotation invariant texture measure.
Invariance with respect to the scaling of pixel values or illumination differences is achieved by considering the signs of the differences instead of their numerical values
*
0 1 1
( ( c), ( c),..., ( P c))
T ≈t sign g −g sign g −g sign g − −g (2)
capture the uniformity of the neighborhood itself. Therefore, they introduced a uniformity measure U to define uniformity in a neighborhood set. U corresponds to the number of spatial transitions or bitwise 0/1 changes in the pattern. WithgP =g0, Uc is defined as
1 1
( ) ( )
P
C i c i c
i
U sign g g sign g− g
=
=
∑
− − − (3)Patterns with Uc ≤ j are designated as uniform. Ojala et al. (2002a) found that for j=2 the best texture model is obtained for texture images. This results in the following operator for grey scale and rotation invariant texture description
1
0 ,
( ) if
1 otherwise
P
i c C
i c j
sign g g U j
LBP P − = ⎧ − ≤ ⎪ = ⎨ ⎪ + ⎩
∑
(4)The LBPc j, operator thresholds the pixels in a circular neighborhood of P equally spaced pixels on a circle of radius R, at the value of the center pixel. It allows for detecting uniform patterns for any quantization of the angular space and for any spatial resolution. Non-uniform patterns are grouped under one label, P+1.
2.3 A measure for texture
1
2
0
( )
P
c i c
i
VAR g µ
−
=
=
∑
− , where1 0 1 P c i i g P µ − =
=
∑
(5),
c j
LBP and VARcvalues are calculated and assigned to each individual image pixel, depicting local texture information. Therefore, two new images are derived from the original image containingLBPc j, and VARc values for each pixel. These images form the basis for the final
texture measure.
Most approaches to texture analysis quantify texture measures by single values (means, variances, entropy, etc.). However, much important information contained in the distributions of feature values might be lost. In this study, the final texture feature is the histogram of the jointLBPc j, and VARc occurrence, computed over an image or a region of an image. The joint distribution of (LBPc j, ,VARc) is approximated by a discrete two-dimensional histogram of size P+2 by b, where P is the number of neighbors in a circular neighborhood and b is the number of bins forVARc. The number of bins used in quantization of the feature space
2.4 Texture similarity
Similarity between different textures is evaluated as a test of goodness-of-fit using a non-parametric statistic, the log-likelihood ratio statistic, also known as the G-statistic (Sokal and Rohlf 1987). The G-statistic compares the bins of a texture sample histogram with a texture model histogram. The G-statistic is defined as
, 1 , 1 1
1 , , , 1 , 1
log log 2
log log
tb tb tb
i i i i
s m i s m i i
tb tb tb
i i i i
i s m s m s m i s m i
f f f f
G
f f f f
= = = = = = ⎛⎡ ⎤ ⎡− ⎛ ⎞ ⎛ ⎞⎤− ⎞ ⎜⎢ ⎥ ⎢ ⎜⎝ ⎟⎠ ⎜⎝ ⎟⎠⎥ ⎟ ⎣ ⎦ ⎣ ⎦ ⎜ ⎟ = ⎜⎡ ⎛ ⎞ ⎛ ⎞⎤ ⎡⎛ ⎞ ⎛ ⎞⎤⎟ ⎜⎢ ⎜ ⎟ ⎜ ⎟⎥ ⎢+ ⎜ ⎟ ⎜ ⎟⎥⎟ ⎜⎣ ⎝ ⎠ ⎝ ⎠⎦ ⎣⎝ ⎠ ⎝ ⎠⎦⎟ ⎝ ⎠
∑∑
∑ ∑
∑
∑ ∑
∑
∑∑
∑∑
(6)where, the sample s is a histogram of the texture measure distribution of an image block, the model m is a histogram of a reference area in the image of a particular texture, tb is the total number of bins and fi is the probability for bin i. By using a nonparametric test we avoid
making any, possibly erroneous, assumptions about the feature distributions. The value of the G-statistic indicates the probability that two sample distributions come from the same population: the higher the value, the lower the probability that the two samples are from the same population. The more alike the histograms are the smaller is the value of G.
Within this constraint, it is impossible to define an optimum size for segmenting the entire image. Therefore, segmenting regions of a fixed block size is inappropriate (Aguado et al. 1998). Alternatively, a top-down hierarchical segmentation process, as discussed in the next section, offers a very suitable framework for segmenting image regions based on texture.
2.5 Texture based image segmentation
Split-and-merge segmentation consists of a region-splitting phase and an agglomerative clustering (merging) phase (Haralick and Shapiro 1985, Horowitz and Pavlidis 1976, Gorte and Stein 1998, Lucieer and Stein 2002, Lucieer et al. 2004). Supervised segmentation uses explicit knowledge about the study area to train the segmentation algorithm on reference textures. Aguado et al. (1998) introduced a segmentation framework with a top-down hierarchical splitting process based on minimizing uncertainty. In this study, we combine the (LBPc j, ,VARc) texture measure and the segmentation framework as suggested by Aguado et al. (1998).
Similar to split-and-merge segmentation each square image block in the image is split into four sub-blocks forming a quadtree structure. The criterion used to determine if an image block is divided is based on a comparison between the uncertainty of the block and the uncertainty of the sub-blocks. The image is segmented such that uncertainty is minimized, where uncertainty is defined as the ratio between the similarity values (G-statistic), computed for an image block B, of the two most likely reference textures (equation 7). The reference textures are histograms of (LBPc j, ,VARc) of characteristic regions in the image. To test for
1
2
B
G U
G
= (7)
where G1 is the lowest G value of all textures (highest similarity) and G2 is the second lowest
G value. Uncertainty is high if G1 and G2 are very similar and UB is close to one. The
subdivision of each image block is based on this uncertainty criterion. An image block is split into four sub-blocks if
1 2 3 4
1
(
)
4
B SB SB SB SB
U
>
U
+
U
+
U
+
U
(8)where the left side of equation 8 defines uncertainty obtained when the sub-blocks are labeled according to the reference class obtained by considering the whole block (B). The right side of equation 8 defines uncertainty if the sub-blocks (SB1, SB2, SB3 and SB4) are labeled by the reference class obtained by the subdivision. Thus, the basic idea is to subdivide an image block only if it is composed of several textures. Additionally, segmentation is always uncertain at the boundaries, because the image block contains a mixture of textures. Accordingly, we subdivide blocks that have at least one neighboring region of a different texture (Aguado et al. 1998). Finally, we obtain a partition of the image. We consider an image object as a collection of contiguous image blocks sharing the same texture label.
distribution of block uncertainty values within an object gives information about uncertainty of the spatial extent of objects. We expect high uncertainty values for the boundary blocks of objects, because of mixed textures and transition zones.
2.7 Texture example
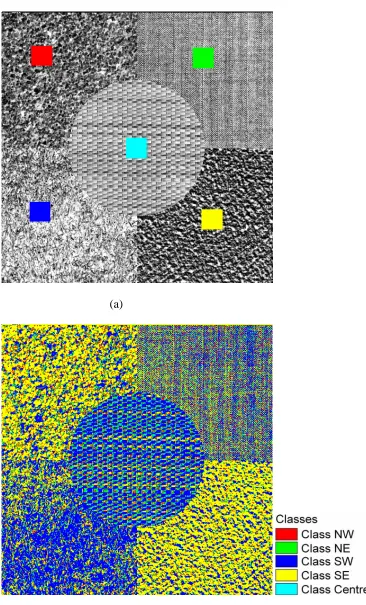
Figure 1(a) shows a composite of five different textures. The image is derived from the Outex framework for testing texture models (Ojala et al. 2002b). These grey-scale textures were labeled with the following class names: class NW (granite), class NE (fabric), class SW (grass), class SE (stone) and class Center (reed mat). Each of these classes is unique in terms of texture. The image shows that the human visual system not only distinguishes image regions based on grey-scale or color, but also on texture, as one can clearly distinguish five homogeneous regions. A pixel-based classifier does not take into account texture or spatial information. Figure 1(b) shows why pixel-based classification techniques might fail. It shows the `defuzzified’ result of a pixel-based FCM classifier. In this case, a supervised fuzzy c-means classification was applied with a Mahalanobis distance measure and an overlap parameter of 2.0 (Bezdek 1981, Zhang 2001). Five regions of 40 by 40 pixels were selected in the centers of the texture regions to train the classifier. Although, the patterns are still visible, no clear spatial partition of classes was obtained. A classification validation provided an overall accuracy of 30.00% and a Kappa coefficient of 0.13.
[FIGURE 1 ABOUT HERE]
distribution. A detailed description of these results can be found in Ojala and Pietikäinen (1999) and Lucieer et al. (2004). Additionally, a supervised approach might prove to be useful as one can guide the segmentation algorithm with reference texture information. Especially in geographical applications, a supervised approach is often feasible, as knowledge about the area might improve segmentation.
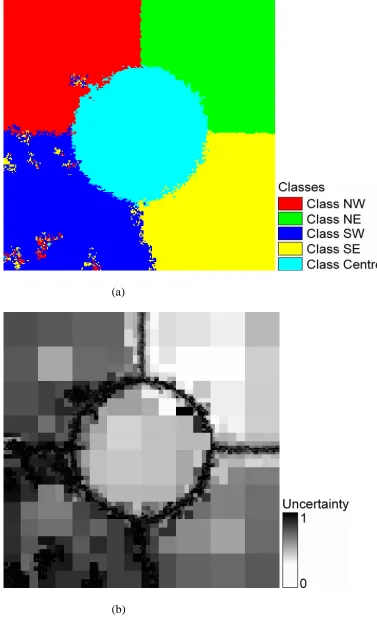
Figure 2 shows a supervised texture-based segmentation of figure 1(a), applying the uncertainty criteria of Aguado et al. (1998). Five references regions of 40 by 40 pixels were selected, corresponding to the five different textures in figure 1(a). Values for P and R were 8 and 1 respectively. An accuracy assessment of the segmentation results provided a very high overall accuracy of 96.20% and a Kappa coefficient of 0.95, showing that good segmentation results can be obtained with the LBP texture measure. Uncertainty values were highest in class SW. This can be explained by the irregularity of this texture, i.e. its pattern is not repetitive and the reference area does not fully represent the whole texture area. In addition, all small blocks at the boundaries of textures show high (>0.9) uncertainty values, because they contain mixtures of different textures.
[FIGURE 2 ABOUT HERE]
2.8 A multivariate texture model
In their psychophysical study Poirson and Wandell (1996) showed that color and pattern information are processed separately by the human visual system. Mojsilovic et al. (2000) extracted color-based information from the luminance and chrominance color components. The achromatic pattern component was utilized as texture pattern information. Another approach was that of Panjwani and Healey (1995) which captured spatial interactions both within and between color bands with Markov random fields (MRFs). More recently, Pietikäinen et al. (2002) showed that the powerful LBP texture measure can also be applied to color images. They processed color information and texture information separately and obtained good classification results for color texture images.
Most research on color texture focused on images of different materials with a clear texture. In standard color images, the pattern in different bands is often highly correlated. This makes it possible to summarize pattern information in a single band and process it separately from color information. In remote sensing images, however, information is recorded from different parts of the spectrum. Therefore, textures in these bands are not necessarily similar. In between band relations should be taken into account when looking at multivariate texture measures for remotely sensed imagery. The LBPc j, texture measure is a robust, rotation invariant and flexible texture measure. An extension to the multivariate case is expected to provide good segmentation results.
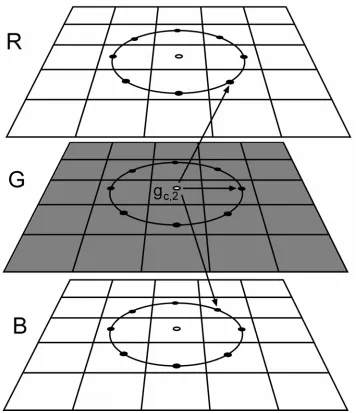
within one band, interactions between bands are considered. Thus, the neighborhood set for a pixel consists of the local neighbors in all three bands (figure 3). The local threshold is taken from these bands, which makes up a total of nine different combinations. This results in the following operator for a local color texture description
1 1 2 1 3 1
1
1 2 2 2 3 2
0
1 3 2 3 3 3
( ) ( ) ( )
( ) ( ) ( )
( ) ( ) ( )
b b b b b b
i c i c i c
P
b b b b b b
c i c i c i c
i
b b b b b b
i c i c i c
sign g g sign g g sign g g
MLBP sign g g sign g g sign g g
sign g g sign g g sign g g
−
=
− + − + − +
= − + − + − +
− + − + −
∑
(9)where b1 is the first band, b2 is the second band, and b3 is the third band. The first part of the equation calculates LBP values for the center pixel of the first band based on relations with the neighbors in the first band and the two other bands. The second part of the equation calculates LBP values for the center pixel of the second band and the third part of equation 9 calculates LBP values for the center pixel of the third band. Each of the three central pixels is, therefore, compared with neighborhood pixels in the other bands. MLBPc is not just a summation of LBPc j, of individual bands, it also models pixel relations between bands. These cross-relations can be important in the distinction of different color textures. A total of nine LBP values is obtained and summed to derive MLBPc. The color texture measure is the histogram of MLBPc occurrence, computed over an image or a region of an image. This single distribution contains P×32bins (e.g.P=8 results in 72 bins).
[FIGURE 3 ABOUT HERE]
c
is quantized into 32 levels by dividing the pixel values on each band by 8, resulting in a three-dimensional histogram with 32 entries. The two histograms of 3 MLBPc and RGB-3D are used to segment a three-band image into objects. In the top-down hierarchical splitting process we calculate MLBPc and RGB-3D histograms for every image block. G-statistic
values are calculated to test for similarity between image block and reference texture histograms. For two MLBPc and RGB-3D histograms, two G-statistic values are obtained.
These values are summed to derive a single similarity measure. Based on this measure, uncertainty values are calculated using equation 7 and texture labels are assigned to image blocks to form objects
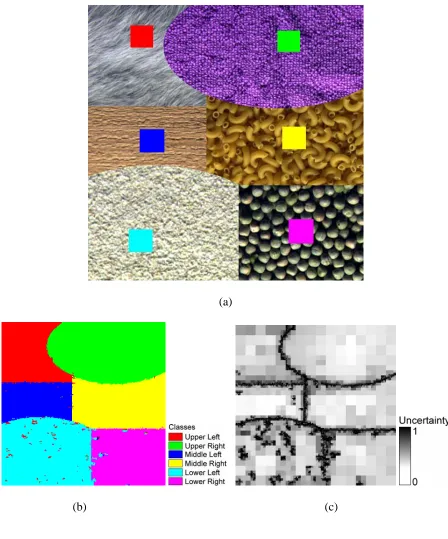
An accuracy assessment of the segmentation result provided an overall accuracy of 98.32% and a Kappa coefficient of 0.98. The confusion matrix with per-texture accuracy percentages is given in table 1. These accuracy values show that good segmentation results can be obtained with the multivariate LBP texture measure.
[FIGURE 4 ABOUT HERE]
[TABLE 1 ABOUT HERE]
3. Case study
3.1 Study area: the Ainsdale Sands
The study area, known as the Ainsdale Sands, is on the coast of Northwest England approximately 25km North of Liverpool. The Ainsdale Sand Dunes National Nature Reserve (NNR) totals 508 ha and forms part of the Sefton Coast. The NNR is within the coastal Special Protection Area. It contains a range of habitats, including intertidal sand flats, embryo dunes, high mobile yellow dunes, fixed vegetated dunes, wet dune slacks, areas of deciduous scrub and a predominantly pine woodland. Management of this area consists of extending the area of open dune habitat through the removal of pine plantation from the seaward edge of the NNR, maintaining and extending the area of fixed open dune by grazing and progressively creating a more diverse structure within the remaining pine plantation with associated benefits for wildlife (Sefton Coast Partnership, 2004).
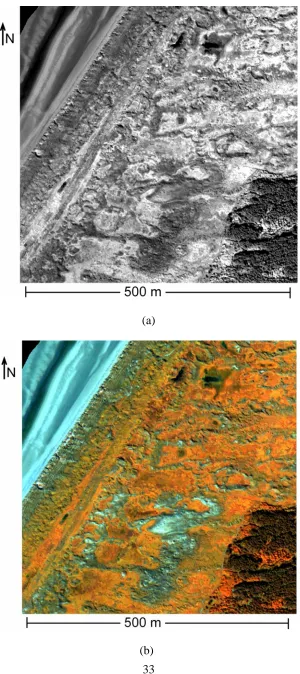
digital surface models (DSM) by LiDAR, and simultaneously, acquired multi-spectral Compact Airborne Spectral Imager (CASI) imagery (one flight each year). The aircraft flew at approximately 800 m above ground level, acquiring 2 m spatial resolution LiDAR scenes and 1 m spatial resolution CASI imagery. In this study, the CASI image of 2001 was used. These images, geometrically corrected by the Environment Agency, were spatial composites of multiple flight strips. The area covered by these images was approximately 6km2.
We applied the univariate segmentation algorithm on the LiDAR DSM to derive general landform classes (Lucieer et al., 2004). An accuracy assessment of the segmentation results provided an overall accuracy of 86%. The results showed that the univariate LBP measure in combination with the hierarchical splitting algorithm can provide a meaningful segmentation of basic land form classes with an indication of object uncertainty. In this study, we focus on segmentation of land cover classes from multispectral CASI imagery.
3.2 Land cover segmentation
Land cover is obtained from spectral information from the CASI image. Four land cover classes can be distinguished: sand, marram grass, willow shrub and woodland. Detailed mapping of these units is required, because knowledge about the location and dynamics of these object types is important for monitoring the rare habitats in this area, as well as, the coastal defense against flooding.
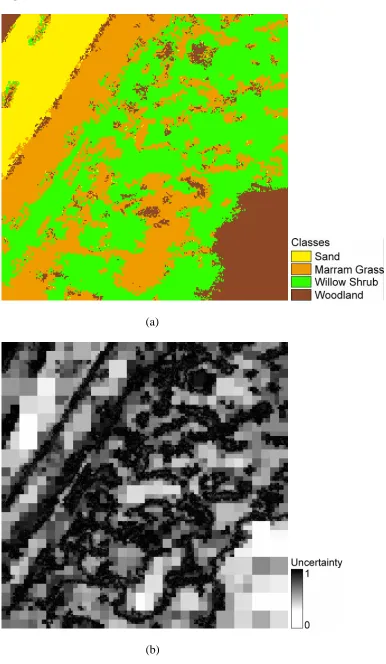
because of large differences in reflectance for different vegetation types. Four reference areas of 40 by 40 pixels were selected to train the algorithm. Values for P and R were 8 and 1 respectively. Figure 6(a) shows a segmentation of band 12 with the (LBPc j, ,VARc) texture measure for four land cover classes. The woodland area in the southeast corner of the image was correctly segmented with uncertainty values between 0.1 and 0.5 (figure 6(b)). The northeastern corner of the image and small objects in the northern part of the image were also segmented as woodland. However, fieldwork showed that no woodland occurred in this area.
[FIGURE 6 ABOUT HERE]
[TABLE 2 ABOUT HERE]
3.3 Multivariate texture-based land cover segmentation
Segmentation using only one CASI band discards valuable information in other bands. A multivariate approach towards texture segmentation might improve segmentation results. The combined MLBPc and RGB-3D texture measure, models texture in three bands. CASI band 1 (440 nm), 8 (650 nm) and 12 (780 nm) explain most of the variance in the image scene and characterize land cover classes well. Figure 5(b) shows a color composite of these three bands. Figure 7 shows a supervised segmentation based on MLBPc and RGB-3D.
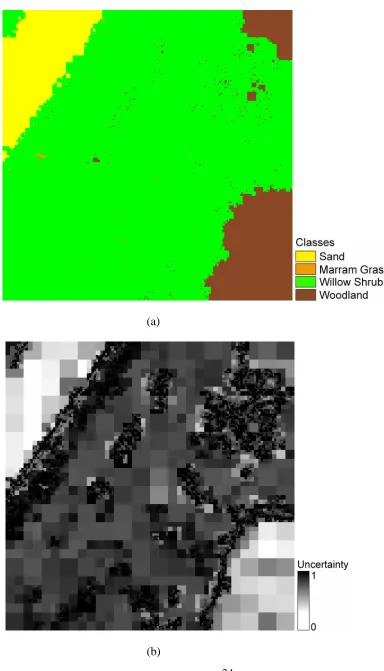
An accuracy assessment of the segmentation results provided an overall accuracy of 77.09 % and a Kappa coefficient of 0.71. The confusion matrix with per-class accuracy percentages is given in table 3. It can be concluded from this confusion matrix that segmentation of marram grass and willow shrub improved considerably compared to segmentation based on one CASI band.
[FIGURE 7 ABOUT HERE]
[TABLE 3 ABOUT HERE]
4. Discussion and conclusions
In this study, a texture-based supervised segmentation algorithm derived labeled objects from remotely sensed imagery. Texture was modeled with the joint distribution of the local binary pattern (LBP) operator and local variance. The segmentation algorithm was based on a hierarchical splitting technique, reducing uncertainty at the level of the image blocks that were obtained. By applying this technique, one does not only obtain a texture-based image segmentation, yet also an indication of uncertainty for all object building blocks. The spatial distribution of uncertainty values provided information about the location and width of transition zones.
bands.
The univariate LBP measure provided good segmentation results for a test case study with a composite image of five different grey-scale textures. An overall accuracy of 96% was obtained. An artificial image with a composition of six color textures was used to demonstrate the use of MLBPc and RGB-3D in segmentation. Good segmentation results were obtained from this complex texture image, depicted by an overall accuracy of 98%.
To illustrate the algorithm for mapping coastal objects, a CASI image of a coastal area on the northwest coast of England was used. Land cover objects derived from band 12 of the CASI image showed high uncertainty values and many incorrectly labeled objects. The overall accuracy was 71%. Additionally, compared to field observations segmentation results were unsatisfactorily. The combination of textural and spectral information from more than one CASI band greatly improved segmentation results. The MLBPc and RGB-3D based segmentation was applied to band 12, 8 and 1 of the CASI image of the study area. Segmentation results improved considerably, depicted by and overall accuracy of 77%. Uncertainty values provided valuable information about transition zones between fuzzy objects.
texture measure might provide valuable results from image classification. The computation of the multivariate LBP measure was limited to three bands. More image bands could be used in the MLBPc and RGB-3D texture model. It would, however, increase complexity and computational demands considerably, whereas extra bands would possibly not add much textural information. For multispectral and hyperspectral images, one could include a preprocessing step to detect the three bands that explain most variance for a specific application
In this study, a uniformity measure is defined for the univariate LBP measure. It depicts uniformity of pixel values in a neighborhood set. Ojala et al. (2002) showed that more than 90% of the patterns in a texture image are uniform. In remote sensing images, however, also non-uniform patterns occur. Some of these non-uniform patterns might be characteristic for a certain land cover class. An extension of the uniformity measure to the multivariate case might provide more information on pattern uniformity in remotely sensed imagery. A multivariate uniformity measure could be calculated by summation of uniformity in each band or by combining the uniformity measure for each of the nine components in the multivariate LBP measure (equation 9). We will assess the effect of a multivariate uniformity measure on segmentation of multispectral remote sensing imagery in future research.
neighborhood sets on the segmentation result will be assessed.
References
AGUADO, A.S., MONTIEL, E., AND NIXON, M.S., 1998, Fuzzy image segmentation via texture density histograms. EU project Nr. ENV4-CT96-0305 - Fuzzy Land Information from Environmental Remote Sensing (FLIERS) Final Report, 1998.
BEZDEK, J., 1981, Pattern Recognition with Fuzzy Objective Function Algorithms (Plenum Press, New York).
CANTERS, F., 1997, Evaluating the uncertainty of area estimates derived from fuzzy land cover classification. Photogrammetric Engineering & Remote Sensing, 63, 403-414.
CHENG, T., FISHER, P.F., AND ROGERS, P., 2002, Fuzziness in multi-scale fuzzy assignment of duneness. Accuracy 2002 - International Symposium On Spatial Accuracy Assessment in Natural Resources and Environmental Sciences, pp.154-159.
CHENG, T. AND MOLENAAR, M., 2001, Formalizing fuzzy objects from uncertain classification results. International Journal of Geographical Information Science, 15, 27-42. FISHER, P.F., 1999, Models of Uncertainty in Spatial Data, In Geographical Information Systems, second edition (Wiley & Sons, New York), pp. 191-205.
FISHER, P., CHENG, T. AND WOOD, J., 2004, Where is Helvellyn? Multiscale morphometry and the mountains of the English lake district, Transactions of the Institute of British Geographers, 29, 106–128.
FOODY, G. M., 1996, Approaches for the production and evaluation of fuzzy land cover classifications from remotely sensed data. International Journal of Remote Sensing, 17, 1317-1340.
GORTE, B. H. H. AND STEIN, A., 1998, Bayesian classification and class area estimation of satellite images using stratification. IEEE Transactions on Geosciences and Remote Sensing, 36, 803–812.
HARALICK, R.M., SHANMUGAM, K., AND DINSTEIN, I., 1973, Textural features for image classification. IEEE Transactions on Systems, Man and Cybernetics, 2, 610-621. HARALICK, R.M. AND SHAPIRO, L.G., 1985, Image segmentation techniques. Computer Vision, Graphics and Image Processing, 29, 100-132.
HOOTSMANS, R.M., 1996, Fuzzy Sets and Series analysis for Visual Decision Support in Spatial Data Exploration. PhD thesis, Utrecht University.
HOROWITZ, S.L. AND PAVLIDIS, T., 1976, Picture segmentation by a tree traversal algorithm. Journal of the Association for Computing Machinery, 23, 368-388.
LUCIEER, A. AND STEIN, A., 2002, Existential uncertainty of spatial objects segmented from remotely sensed imagery. IEEE Transactions on Geoscience and Remote Sensing, 40, 2518- 2521.
LUCIEER, A., FISHER, P. AND STEIN, A., 2004, GeoDynamics (CRC Press LLC), chapter Texture-based Segmentation of Remotely Sensed Imagery to Identify Fuzzy Coastal Objects. MOJSILOVIC, A., KOVACEVIC, J., HU, J., SAFRANEK, R. AND GANAPATHY, S., 2000, Matching and retrieval based on the vocabulary and grammar of color patterns, IEEE Transactions on Image Processing, 9, 38–54.
NIXON, M.S. AND AGUADO, A.S., 2002, Feature extraction & image processing (Butterworth-Heinemann).
PANJWANI, D. AND HEALEY, G., 1995, Markov random field models for unsupervised segmentation of textured color images, IEEE Transactions on Pattern Analysis and Machine Intelligence, 17, 939–954.
with color histograms and local binary patterns, Proceedings of the Second International Workshop on Texture Analysis and Synthesis, Copenhagen, Denmark, 109–112.
POIRSON, B. AND WANDELL, B., 1996, Pattern-color separable pathways predict sensitivity to simple colored patterns, Vision Research 36, 515–526.
OJALA, T., PIETIKÄINEN M. AND HARWOOD, D., 1996, A comparative study of texture measures with classification based on feature distributions. Pattern Recognition, 29, 51-59. OJALA, T. AND PIETIKÄINEN, M., 1999, Unsupervised texture segmentation using feature distributions. Pattern Recognition, 32, 477-486.
OJALA T., PIETIKÄINEN M., AND MÄENPÄÄ, T., 2002a, Multiresolution gray-scale and rotation invariant texture classification with local binary patterns. IEEE Transactions on Pattern Analysis and Machine Intelligence, 24, 971-987.
OJALA, T., MÄENPÄÄ, T., PIETIKÄINEN, M., VIERTOLA, J., KYLLÖNEN, J. AND HUOVINEN, S., 2002b, Outex - New framework for empirical evaluation of texture analysis algorithms. 16th International Conference on Pattern Recognition, Quebec, Canada, 1:701-706. URL: http://www.outex.oulu.fi
PIETIKÄINEN M., OJALA T., AND XU, Z., 2000, Rotation-invariant texture classification using feature distributions. Pattern Recognition, 33, 43-52.
RANDEN, T. AND HUSØY, J.H., 1999, Filtering for Texture Classification: A Comparative Study. IEEE Transactions on Pattern Analysis and Machine Intelligence, 21, 291-310.
SEFTEN COAST PARTNERSHIP, 2004, Sefton coast partnership — nature conservation, URL: http://www.seftoncoast.org.uk
SOKAL, R.R. AND ROHLF, F.J., 1987, Introduction to Biostatistics, second edition (W.H. Freeman and Co, New York).
Tables
Table 1. Confusion matrix with accuracy values (%) of a multivariate texture-based segmentation. Overall accuracy was 98.32% and the Kappa coefficient was 0.98.
Table 2. Confusion matrix with per-class accuracy values (%) of a univariate texture-based segmentation of band 12 of the CASI image. Overall accuracy was 70.53% and the Kappa coefficient was 0.61.
Table 3. Confusion matrix with per-class accuracy values (%) of a (multivariate) texture-based segmentation of bands 12, 8 and 1 of the CASI image. Overall accuracy was 77.09% and the Kappa coefficient was 0.71.
Table 1
Reference
Class UL UR ML MR LL LR Total
UL 99.93 0.56 1.31 0.26 1.91 0.38 12.72 UR 0.02 99.41 0.03 1.59 0.02 0.02 24.11 ML 0.05 0.00 98.09 0.05 0.12 0.21 9.62 MR 0.00 0.02 0.02 97.82 0.02 0.09 16.44
LL 0.00 0.01 0.55 0.10 97.68 2.30 21.77
LR 0.00 0.00 0.00 0.16 0.26 97.00 15.35
Total 100.00 100.00 100.00 100.00 100.00 100.00 100.00
Table 2
Reference
Class Sand Marram Grass Willow Shrub Woodland Total
Sand 100.00 0.00 0.00 0.00 26.42
Marram Grass 0.00 0.00 0.22 0.00 0.06
Willow Shrub 0.00 98.94 99.78 0.00 41.99
Woodland 0.00 1.06 0.00 100.00 31.54
Total 100.00 100.00 100.00 100.00 100.00
Table 3
Reference
Class Sand Marram Grass Willow Shrub Woodland Total
Sand 100.00 0.00 2.38 0.00 26.96
Marram Grass 0.00 96.92 20.29 0.00 20.98
Willow Shrub 0.00 2.11 64.77 0.00 17.34
Woodland 0.00 0.97 12.55 100.00 34.73
Figure Captions
Figure 1. Texture image composition: (a) artificial composition of five different natural textures with five reference areas (Ojala et al. 2002b); (b) result of a pixel-based classifier. Figure 2. Supervised texture-based segmentation: (a) segmentation based on the joint LBPc j,
and VARc distribution with five reference classes; (b) related uncertainty for all object building blocks.
Figure 3. The neighborhood set for the multivariate (three band) LBP texture measure describes spatial pixel relations within a band and between bands.
Figure 4. Segmentation of color texture image: (a) artificial composition of five different color textures (Ojala et al. 2002b); (b) supervised texture-based segmentation based on the multivariateMLBPc distribution and RGB-3D color histogram with five reference classes; (c)
related uncertainty for all object building blocks.
Figure 5. CASI image of the Ainsdale sands study area, UK: (a) band 12; (b) color composite of band 12, 8 and 1 (RGB).
Figure 6. Segmentation of land cover from CASI image: (a) supervised texture-based segmentation of band 12 (NIR) of the CASI image with four reference land cover classes, based on the joint univariateLBPc j, and VARc distribution; (b) related uncertainty for all object building blocks.
Figures
Figure 1
(a)
Figure 2
(a)
Figure 4
(a)
Figure 5
(a)
Figure 6
(a)
Figure 7
(a)