Informing the development of tsunami vertical evacuation strategies in New Zealand : a thesis presented in fulfilment of the requirements for the degree of Doctor of Philosophy in Emergency Management at Massey University, Wellington, New Zealand
91
0
0
Full text
(2) BIBLIOGRAPHIC REFERENCE Fraser, S.; Leonard, G.S.; Matsuo, I. and Murakami, H. 2012. Tsunami evacuation: Lessons from the Great East Japan earthquake and tsunami of March 11th 2011, GNS Science Report 2012/17. 89 p.. S. Fraser, GNS Science/Massey University Joint Centre for Disaster Research, PO Box 756, Wellington, New Zealand G.S. Leonard, GNS Science, PO Box 30368, Lower Hutt I.. Matsuo, Crisis and Environment Management 1-22-505 Wakaba, Shinjyuku-ku, Tokyo 160-0011, Japan.. Policy. Institute. (CeMI),. H Murakami, Division of Environmental Science and Engineering, Yamaguchi University, Tokiwadai, Ube 755-8611, Japan.. © Institute of Geological and Nuclear Sciences Limited, 2012 ISSN 1177-2425 ISBN 978-0-478-19897-3. i.
(3) 2012. CONTENTS ABSTRACT............................................................................................................................VII KEYWORDS .........................................................................................................................VIII 1.0. INTRODUCTION .......................................................................................................... 1 1.1 1.2 1.3 1.4. 1.5. 2.0. INTERVIEW OUTCOMES .......................................................................................... 13 2.1 2.2 2.3 2.4 2.5. 2.6 2.7. 3.0. Background to the event ................................................................................... 1 Goals, methodology and report structure ......................................................... 3 Interviews .......................................................................................................... 4 Tsunami preparedness in the Tǀhoku region of Japan .................................... 6 1.4.1 Previous events and hazard estimation ................................................ 6 1.4.2 Hazard estimation and mapping ........................................................... 6 1.4.3 Education and evacuation exercises .................................................... 7 1.4.4 Earthquake early warning system and rapid official tsunami warnings . 7 1.4.5 Coastal defences .................................................................................. 8 Tsunami preparedness in the State of Washington and New Zealand ............. 8 1.5.1 Washington ........................................................................................... 8 1.5.2 New Zealand ....................................................................................... 11 Community involvement in evacuation planning and preparedness ............... 13 Hazard/evacuation maps and signs ................................................................ 14 2.2.1 Hazard/evacuation maps .................................................................... 14 2.2.2 Hazard/evacuation signs ..................................................................... 20 Response to natural and informal tsunami warnings ...................................... 25 2.3.1 Natural warnings ................................................................................. 25 2.3.2 Informal warnings ................................................................................ 27 Formal warning messages and systems ........................................................ 28 2.4.1 Warning messages ............................................................................. 28 2.4.2 Warning systems ................................................................................ 29 Movements during and after evacuation ......................................................... 30 2.5.1 Delayed evacuation or non-evacuation ............................................... 30 2.5.2 Use of motor vehicles during evacuation ............................................ 32 2.5.3 Use of boats during evacuation .......................................................... 34 2.5.4 Schools evacuation ............................................................................. 34 2.5.5 Necessary relocation from evacuation refuges ................................... 35 2.5.6 Leaving evacuation refuges too early ................................................. 35 Impacts of coastal defence on warning response and evacuation ................. 36 Vertical evacuation buildings .......................................................................... 37 2.7.1 Building specification and levels of damage ....................................... 38 2.7.2 Observed examples of vertical evacuation buildings .......................... 38 2.7.3 Community engagement ..................................................................... 51 2.7.4 Evacuation building signage ............................................................... 51 2.7.5 Owner agreement ............................................................................... 52 2.7.6 24-hour access ................................................................................... 52 2.7.7 Evacuee Welfare ................................................................................. 53. RECOMMENDATIONS .............................................................................................. 54 3.1 3.2 3.3 3.4. Community involvement in evacuation planning and preparedness ............... 54 Hazard/evacuation maps and signs ................................................................ 54 3.2.1 Maps ................................................................................................... 54 3.2.2 Hazard/evacuation signs ..................................................................... 55 Response to natural and informal tsunami warnings ...................................... 55 Formal warning messages and systems ........................................................ 56 3.4.1 Warning messages ............................................................................. 56 3.4.2 Warning systems ................................................................................ 57. GNS Science Report 2012/17. ii.
(4) 2012. 3.5. 3.6 3.7. 3.8. Movements during and after evacuation ......................................................... 57 3.5.1 Delayed evacuation or non-evacuation ............................................... 57 3.5.2 Use of motor vehicles during evacuation ............................................ 57 3.5.3 Use of boats during evacuation .......................................................... 58 3.5.4 Schools evacuation ............................................................................. 58 3.5.5 Necessary relocation from evacuation refuges ................................... 59 3.5.6 Leaving evacuation refuges too early ................................................. 59 Impacts of coastal defence on warning response and evacuation ................. 59 Vertical evacuation buildings .......................................................................... 60 3.7.1 Building specification and levels of damage ....................................... 60 3.7.2 Community engagement ..................................................................... 60 3.7.3 Evacuation building signage ............................................................... 61 3.7.4 Owner agreement ............................................................................... 61 3.7.5 24-hour access ................................................................................... 61 3.7.6 Evacuee welfare ................................................................................. 61 Additional recommendations from observations and interviews ..................... 62. 4.0. ACKNOWLEDGEMENTS .......................................................................................... 62. 5.0. REFERENCES ........................................................................................................... 62. FIGURES Figure 1. Figure 2 Figure 3 Figure 4 Figure 5 Figure 6 Figure 7 Figure 8. Figure 9 Figure 10 Figure 11 Figure 12 Figure 13 Figure 14 Figure 15 Figure 16 Figure 17. Map of locations investigated in this report, with coastal topography and epicentre of March 11th main shock indicated. Note the grey lines delineate prefectures. All of the locations investigated lie within Iwate and Miyagi prefectures (labelled), which received the largest tsunami wave heights and most of the casualties. Base map credits: GEBCO, NOAA, National Geographic, DeLorme, Esri.................................................................................................. 5 Excerpt from the tsunami evacuation map Clallam Bay, Clallam County, Washington. This map uses 2 zones, local sites of importance (fire department, etc.), evacuation routes and assembly areas (Clallam County Emergency Management, n d). ................................................... 10 An example evacuation map in Washington. This map is for Long Beach and Ilwaco, Pacific County, and illustrates the use of 3 zones, evacuation routes and assembly areas (Pacific County Emergency Management, 2007).......................................................................................... 10 ‘Tsunami Hazard Zone’ sign with instructions to evacuate to high ground or inland in response to an earthquake. ............................................................................................................. 11 ‘Tsunami Evacuation Route’ sign with arrow depicting the direction of evacuation. These signs are placed regularly along roads in tsunami hazard zones. .................................................... 11 An example tsunami hazard map from Whananaki, New Zealand. .................................................. 12 An example tsunami evacuation map and information board as displayed outdoors (1.2 m wide) in the Island Bay community, Wellington, New Zealand. ........................................................ 12 Extract from Tarǀ tsunami hazard map, indicating three sections of tsunami wall (red (1958 section), black and yellow thick lines), tsunami gates (blue triangles and circles). The inundation extent of the 1986 Meiji (thin red line) and 1933 Shǀwa tsunami (thin blue line). Evacuation refuges are marked as red triangles and welfare centres as red circles. Source: Tarǀ Town Disaster Prevention Office. ............................................................................................16 Kamaishi City evacuation map (Source: Kamaishi City Disaster Prevention Office). ....................... 16 ƿfunato City evacuation map (Source: ƿfunato City Disaster Management). ................................. 17 Excerpt from Kesennuma City evacuation map (Source: Kesennuma General Affairs Department). .................................................................................................................................... 18 Minami-Sanriku hazard map with evacuation refuge locations indicated by numbered red circles (Miyagi Prefectural Government, 2004). ...............................................................................19 Excerpt from the Ishinomaki tsunami hazard map with evacuation refuges (Ishinomaki City, n d). .................................................................................................................................................. 19 Natori City hazard map (Source: Natori City Disaster Prevention Office)......................................... 20 A sign displayed above the road indicating to drivers that they are entering an estimated tsunami inundation area. These signs were seen on roads within Kamaishi district. ....................... 20 A sign displayed above the road indicating to drivers that they are exiting an estimated tsunami inundation area. These signs were seen on roads within Kamaishi district. ....................... 20 Tsunami evacuation route direction and distance sign displayed on a sign in Hitachihamacho, Miyako City. .......................................................................................................... 21. GNS Science Report 2012/17. iii.
(5) 2012. Figure 18 Figure 19 Figure 20 Figure 21 Figure 22 Figure 23 Figure 24 Figure 25 Figure 26 Figure 27 Figure 28. Figure 29 Figure 30 Figure 31 Figure 32 Figure 33 Figure 34 Figure 35 Figure 36 Figure 37 Figure 38 Figure 39 Figure 40 Figure 41 Figure 42 Figure 43 Figure 44 Figure 45. Figure 46 Figure 47 Figure 48. Tsunami evacuation route direction and distance sign displayed on a lamp-post in Hitachihamacho, Miyako City. .......................................................................................................... 21 Tsunami evacuation route information board and directions (with distance to safe location) in Matsushima Town, Miyagi Prefecture. ............................................................................................. 21 Tsunami evacuation route sign with direction and distance to safe location painted on the pavement in Matsushima Town, Miyagi Prefecture. ......................................................................... 21 A sign in Matsushima Town, displaying the tsunami evacuation route. ........................................... 22 Tsunami evacuation route sign with solar powered lamp, on a road leading to high ground out of Tarǀ Town. ............................................................................................................................. 22 Evacuation route sign in ƿfunato City, indicating the distance to a “tsunami emergency place of refuge”. Photo courtesy of EEFIT. ................................................................................................ 22 A sign in the centre of Matsushima Town, advising evacuation on experiencing an earthquake. ...................................................................................................................................... 23 A sign indicating tsunami hazard, on a road out of Kamaishi City. Translation reads: “Tsunami Attention! Tsunami inundation hazard zone”. ................................................................... 23 Tsunami evacuation muster point for children in Hitachihamacho, Miyako City. .............................. 23 Close-up view of tsunami evacuation muster point for children in Hitachihamacho, Miyako City. Translation reads: “Tsunami shelter (Kuwagasaki elementary school)”. .................................. 23 A marker post indicating past inundation height in central Minami-Sanriku Town. The Japanese text gives notification that the Shizugawa hospital is a designated vertical evacuation building. The Japanese text informs people to evacuate to designated evacuation places such as parks, highlands, and Shizugawa elementary school and Shizugawa hospital. ......................................................................................................................... 24 A marker post indicating past inundation height in central Minami-Sanriku Town. This marker was found close to a care home (1 km inland), and displays the standard icon representing evacuation to high ground. ............................................................................................................... 24 Tsunami height marker on a building wall in ƿfunato City, indicating the maximum inundation height at this point during the Chile tsunami on May 24th 1960. Photograph courtesy of EEFIT. ........................................................................................................................... 24 Landslide hazard and evacuation map on an information board in Ishinomaki City. ........................ 25 A wireless receiver shown by civil protection officials in Minami-Sanriku. These units are rented by the local government to every household in the town, and resulted in effective warning dissemination on March 11th 2011. ..................................................................................... 30 Building damage and fatality rate for seven areas of Yuriage, Natori City. Source: (Murakami and Kashiwabara, 2011). ................................................................................................................. 32 Designated evacuation locations in Kamaishi City. An estimated 50 people evacuated to this apartment block (A) and government offices (B). The entire area shown was inundated; inundation depth was 8 m in the vicinity of building (A). ................................................................... 39 Apartment block in Kamaishi City, which was inundated to the 3rd storey........................................ 39 Government offices in Kamaishi City. This building is raised several metres above sea level st and sustained damage to only the 1 storey windows ..................................................................... 39 rd The Hotel Horaikan at Unosumai, Kamaishi City, with official signage displayed at the 3 nd floor and very little external damage. The hotel was inundated to the ceiling of the 2 storey ........ 40 Locations of 5 designated vertical evacuation location visited in the downtown area of ƿfunato City: (A) Plaza Hotel; (B) Yasuka office/apartment buildings; (C) Maiya Shopping Centre and car park. ........................................................................................................................ 40 rd Maiya shopping centre, which was inundated to the 3 storey ........................................................ 41 Maiya multi-storey car park showing damaged railing at the 2nd storey. .......................................... 41 Yasuka private commercial and apartment block number 1 shows very little exterior damage. ........................................................................................................................................... 41 Yasuka private commercial and apartment block number 2 is adjacent to block number 1 and was being refurbished at the time of our visit ............................................................................41 The Plaza Hotel, which was being refurbished at the time of our visit.............................................. 41 External stairs giving access to the 4th storey of the Plaza Hotel ..................................................... 41 Locations of designated tsunami evacuation buildings in Kesennuma City (Data from Kesennuma City General Affairs Department). (A) Office building; (B) Yoyoi food factory; (C) Shoe store; (D) Elderly welfare centre; (E) Tourist Pier and fish market; (F) Prefectural Office; (G) National government office; (H) Central Community Centre; (I) Kahoku Newspaper office ............................................................................................................................. 42 An office building in the inner harbour was unused on March 11th. This building sustained debris damage to the external stairs (front right) which face the harbour. Minor scour occurred along the seaward face of the building, and around the base of the external stairs. ......... 43 The Yoyoi food factory, where 400 people took refuge. Inundation height was around 8 m here. ................................................................................................................................................. 43 An elderly persons’ welfare centre which was inundated to around 8 m height. Scour up to 2 m deep occurred on the near side of the building in this photograph. Extensive damage occurred immediately inland of this building, while 80 survived on the upper floors. ....................... 43. GNS Science Report 2012/17. iv.
(6) 2012. Figure 49 Figure 50 Figure 51 Figure 52 Figure 53 Figure 54. Figure 55. Figure 56 Figure 57 Figure 58 Figure 59 Figure 60 Figure 61 Figure 62 Figure 63. Figure 64 Figure 65 Figure 66 Figure 67 Figure 68 Figure 69. The large open car park roof space above the fish market provided refuge to 1000 people. This structure is at the harbour front and inundation almost reached roof level. The open steel structure enabled tsunami flow at the 1st storey. ..................................................................... 44 The Prefectural Government offices suffered extensive scour and heavy in inundation of 8 m. This building was constructed after 2004 and displays tsunami vertical evacuation signage at roof level. 200 people survived the tsunami in this building ............................................ 44 The National Government office, where 120 people took refuge from the tsunami. This building is adjacent to the Prefectural Government offices and was left undamaged when light steel structures were washed into it. The lower two storeys were inundated. .......................... 44 Kesennuma central community centre, where 450 people took refuge when they evacuated nearby buildings ............................................................................................................................... 45 The Kahoku Newspaper offices were inundated to at least the ceiling of the 1st storey. 71 people took refuge here. .................................................................................................................. 45 Locations of designated tsunami evacuation buildings in Minami-Sanriku Town: (A) Matsubara apartments; (B) Takano Kaikan building; (C) Shizugawa Hospital; (D) Fisheries Co-operative. Significant scour can be seen where seawater is encroaching around building (A) and to the east of building (D). ................................................................................................... 46 Matsubara apartment block viewed from the seaward side with waterborne debris to the 4th storey. The low seawall has been destroyed in the tsunami return flow and was sheltered in part by the apartment building. The foundations of this building are exposed above the water level due to extensive scour. ............................................................................................................ 46 The Takano Kaikan building 160 m inland of the Matsubara apartment block. Little damage aside from glazing was observed here, despite heavy damage and collapse of RC buildings immediately seaward. ...................................................................................................................... 47 Shizugawa Hospital (west building) – the taller of the 2 hospital buildings at 5-storeys, this section suffered less debris damage than the east building. ............................................................ 47 Shizugawa Hospital (east building) viewed from the seaward side which suffered debris damage at the 1st and 2nd storeys. ................................................................................................... 47 Minami-Sanriku fisheries co-operative building which was overtopped on March 11th. Image credit: Google Streetview, August 2011. .......................................................................................... 47 York Benimaru shopping centre, Minato-machi, Ishinomaki City. The rooftop car parking area is accessible by vehicle ramp and was successfully used for vertical evacuation on March 11th. ....................................................................................................................................... 48 The Homac hardware store is a single storey building with car parking on the roof, which is accessible by vehicle ramp. Image credit: Google Streetview, August 2011 ................................... 48 The Hotaru funeral facility. This is an unlikely vertical evacuation facility given the lack of th obvious roof space or external access, but successfully provided refuge on March 11 . ................ 49 Kadonowaki Elementary School was damaged by fire while inundated during the tsunami. People who had sought refuge hear were able to leave the building and evacuate further uphill at the rear of the school. This building is a typical school structure in Japan; these buildings are commonly used as evacuation or emergency welfare centres.................................... 49 Locations of designated evacuation buildings in Yuriage, Natori City: (A) Yuriage Junior High School; (B) Yuriage Elementary School; (C) Yuriage Community Centre. Sendai International airport is to the south of the area shown here. ............................................................ 50 nd The Yuriage Community Centre was inundated to the 2 storey but 43 people survived in the building. ...................................................................................................................................... 50 rd Yuriage Elementary School. 870 people took refuge here, where the large roof area and 3 rd storey were above inundation. Direct external access to the 3 storey is available from the stairs shown here. ............................................................................................................................ 50 Yuriage Junior High School is constructed on ground which is raised 1.8 m above the surrounding fields. This helped to mitigate damage from the tsunami flow and only contents damage was observed (EEFIT, 2011). 823 people took refuge here. .............................................. 51 Official vertical evacuation signage, as photographed on the apartment block in Kamaishi. ........... 52 Sign indicating the entrance to external stairways at the apartment block in Kamaishi (Translation: “Evacuation building entrance (stairways)”.................................................................. 52. GNS Science Report 2012/17. v.
(7) 2012. TABLES Table 1 Table 2. Table 3. Table 4 Table 5. Human perception and indoor/outdoor effects at JMA intensity 5 Lower to 6 Upper. Extract from Japanese Meteorological Agency (2011b). ................................................................................ 2 Correspondence between JMA instrumental intensity and Modified Mercalli intensity (after Kunugi, 2000). IJMA is JMA instrumental intensity (‘L’ denotes Lower, ‘U’ denotes Upper). IMM is instrumental Modified Mercalli. IMM1 is Modified Mercalli intensity, which corresponds to the same values for New Zealand MMI scale of Dowrick (1996). Thresholds are determined according to the comparison of the description of the intensity at each level. ........... 2 Casualty statistics at locations investigated in this report. JMA intensity source: Japanese Meteorological Agency, 2011c. Total population source: Statistics Bureau, 2010. Casualty statistics source: Fire and Disaster Management Agency of Japan, 2012 (except Tarǀ Town – from Ichiro Matsuo, personal communication). These figures do not account for daily movement of population and fatality rate may have been affected by daily commuting patterns (after EEFIT, 2011) .............................................................................................................. 3 Specifications of tsunami warning/advisory issued by JMA (Source: Japanese Meteorological Agency, 2006). ........................................................................................................... 8 Time sequence of JMA tsunami warnings from March 11th to 13th, indicating the change in estimated tsunami height for Iwate and Miyagi Prefectures. Between warning #3 and #10, the major tsunami warning remained in place for these prefectures (Source: Japanese Meteorological Agency, 2011e). ....................................................................................................... 29. APPENDICES Appendix 1 Appendix 2 Appendix 3 Appendix 4. Interview questions (Original English version) ................................................................................. 68 Interview questions (Japanese translation) ...................................................................................... 70 Summary of key points mentioned in interviews .............................................................................. 74 Summary of vertical evacuation buildings in locations visited .......................................................... 78. GNS Science Report 2012/17. vi.
(8) 2012. ABSTRACT The Great East Japan moment magnitude (Mw) 9.0 earthquake occurred at 14:46 (Japanese Standard Time) on March 11th 2011. Significant seabed displacement generated the subsequent tsunami, which caused significant damage in Iwate, Miyagi, Fukushima and Ibaraki Prefectures. As a result of this event over 19,000 people are dead or missing, with over 295,000 collapsed buildings along 600 km of affected coastline. Reconnaissance-level analysis of evacuation preparedness and actions related to the tsunami has been carried out using semi-structured interviews with local disaster prevention officials and emergency services officials. Interviews were carried out in Tarǀ Town, Kamaishi City, ƿfunato City (Iwate Prefecture) and Kesennuma City, Minami-Sanriku Town, Ishinomaki City and Natori City (Miyagi Prefecture). The interviews covered tsunami awareness, observations and response to natural and informal warnings; style and derivation of evacuation maps; official warning timing and dynamics; evacuation timing, mechanisms and issues; and vertical evacuation buildings – availability, designation, public awareness, utilisation, relationship to maps, and post-event review. The report also presents examples of hazard and evacuation maps and signs employed in the Tǀhoku region. Experiences in Tǀhoku during this event are relevant to tsunami mitigation activities in the State of Washington and in New Zealand, which co-funded this research. These areas have local earthquake and tsunami risk posed by the Cascadia Subduction Zone and the offshore Hikurangi subduction margin, respectively. This report provides recommendations for further development of tsunami mitigation activities in these areas, based on findings from the interviews. Overall there was a 96% survival rate of those living in the inundated area of the municipalities visited. This can be attributed to mostly effective education and evacuation procedures. Schools education, hazard maps and exercises appear to be the most common forms of education. Community involvement in planning of evacuation maps, routes and buildings is common, with many places conducting regular community-level exercises. Hazard and evacuation maps lacked consistency and both maps and safe locations were generally designed for a tsunami height that under-represented the worst case scenario. The natural warning of long ground shaking (reported as more than two minutes, and often more than three) was widely agreed as enough by itself to have triggered evacuation. Sea walls reduced effective observation of the natural warning of unusual ocean behaviour in many places, and fostered a false sense of security in some locations. Although an early warning system is often seen publicly as key infrastructure in enhancing tsunami resilience, the expectation of official warnings (and their content) may have slowed the time taken for people to initiate evacuation in Tǀhoku, compared to if there had been total reliance on natural warnings. Exposure to previous false ‘major tsunami’ warnings apparently led to complacency in this event, despite this earthquake feeling much larger than anything previously experienced. The philosophy of tsunami tendenko was shown to be a positive education tool which promoted immediate self-evacuation and save many lives. Peoples’ movements during and after evacuation reveal that many people died unnecessarily due to delayed evacuation or non-evacuation as a result of social or parental responsibility, lack of education or scepticism of warnings. Widespread use of motor vehicles caused traffic. GNS Science Report 2012/17. vii.
(9) 2012. congestion in some areas, when walking, running or cycling would have been much more effective and saved lives. Many people returned to the evacuation zone too early in some places because they had not seen the wave arrive at the expected time given in official warnings, or because they expected no more waves to arrive. It is critical that people have the awareness that the first wave may come later than estimated by rapid scientific analysis, and the largest wave may not be the first. The evacuation strategy in place at March 11th 2011 was appropriate in that it sent people to safe locations, used maps and community involvement and was regularly exercised in many places. Some evacuation centres were not located far enough inland or on high enough ground because they were not designated using the worst-case tsunami inundation. There was extensive effective use of both designated and informal vertical evacuation buildings. The most important considerations for effective use are sufficient height (in relation to expected inundation depth), reinforced concrete construction, community engagement, owner agreement, signage, 24-hour access and evacuee welfare. More than one building owner considered use of their building in evacuation as corporate social responsibility. To enhance evacuee safety it is prudent to minimise the opportunities for spilled accelerants such as oil, and debris such as logs in tsunami-prone locations.. KEYWORDS Great East Japan earthquake and tsunami, evacuation planning, evacuation response, vertical evacuation, natural warning, tsunami warning.. GNS Science Report 2012/17. viii.
(10) 2012. 1.0. INTRODUCTION. 1.1. Background to the event. The moment magnitude (Mw) 9.0 Great East Japan earthquake occurred at 14:46 (Japanese Standard Time) on March 11th 2011. The earthquake mechanism was reverse faulting at a depth of 24 km on the subduction zone plate interface at the Japan Trench, with the epicentre at N38.1, E142.9, 130 km offshore of the Oshika Peninsula (Japanese Meteorological Agency, 2011a). The total rupture area is estimated to be 380 km long and 90-130 km wide (Geospatial Information Authority of Japan (GSI), 2011a). Strong ground shaking was felt across Japan, and while Japanese Meteorological Agency (JMA) shaking intensity 7 was recorded at one location (Kurihara City, Miyagi Prefecture), locations in Iwate and Miyagi Prefectures generally experienced maximum JMA intensities of 5 Lower to 6 Upper (the perception and impacts of which are described in Table 1). This level of shaking corresponds approximately to Modified Mercalli Intensities 7 to 10 (Table 2), used in New Zealand and the U.S. Seafloor geodetic data indicates co-seismic displacement of up to 3 m in an upward direction (Sato et al., 2011), which was sufficient displacement to generate the tsunami that caused damage along the entire east coast of Honshu, and particularly significant damage in Iwate, Miyagi, Fukushima and Ibaraki Prefectures. Coastal towns were afforded a minimum of around 20-25 minutes between the earthquake and arrival of the first significant (inundating) tsunami waves. Some areas, such as Ishinomaki City, experienced five significant waves, the latest of these arriving at least 2 hours and 15 minutes after the earthquake. Many areas (for example, Natori City and Kesennuma City) remained inundated with standing water until at least March 12th 2011, with frequent subsequent flooding due to co-seismic subsidence at the coast of up to 1.2 m (Geospatial Information Authority of Japan (GSI), 2011b). In Kesennuma, fires that had ignited during the initial tsunami waves continued to burn on March 12th. There are some similarities between this event and expectations of a Cascadia tsunami in Washington State (WA). According to simulations by Venturato et al. (2007), expectations in Washington are for 1-3 m of seafloor deformation and 1-2 m co-seismic subsidence – similar to that experienced in Tǀhoku. Tsunami waves are expected to arrive within as little as 20 minutes and the second wave to reach shore has been modelled at 5-6 m height for Ocean Shores, WA and 7-8 m at Long Beach, WA. These wave heights are sufficient to inundate the 2nd and 3rd storeys of reinforced concrete (RC) or steel buildings and destroy timber buildings near the coast. The extent of destruction that this magnitude of event can cause is highlighted by damage statistics from the National Police Agency of Japan (2012): 118,810 structures suffered total collapse, 176,964 partial collapse and 479,429 partial damage in Iwate, Miyagi, Fukushima and Ibaraki Prefectures. Life loss from this event at February 14th 2012 stood at 19,263 dead and missing (Fire and Disaster Management Agency of Japan, 2012). Fatality rates were variable between the cities and towns affected – Table 3 shows that the fatality rate for the locations visited in this research range from 2% to 8%. The highest recorded fatality rate exceeded 11.5% in Onagawa Town (not visited during this reconnaissance).. GNS Science Report 2012/17. 1.
(11) 2012. Table 1 Human perception and indoor/outdoor effects at JMA intensity 5 Lower to 6 Upper. Extract from Japanese Meteorological Agency (2011b). Seismic intensity. Human perception and reaction. Indoor situation. Outdoor situation. Many people are frightened and feel the need to hold onto something stable.. Hanging objects such as lamps swing violently. Dishes in cupboards and items on bookshelves may fall. Many unstable ornaments fall. Unsecured furniture may move, and unstable furniture may topple over.. In some cases, windows may break and fall. People notice electricity poles moving. Roads may sustain damage.. 5 Upper. Many people find it hard to move; walking is difficult without holding onto something stable.. Dishes in cupboards and items on bookshelves are more likely to fall. TVs may fall from their stands, and unsecured furniture may topple over.. Windows may break and fall, unreinforced concrete-block walls may collapse, poorly installed vending machines may topple over, automobiles may stop due to the difficulty of continued movement.. 6 Lower. It is difficult to remain standing.. Many unsecured furniture moves and may topple over. Doors may become wedged shut.. Wall tiles and windows may sustain damage and fall.. 6 Upper. It is impossible to remain standing or move without crawling. People may be thrown through the air.. Most unsecured furniture moves, and is more likely to topple over.. Wall tiles and windows are more likely to break and fall. Most unreinforced concreteblock walls collapse.. 5 Lower. Table 2 Correspondence between JMA instrumental intensity and Modified Mercalli intensity (after Kunugi, 2000). IJMA is JMA instrumental intensity (‘L’ denotes Lower, ‘U’ denotes Upper). IMM is instrumental Modified Mercalli. IMM1 is Modified Mercalli intensity, which corresponds to the same values for New Zealand MMI scale of Dowrick (1996). Thresholds are determined according to the comparison of the description of the intensity at each level. IJMA. 0. IMM IMM1. 1. 1 1. GNS Science Report 2012/17. 2 2. 2. 3 3. 3. 4 4. 4. 5. 5L. 5U. 5 6. 6L. 6 7. 7 8. 6U 8. 9. 7 9~. 10. 11 ~. 2.
(12) 2012. Table 3 Casualty statistics at locations investigated in this report. JMA intensity source: Japanese Meteorological Agency, 2011c. Total population source: Statistics Bureau, 2010. Casualty statistics source: Fire and Disaster Management Agency of Japan, 2012 (except Tarǀ Town – from Ichiro Matsuo, personal communication). These figures do not account for daily movement of population and fatality rate may have been affected by daily commuting patterns (after EEFIT, 2011) Percentage of total pop. Residing in inundated area. Dead and missing (at 14 feb 2012). Fatality rate (population of inundated area). Municipality. JMA intensity. Total population. Population residing in inundated area. Tarǀ Town. 5L to 5U. 4,876. 3,000. 62%. 185. 6%. Kamaishi City. 5U to 6L. 39,578. 13,164. 33%. 1,047. 8%. ƿfunato City. 6L. 40,738. 19,073. 47%. 425. 2%. Kesennuma City. 6L. 73,494. 40,331. 55%. 1,368. 3%. MinamiSanriku Town. 6L. 17,431. 14,389. 83%. 875. 6%. Ishinomaki City. 6L. 162,822. 112,276. 69%. 3,739. 3%. Natori City. 6U. 73,140. 12,155. 17%. 966. 8%. All areas. -. 412,079. 214,388. 52%. 8,605. 4%. 1.2. Goals, methodology and report structure. Many of the issues experienced in terms of evacuation preparedness and response in Tǀhoku during this event are extremely relevant to tsunami mitigation activities in the State of Washington owing to local earthquake and tsunami hazard posed by the Cascadia Subduction Zone, and in New Zealand due to similar earthquake hazard on the offshore Hikurangi subduction margin. This research set out to investigate key lessons from Japan that are pertinent to emergency management and tsunami preparedness in Washington and New Zealand under the following categories: •. Characteristics of tsunami from a high magnitude local subduction zone earthquake (Section 1.1). •. Level of tsunami preparedness in affected communities and its role in mitigating life loss (Sections 2.1 and 3.1). •. Effectiveness of tsunami warnings and evacuation strategies (including maps and signs) (Sections 2.2 to 2.6 and 3.2 to 3.6). GNS Science Report 2012/17. 3.
(13) 2012. •. Factors affecting emergency response (Sections 2.3 to 2.5 and 3.3 to 3.5), and. •. Performance of structures under earthquake shaking and subsequent tsunami loading, particularly those designed for/designated as vertical evacuation (Sections 2.7 and 3.7). The research was commissioned by Washington Military Department Emergency Management Division (Washington EMD) and supported by New Zealand Ministry of Science and Innovation core geohazards funding to GNS Science, and was conducted in collaboration with local Japanese colleagues. The report focusses on lessons for Washington and New Zealand. This report provides a reconnaissance-level analysis of the themes which arose during interviews of disaster prevention officials and emergency services officials at seven tsunamiaffected locations in Iwate and Miyagi Prefectures. We discuss these themes in Section 2.0, and provide recommendations in Section 3.0 for furthering tsunami preparedness and mitigation in the Washington and in New Zealand. Interview data has been augmented with discussion of local maps, posters, reports, documents and signs in both Japanese and English. Appendices 1 and 2 show the interview questions in English and Japanese and Appendix 3 gives a summary of the key points that were raised during interviews. Appendix 4 provides a summary of vertical evacuation buildings in the locations visited, including information on construction, signage, inundation on 11th March, and number of people who took refuge there.. 1.3. Interviews. The field survey was carried out from October 19th to 28th 2011 in collaboration with Mr Ichiro Matsuo of NPO-CeMI, and Professor Hitomi Murakami of Yamaguchi University. Due to the timing of the survey 7 months after the tsunami, the interviews draw on information gathered through many surveys carried out by local researchers in the interim period. Semi-structured interviews with city officials (civil protection, emergency management, fire department and police department staff) and some local residents were carried out in seven locations in Iwate and Miyagi Prefectures: Tarǀ Town, Kamaishi City, ƿfunato City, Kesennuma City, Minami-Sanriku Town, Ishinomaki City and Natori City. These locations comprise variable topography of rias and plains, and among them experienced a wide range of impacts and evacuation issues on March 11th 2011. A map of the locations investigated is presented in Figure 1 and a summary of casualty statistics is provided in Table 3. The focus of interviews was: •. Natural and informal warnings: awareness, observations/experience and response. •. Style and derivation of evacuation maps. •. Official warning timing and dynamics. •. Evacuation timing, mechanisms and issues. •. Vertical evacuation buildings – availability, designation, public awareness, utilisation, relationship to maps, and post-event review. GNS Science Report 2012/17. 4.
(14) 2012. The interview questions were translated into Japanese (see Appendices 1 and 2) and circulated to interviewees in the days ahead of our meetings. Note that during interviews the ordering of interview topics naturally fell in the sequence given above, rather than the written sequence given in Appendices 1 and 2. Sections 2.0 and 3.0 of this report have been structured according to that natural ordering.. Figure 1 Map of locations investigated in this report, with coastal topography and epicentre of March 11th main shock indicated. Note the grey lines delineate prefectures. All of the locations investigated lie within Iwate and Miyagi prefectures (labelled), which received the largest tsunami wave heights and most of the casualties. Base map credits: GEBCO, NOAA, National Geographic, DeLorme, Esri.. GNS Science Report 2012/17. 5.
(15) 2012. 1.4. Tsunami preparedness in the Tǀhoku region of Japan. 1.4.1. Previous events and hazard estimation. Tsunami preparedness in Japan is addressed in the Basic Disaster Plan as a subsection of Earthquake Countermeasures, which is summarised in a plan report from the Cabinet Office Government of Japan (2007). The Cabinet Office has produced guidelines for the creation of tsunami hazard maps and designation of tsunami evacuation buildings (Hiroi et al., 2005). These are followed by prefecture and municipality governments under their responsibility to formulate and implement local disaster management plans, based on the national plan. Tsunami preparedness in the Tǀhoku region is borne out of well-recorded impacts of previous events, primarily the 1896 Meiji Sanriku, 1933 Shǀwa Sanriku and the 1960 Chile tsunami. A technical investigation to define characteristics of expected earthquakes of the Japan Trench was carried out between 2003 and 2006, in which the expected damage from these events was estimated and necessary mitigation strategies developed. Eight earthquake scenarios were examined for the northeast of Japan, and their estimated impacts used to develop strategies for mitigation of economic damage and life loss (Central Disaster Prevention Council, 2008). Analysis of these eight separate events formed the basis of hazard assessment from Japan Trench tsunami until early 2011, with no consideration for the rupture of multiple segments at once (Expert Committee on the Working Group on Tsunami disaster evacuation, 2010), as occurred on March 11th. Preparedness prior to March 2011 focussed on the locally recurrent Miyagi-ken-oki (“Offshore Miyagi Prefecture”) tsunami, which has been consistently used as the basis for numerical tsunami simulation, hazard mapping and determination of the design-level tsunami for structural defences. The Miyagi-ken-oki earthquake is a recurrent earthquake event of around magnitude 7.5 with a source area off the Oshika Peninsula, Miyagi Prefecture (in the same area as the epicentre of March 11th event, Figure 1). This size of earthquake has occurred five times since 1835, the most recent occurrences in 1978 and 2005, with no significant tsunami. The event was estimated to have a mean recurrence interval of 35.2 years and an estimated 97% probability of occurrence in the period 20022032 (Ohtake and Ueda, 2002). Due to the frequency of this type of event and knowledge of the source area, this scenario is the one most often simulated to map tsunami hazard, while inundation heights and extents of the Meiji and Shǀwa era tsunami are often also delineated on hazard maps (see Section 2.2). The absence of the 869 Jogan Tsunami in informing preparedness activities is surprising given that it has been demonstrated inundation extended more than 4 km inland (Minoura, Imamura, Sugawara, Kono, and Iwashita, 2002). This extent is similar to the inundation extent on March 11th 2011 in the same area. This extreme event was not included in hazard modelling and mapping due to it being perceived as an outlier (Earthquake Engineering Research Institute, 2011a), and perhaps also due to a lack of knowledge of the potential source area and absence of tsunami deposit data on the inundation extent on other sections of the Tǀhoku coast. 1.4.2. Hazard estimation and mapping. Hazard estimation is consistent at prefecture level as it is the prefectural government who carry out the tsunami estimation for all coastal municipalities within their prefecture. The. GNS Science Report 2012/17. 6.
(16) 2012. delineated hazard is provided to the individual municipality governments, who produce hazard maps and evacuation maps as part of their local disaster management plan. Community engagement with evacuation mapping is discussed in Section 2.1, which includes examples of hazard maps from the locations visited. The inconsistencies between municipalities in representation of hazard and evacuation routes or refuges are shown in Section 2.2 and in the Miyagi Prefecture online database of maps (Miyagi Prefectural Government, 2004). 1.4.3. Education and evacuation exercises. Regular education and evacuation drills are conducted by municipal governments to maintain disaster prevention awareness. A national “Disaster Reduction Day” is held annually, during which every prefecture carries out large-scale decision-making simulations. There is also an annual tsunami evacuation drill held in Miyagi and Iwate prefectures on the anniversary of the 1960 Chile tsunami. In addition to this, disaster prevention activities are carried out by local groups at the city or neighbourhood level for tsunami in addition to other perils. The philosophy of tsunami tendenko relies on the trust that every person in a community knows what to do in the event of a tsunami to self-evacuate immediately (rather than helping or waiting for others) and get to an evacuation refuge according to a home or work evacuation plan. This philosophy is described very well in a video documentary by D. Harding and B. Harding (2011). Despite these exercises and the well-known history of tsunami in Japan, a review of evacuation in Kesennuma City following a local offshore earthquake in 2003 (causing JMA shaking intensity up to 6 Lower) showed that almost 86% of residents, including those in the tsunami hazard zone, did not evacuate (Suganuma, 2006) and a low rate of evacuation also occurred following a tsunami warning in 2004 in the Tokaido region. Suganuma (2006) describes a decline in disaster prevention awareness over time since the 1995 HanshinAwaji (Kobe) earthquake. A survey of 1,808 residents in areas of Sendai subject to a tsunami warning on May 28th 2010 (following the Maule, Chile earthquake) shows only 53.9% of residents evacuated (City of Sendai, 2010). 1.4.4. Earthquake early warning system and rapid official tsunami warnings. Another high-profile tool in the preparedness framework for Japan is the JMA-operated earthquake early warning system. A network of seismometers allows rapid detection of earthquakes and analysis of the magnitude and hypo-central location. P-wave arrival time near the epicentre allows estimation of arrival for the more damaging S-waves. This system can provide tens of seconds warning ahead of damaging ground shaking, allowing time for people to find cover, and also facilitates rapid estimation of tsunami generation. Within 2-3 minutes of a tsunamigenic earthquake occurring, estimated tsunami wave heights and arrival times can be provided in a tsunami advisory or warning, based on the estimated earthquake magnitude (Japanese Meteorological Agency, 2011d; Ozaki, 2011). Tsunami warnings are issued to 66 individual regions by JMA with a level of severity determined by expected tsunami height at the coast (Table 4). Observations at offshore GPS buoys are used to revise earlier estimates as water level or pressure changes at the buoy (Ozaki, 2011). JMA disseminates advisories and warnings to TV and media, and to local governments using a combination of dedicated online, radio, and satellite wireless networks. GNS Science Report 2012/17. 7.
(17) 2012. Municipality governments are then responsible for issuing evacuation orders to the public on receipt of a warning from JMA or national government (Suganuma, 2006), which is achieved via roof-top or street-based loud speakers and indoor receivers. Table 4 Specifications of tsunami warning/advisory issued by JMA (Source: Japanese Meteorological Agency, 2006). Category. Tsunami Warning. Major tsunami Tsunami. Tsunami Advisory. 1.4.5. Indication. Forecast tsunami height. Tsunami height is expected to be 3 meters or more.. Forecast heights are specifically indicated for every region; namely 3 m, 4 m, 6 m, 8 m and 10 m or more.. Tsunami height is expected to be up to 2 meters. Tsunami height is expected to be about 0.5 meters.. Same as above, but 1 m or 2 m. 0.5 m. Coastal defences. ‘Hard’ coastal defences are a common feature of the Japanese coastline, and at a given location may include a combination of offshore breakwaters, groynes, seawalls (at the shoreline, or further inland), concrete revetments and river-mouth flood gates. The designlevel tsunami for these defences is often those that have been previously experienced: Kamaishi breakwaters are based on the 1896 Meiji tsunami; the Tarǀ seawall was constructed as a result of the effects from the 1896 and 1933 tsunami. Other defences are designed according to the Miyagi-ken-oki tsunami scenario.. 1.5. Tsunami preparedness in the State of Washington and New Zealand. The authors have previously undertaken numerous social research projects on tsunami preparedness and evacuation in United States (specifically the State of Washington), New Zealand and Japan. These projects have been in collaboration with local and national level emergency managers in New Zealand, Washington EMD, and CeMI (an environmental planning non-profit organisation) in Japan. They have included studies of public perception, tourism preparedness, warning system effectiveness, evaluation of evacuation plans, and standardisation of mapping and signage. 1.5.1. Washington. For over a decade the State of Washington has developed a programme of tsunami understanding and preparedness, through a combination of state initiatives and wider national programmes. This occurred in response to the increased awareness among scientists of the tsunami risk posed by the earthquakes along the Cascadia Subduction Zone, offshore of the Pacific Northwest states. As part of an integrated evaluation program, Johnston et al. (2005) carried out several surveys and focus groups between 2001 and 2003 to evaluate tsunami preparedness in Washington. This work found that earlier initiatives had been “moderately to highly effective in raising public awareness of the tsunami hazard”, but that this awareness did not necessarily translate into preparedness, which was recorded as “low to moderate”. Awareness among visitors was much lower than that of residents, and Johnston et al. (2007) followed up these findings with an assessment of preparedness in the tourism sector. This work, carried out in 2005, found a low level of staff training on tsunami hazards, and little provision of hazard information to guests. In response to the findings of. GNS Science Report 2012/17. 8.
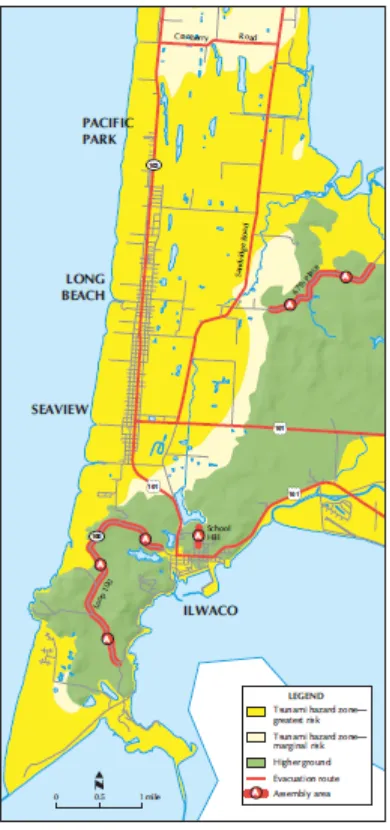
(18) 2012. Johnston et al. (2005), various outreach initiatives and educational tools were developed to increase preparedness in Washington, while staff training, workshops and a guidebook were developed specifically for the tourist sector in response to the findings of Johnston et al. (2007). The most recent follow-up research in this series of evaluations, Johnston et al. (2009), noted that high staff turnover remains a challenge to achieving high levels of preparedness in the tourism sector although there have been improvements. It was also recognised by Johnston et al. (2009) that improvements have been made in the provision of loudspeaker warning systems and community-based evacuation drills, although participants from both Ocean Shores and Long Beach expressed concern over the available evacuation routes. Further evaluations of siren tests and community-based evacuation exercises were carried out in September 2010; the findings showed mixed levels of siren audibility in the current system, but highlighted the effectiveness of siren and evacuation drills as a means of hazard education (Leonard et al., 2011). The Washington EMD program focusses on education and preparedness of both the resident public and the tourism sector. This is achieved in part through public forums, town hall meetings in collaboration with local Emergency Managers, and training of local volunteers to serve as community tsunami educators. Tsunami information, preparedness and evacuation educational materials are provided via internet, brochures, fact sheets, video, resource guides, guidebooks, childrens’ cartoon books, trivia sheets, games, and evacuation maps are available (http://www.emd.wa.gov/hazards/haz_tsunami.shtml). Evacuation signage is widely deployed in tsunami hazard zones. Tsunami warning infrastructure includes All Hazard Alert Broadcast (AHAB) to radios and free-standing siren towers and NOAA weather radios are provided to low income families and schools. Twelve communities in Washington are recognised as ‘Tsunami Ready’ under the National Oceanic and Atmospheric Administration/National Weather Service (NOAA/NWS) ‘Tsunami Ready’ program, which helps communities increase tsunami preparedness (NOAA/NWS, 2011). The provision of evacuation maps is a major initiative covering over 20 different locations. Some maps use three zones of ‘greatest risk’, ‘marginal risk’ and ‘higher ground’, evacuation routes, assembly areas, roads, rivers and place names (Figure 2). Other maps use only two zones: ‘tsunami hazard zone’ and ‘outside of hazard zones’, for example in Clallam County (Figure 3). These maps are provided with additional information as part of a short brochure. In the planning of evacuation routes and assembly areas, Washington EMD and the Department of Natural Resources assess landslide and liquefaction hazards which may impede evacuation. There are inconsistencies between maps produced by different state authorities in the U.S. and Kurowski, Hedley, and Clague (2011) discuss this issue in their evaluation of tsunami evacuation maps in Washington. New National Tsunami Hazard Mitigation Program (NTHMP) guidelines have been released to ensure there is enhanced consistency in this respect from January 2012 (NTHMP Mitigation and Education (MES) Subcommittee, 2011).. GNS Science Report 2012/17. 9.
(19) 2012. Figure 2 Excerpt from the tsunami evacuation map Clallam Bay, Clallam County, Washington. This map uses 2 zones, local sites of importance (fire department, etc.), evacuation routes and assembly areas (Clallam County Emergency Management, n d).. Figure 3 An example evacuation map in Washington. This map is for Long Beach and Ilwaco, Pacific County, and illustrates the use of 3 zones, evacuation routes and assembly areas (Pacific County Emergency Management, 2007).. GNS Science Report 2012/17. 10.
(20) 2012. Signs for hazard zones and evacuation routes are standardised along the Pacific Coast, with signs indicating the tsunami hazard zone with brief instructions regarding natural warnings (Figure 4) and evacuation route signage (Figure 5).. Figure 4 ‘Tsunami Hazard Zone’ sign with instructions to evacuate to high ground or inland in response to an earthquake. Figure 5 ‘Tsunami Evacuation Route’ sign with arrow depicting the direction of evacuation. These signs are placed regularly along roads in tsunami hazard zones.. 1.5.2. New Zealand. The risk of tsunami from the offshore plate boundary has been apparent to scientists in New Zealand for well over a decade, but political and public traction for mitigation only increased following the Indian Ocean tsunami in 2004. Guidance for New Zealand is now in place for tsunami warning (MCDEM, 2010a), evacuation mapping (MCDEM, 2008a), signage (MCDEM, 2008b), land use planning (Saunders et al., 2011), and guidance for official CDEM messages (MCDEM, 2010b). The standard base map for evacuation maps shows three evacuation zones: a coastal exclusion zone that can be placed off limits when only the foreshore is at risk, an orange zone that intends to cover most distant sources, and a larger yellow zone that includes the local and regional sources (Figure 6). The maps are then developed in discussion with the local community with respect to what is depicted on the map – e.g. road names and key infrastructure. Standard signs include an ‘evacuation zone sign’, information boards which include the evacuation map, various ‘evacuation route’ signs, an ‘evacuation safe location’ sign, and a ‘previous event’ sign (which is unused and may be re-considered in light of Tǀhoku events). The first two signs are shown on the information board (Figure 7), while the latter two have not yet been implemented in New Zealand. Neither Washington nor New Zealand employs large amounts of ‘hard’ coastal defences for coastal protection – sea defences are typically placed in ports and are designed to protect against storm waves, not tsunami waves. Beach and dune environments dominate the shoreline in low-lying areas of both regions.. GNS Science Report 2012/17. 11.
(21) 2012. Currently there are no early warning systems in place for Washington or New Zealand for local source tsunami. Local tsunami warning would be natural and informal warnings, whereas regional to distant tsunami allow warnings to be disseminated through official channels. It is known that there is public misunderstanding that official warnings and warning hardware (e.g. sirens) will cover local sources – this is an ongoing issue for public awareness and preparedness.. Figure 6. An example tsunami hazard map from Whananaki, New Zealand.. Figure 7 An example tsunami evacuation map and information board as displayed outdoors (1.2 m wide) in the Island Bay community, Wellington, New Zealand.. GNS Science Report 2012/17. 12.
(22) 2012. 2.0. INTERVIEW OUTCOMES. This section discusses emergent themes from the interviews with disaster prevention and emergency service officials in the Tǀhoku region, and relates these issues to Washington and New Zealand. Each sub-section contains information which has some cross-over to other themes, and several themes may be inter-related or influenced by the same factors. No theme or event highlighted here should be considered in isolation. A summary of the key points raised in interviews at each location is presented in Appendix 3 for quick reference. Recommendations for Washington and New Zealand are given separately in Section 3.0 in consistent sub-sections.. 2.1. Community involvement in evacuation planning and preparedness. Community disaster groups are common in Japan and many cities and towns have multiple disaster prevention groups who are engaged with local government in awareness and education activities at the neighbourhood level. High levels of community engagement were apparent in most of the interviews, particularly with residents being involved in production of evacuation maps in Kamaishi, ƿfunato, Kesennuma, and Minami-Sanriku. In these locations, the prefectural government provides hazard mapping to the municipal government who then work with community groups to develop the evacuation maps and identify suitable (or historical) places of refuge. This approach is not ubiquitous – in Natori City, the development of evacuation mapping was said to be the responsibility of local government who then provide the finalised evacuation map to the public. The local community was involved in identification of potential buildings for vertical tsunami evacuation in ƿfunato, Kesennuma and Kamaishi. Community members had either approached building owners about the potential use of a building, or approached municipal government with suggestions of potential buildings. There have been mixed outcomes regarding the eventual official designation of buildings where the community have been involved in this process, but it is clear that community engagement in vertical evacuation strategies is beneficial, as discussed in Section 2.7. In addition to the nationwide tsunami disaster drill carried out annually on the anniversary of the 1960 Chile tsunami, community groups in Natori City, Ishinomaki City and Miyako City carry out more regular drills for tsunami, as well as other hazards. The officials we interviewed were not able to provide data on the levels of resident participation in such drills. Community involvement in planning and preparedness is well-established in Washington, where the Emergency Management Division engages with coastal communities through county level emergency management groups, who co-ordinate community education sessions and evacuation drills. There has previously been a high level of community interest in participating in focus groups on tsunami risk and preparedness, with proactive preparation among many hotels in coastal Washington (Johnston et al., 2005). An AHAB siren test and evacuation drill on September 21st 2011 achieved 100% participation of schools in Grays Harbor County, although participation was lower in other counties (J. D. Schelling, personal communication, December 17th 2011), illustrating the high levels of engagement which have been achieved. Project Safe Haven is a current vertical evacuation strategy development. GNS Science Report 2012/17. 13.
(23) 2012. project, in which the community drives discussion of conceptual facility locations, design of facilities, and development of a preferred strategy (Project Safe Haven, 2011a, 2011b). This project provides raised awareness in the coastal communities and is an excellent model for developing and enhancing community-based evacuation strategies. In New Zealand, national guidelines and standards for maps and signs have existed since 2008, but the application of these guidelines at community level is just developing momentum in 2012. Locally specific evacuation maps have been developed across several New Zealand regions, with varying approaches to community engagement. Most local authorities at least consult the community on appropriate evacuation routes at community meetings. Whangarei District and Wellington City have developed maps with some communities as part of all hazard community response planning, with full ownership of maps, plans, sign locations and exercise planning lying with the community planning group. Evacuation drills presently only occur in a few communities nation-wide. Civil Defence and Emergency Management (CDEM) Groups of emergency services and disaster managers are mandated through legislation in all regions, and community-based planning for tsunami is expected to continue to grow in coming years.. 2.2. Hazard/evacuation maps and signs. 2.2.1. Hazard/evacuation maps. Maps depicting tsunami hazard (with or without evacuation facilities and routes) had been developed prior to 2011 for all of the communities visited during this research. The content and style of evacuation maps therefore varies greatly between municipalities in terms of both hazard used and features pertaining to evacuation. Community involvement in defining evacuation routes was a feature of map development in Kamaishi, ƿfunato, Kesennuma and Ishinomaki, but in Natori City the definition of refuges and evacuation routes was carried out by the municipal government. Although a full evaluation of evacuation maps is outside of the scope of this report, notable variations in the maps for locations visited (Figure 8 to Figure 14, obtained from local officials or government websites) are summarised below. The inclusion of previous or modelled events is inconsistent. To delineate the tsunami hazard, most municipalities map recorded inundation heights or extents of one or more of four key tsunami scenarios: the 1896 Meiji tsunami, 1933 Shǀwa tsunami and 1960 Chile tsunami, and the modelled extent or heights of tsunami from the expected Miyagi-ken-oki earthquake. The hazard map for Ishinomaki City used the modelled Miyagi-ken-oki earthquake and the official recognises that the consideration of source events in their approach was not robust enough. It appeared that several emergency managers interviewed may not have had a clear idea of which data originated from modelling, and which represented historic events, but this may have been uncertainty related to language translation. We were unable to discuss clarity of the maps with members of the public. Hazard or evacuation zone style varies between maps. Some maps use variable colouring to indicate modelled inundation depth (Figure 10, Figure 11, Figure 13); others provide only a single colour delineation of inundation extent in historic events (Figure 8, Figure 12).. GNS Science Report 2012/17. 14.
(24) 2012. Generally maps appear quite crowded with a range of topographic, cultural as well as tsunami evacuation related content. In some cases additional historic event lines are present as well as coloured zones. However, the location of at least one tsunami hazard zone stands out well in all maps. All of the evacuation maps that we observed show refuge locations although, the symbols used are inconsistent between maps. Definitions of refuges vary and include generic ‘safe refuge’, ‘tsunami-specific refuge’, ‘vertical evacuation building’ (Figure 11) or ‘welfare location’s, with some maps using different symbols to define refuge type. Many of the refuges shown on maps were designated based on community function and capacity and were typically schools or community centres. During the evacuation on March 11th many people evacuated directly to designated shelters. There is limited illustration of evacuation routes on the maps. ƿfunato (Figure 10) and Kesennuma (Figure 11) use arrows indicating the approximate best route out of the inundation zone, but there is no prescriptive route marked. Other maps do not include any graphical indication of evacuation route. Text-based evacuation or preparedness information is provided on most maps, but the content of this information varies. The Tarǀ Town map includes information on previous tsunami events, while the maps for ƿfunato and Natori have advice on preparedness and space for residents to fill out important information. The interviews carried out in this study did not provide sufficient insight into the impact of inconsistent evacuation maps on evacuation on March 11th 2011. This requires further research as Japan amends and enhances its hazard modelling and evacuation mapping in light of the Tǀhoku tsunami. Recent work by Kurowski et al. (2011) highlighted that some similar inconsistencies occur in evacuation mapping in Washington and Oregon (see Section 1.5), and any research in Japan into the impacts of variable evacuation maps on the response of transient populations or different levels of risk perception in Japanese coastal communities could provide additional guidance as to enhancing the approach taken in Washington. Consistency in evacuation mapping is already recognised as an issue in the United States and all maps produced after January 1st 2012 are subject to guidelines set out by the NTHMP Mitigation and Education Subcommittee (2011) to ensure minimum requirements in evacuation mapping. Updating of current maps to ensure consistency is expected to be complete by the end of 2012 (J. D. Schelling, personal communication, March 9th 2012). Consistent evacuation mapping in New Zealand is being achieved by following the guidelines set out in MCDEM (2008a). Some variation still exists in terms of the delineation of the location of evacuation zone boundaries, where local CDEM group members are responsible for producing their own mapping of zones from hazardous wave heights e.g. Hawke’s Bay CDEM Group (2011). In New Zealand there is a strong emphasis on simple maps showing zones, routes and safe locations, and as concise as possible messaging focussing on the required response to natural and informal warnings (evacuate all zones) vs. official warnings (the warning will state the zone(s) to evacuate). One community group, in conjunction with Wellington Emergency Management Office, has delineated the beginning of the mapped safe zone with a blue line painted across roads throughout the suburb. This has generated very high public awareness and is planned to be rolled out city-wide.. GNS Science Report 2012/17. 15.
(25) 2012. Figure 8 Extract from Tarǀ tsunami hazard map, indicating three sections of tsunami wall (red (1958 section), black and yellow thick lines), tsunami gates (blue triangles and circles). The inundation extent of the 1986 Meiji (thin red line) and 1933 Shǀwa tsunami (thin blue line). Evacuation refuges are marked as red triangles and welfare centres as red circles. Source: Tarǀ Town Disaster Prevention Office.. Figure 9. Kamaishi City evacuation map (Source: Kamaishi City Disaster Prevention Office).. GNS Science Report 2012/17. 16.
(26) 2012. Figure 10. ƿfunato City evacuation map (Source: ƿfunato City Disaster Management).. GNS Science Report 2012/17. 17.
(27) 2012. Figure 11 Excerpt from Kesennuma City evacuation map (Source: Kesennuma General Affairs Department).. GNS Science Report 2012/17. 18.
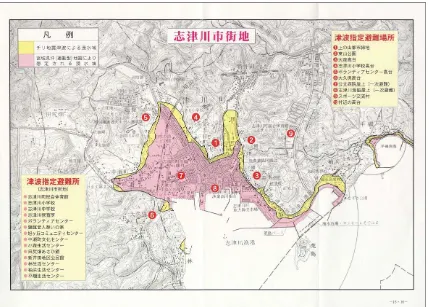
(28) 2012. Figure 12 Minami-Sanriku hazard map with evacuation refuge locations indicated by numbered red circles (Miyagi Prefectural Government, 2004).. Figure 13 City, n d).. Excerpt from the Ishinomaki tsunami hazard map with evacuation refuges (Ishinomaki. GNS Science Report 2012/17. 19.
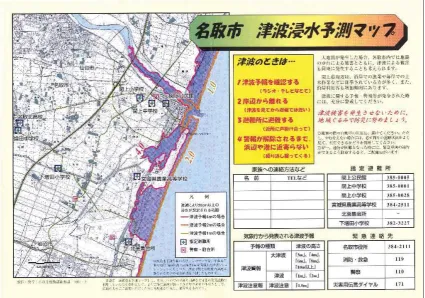
(29) 2012. Figure 14. Natori City hazard map (Source: Natori City Disaster Prevention Office).. 2.2.2. Hazard/evacuation signs. Road signs indicating evacuation routes or extent of inundation zones are inconsistent between prefecture and municipality, however, they form a key part of tsunami preparedness and are commonly seen. This sub-section demonstrates the range of information displayed on signs in Iwate and Miyagi. Road signs indicating the estimated extent of tsunami inundation zones (Figure 15 and Figure 16) are present along the coast in Kamaishi district. On roads out of Tarǀ, similar signs mark the extent of inundation in the 1933 Shǀwa tsunami.. Figure 15 A sign displayed above the road indicating to drivers that they are entering an estimated tsunami inundation area. These signs were seen on roads within Kamaishi district. Figure 16 A sign displayed above the road indicating to drivers that they are exiting an estimated tsunami inundation area. These signs were seen on roads within Kamaishi district.. GNS Science Report 2012/17. 20.
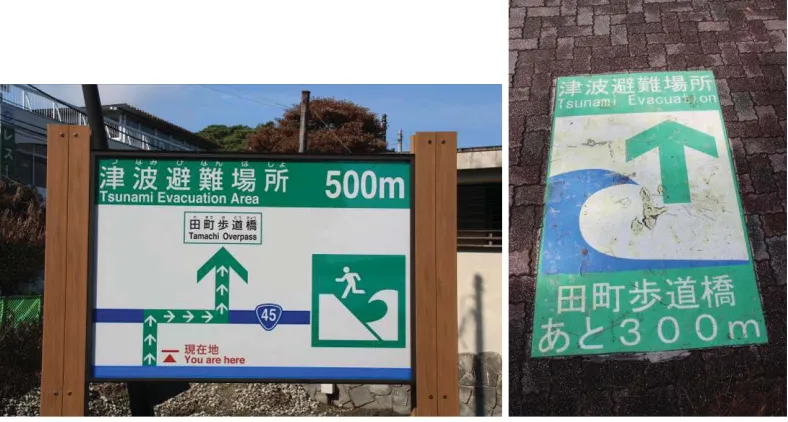
(30) 2012. Evacuation route signs in Miyako City and Matsushima Town commonly include the distance to safe places, in addition to a directional arrow. There is consistent use of the green symbol depicting evacuation to high ground (Figure 17 to Figure 20). Matsushima Town also has information boards displaying a schematic map of the entire evacuation route and location of the designated assembly point on the evacuation route (Figure 19) in addition to signs painted onto the pavement in town (Figure 20). This style is not consistent for all signs in Matsushima, however: Figure 21 shows a more basic sign indicating just the direction of evacuation. The inclusion of distance on evacuation route signs is not currently included in signage standards for New Zealand (MCDEM, 2008b) or Washington.. Figure 17 Tsunami evacuation route direction and distance sign displayed on a sign in Hitachihamacho, Miyako City. Figure 18 Tsunami evacuation route direction and distance sign displayed on a lamp-post in Hitachihamacho, Miyako City.. Figure 19 Tsunami evacuation route information board and directions (with distance to safe location) in Matsushima Town, Miyagi Prefecture. Figure 20 Tsunami evacuation route sign with direction and distance to safe location painted on the pavement in Matsushima Town, Miyagi Prefecture.. GNS Science Report 2012/17. 21.
(31) 2012. Figure 21. A sign in Matsushima Town, displaying the tsunami evacuation route.. Figure 22 Tsunami evacuation route sign with solar powered lamp, on a road leading to high ground out of Tarǀ Town.. Tarǀ Town has signs posted regularly at short distances (20-30 m) along the road out of the Town towards high ground. These signs are mounted on posts with solar powered lamps for night-time use (Figure 22). ƿfunato City uses signs indicating the walking route direction and distance to safe refuges, providing the name of the refuge in English and Japanese (Figure 23). The city also uses signs which light up at night.. Figure 23 Evacuation route sign in ƿfunato City, indicating the distance to a “tsunami emergency place of refuge”. Photo courtesy of EEFIT.. In addition to the information boards and pavement-mounted signs in Matsushima Town, we also observed an example of natural warning education in the centre of town, situated close to several tourist sites (Figure 24). This sign displays the standard green icon representing evacuation to high ground. Another style of tsunami warning sign was observed on a road out of Kamaishi (Figure 25); this symbol is consistent with other signs observed in the district in terms of the yellow and. GNS Science Report 2012/17. 22.
Figure


+7


Related documents
Hence this study was carried out to provide the first baseline data of clinical, hematological and biochemical profiles of patients infected with dengue virus.. Methods:
BGA: Blood gas analyses; CO: Cardiac output; CPO: Cardiac power output; EE: Energy expenditure; EMG: Electromyography; EMS: Electrical muscle stimulation; ICU-AW: Intensive
Conclusions: Perioperative sodium bicarbonate administration had no favorable impact on postoperative renal function and outcomes in patients with IE undergoing cardiac
BMCMC: Bayesian Markov chain Monte Carlo; BSP: Bayesian skyline plot method; cDNA: Complementary DNA; DBS: Dried blood spots; dN: Non synonymous substitutions; dS:
The high and low affinity heparin appear to bind at different sites on the heparin chain, since the effects of the peptide pairs of peptides (i.e. For full
In this work two strains of Candida guilliermondii were compared for their citric acid-producing capabilities, these being parent strain Candida guilliermondii NRRL
7.7: Cross-section diagrams of the step-by-step MEMS release process, a Initial CMOS chip with circuitry and unreleased MEMS capacitors, b Lithography with thick resist DWW
Nitri fi cation and sedimentary denitri fi cation occurred near the river mouth, nitri fi cation prevailed further offshore under the plume, and fi nally, phytoplankton
