THE MORPHOLOGY AND LONG TERM SHORELINE CHANGES
OFLONGBEAC~SANDYBAY
Stuart
J,
Anstee
A thesis submitted in partial fulfillment of the requirements of
Bachelor of Science (Honours)
November, 2000
School of Geography and Environmental Studies,
Declaration
This thesis contains no material that has been submitted for credit in any other degree or
graduate diploma in
any tertiary institution. To the best of the author's knowledge, this
thesis contains no material previously published or written by other persons, except when
due reference is made in the text of the thesis
.
.. LV~
Stuart J.
Anstee
Department of Geography and Environmental Studies,
University of Tasmania
November, 2000
Abstract
This project has analysed the long term changes in shoreline position and morphology of Long Beach, located 3 kilometres south of the Hobart CBD in southern Tasmania. Also of interest was the effect of the seawall on shoreline recession rates on Long Beach, offshore bathymetry and the sediment cycling in the area.
Aerial photography and Geographic Information Systems (GIS) is used to create graphical change maps of the study area from 1947 to 1998, in order to interpret regions of change. This information was interpreted to obtain numerical values for the rates of recession or accretion. The changes in offshore bathymetry were also investigated through the production of a digital elevation model. Spot height data was analysed and interpolated in order to effectively locate offshore sand stores.
Results have shown extensive shoreline retreat from 1947, with sand loss being most severe on the mid-regions of Long Beach and on Long Point to the north. In comparison, accretion is prevalent on Nutgrove Beach indicated by a developed dune system. Rates of recession have averaged 2 metres/year during periods of maximum erosion. This figure is comparable to other shoreline studies completed in the region. The variations in sediment supply were analysed in relation to the effect of coastal processes and various coastal engineering structures.
It was found that the erosion on Long Beach has been a direct result of a combination of natural
and human-induced changes.
• A shift in the balance of northerly and southe_rly winds has altered the sediment equilibrium that existed prior to the 1950s, as a result sediment is no longer able to reach Long Beach from the northern beach.
• The extension of a sewage outfall pipe on Blinking Billy Point has possibly restricted sediment movement from the south.
• The presence of the seawall on Long Beach combined with a narrow beach has resulted in waves impacting on the beach during storm events resulting in increased erosion due to wave reflection and scouring.
Acknowledgements
I would like to thank several people for their assistance and contributions during the year,
their help ensured the successful completion of this thesis.
Firstly, my sincere thanks to my supervisor, Dr, Kate Brown, who helped come up with the
topic of the thesis and was always available to answer questions, give advice and read
countless numbers of drafts.
Thanks also to Dr. Eleanor Bruce in the School of Spatial Information Science for giving up
so much time and providing the knowledge and assistance required for the completion of the
GIS component of the thesis.
Many thanks to Greville Turner at the Hobart City Council who provided the aerial
photographs, background reports and much of the information that contributed to the thesis.
Thanks to my wonderful girlfriend Anita for her help and support during the last year. Her
assistance in the field and her support and understanding was greatly appreciated.
Finally, I would like to thank my family for their support throughout my entire University
studies. Without their help the completion of this thesis (or degree) would have been
impossible. Thanks to my brothers Rob and Paul who provided the inspiration to complete an
honours year. I am extremely grateful to Paul whose computer made the task much easier.
There are many other people who have contributed in someway to the completion of this
thesis, thank you
.
TABLE OF CONTENTS
1. INTRODUCTION ...
.
..
.
...
.
...
.
...
!
1.1 BACKGROUND ... 1
1.2 PREVIOUS STUDIES ON THE AREA ... 3
1.3 AIMS AND OBJECTIVES ... 5
1.4 STRUCTURE OF THE THESIS ... 5
2. BACKGROUND TO THE STUDY AREA ... 7
2.1 LOCATION AND ACCESS ... 7
2.2 CLIMATIC CONDITIONS ... 13
2.3.1 Wave Climate ... 16
2.3.1.1 Swell Waves ... 17
2.3.1.2 Wind Waves ... 17
2.3 GEOLOGY AND SOILS ... 19
2.4 HISTORY OF LAND USE ... 21
2.4.1 Commercial Operations ... 21
2.4.2 Recreation ... 21
2.5 PRESENT LAND USE ... 22
2.5 .1 Commercial and Residentiallanduse ... 22
2.5.2 Recreation ... 22
2.6 VEGETATION ... 23
2.7 HUMAN IMPACTS ... 24
2.8 CHAPTER SUMMARY ... 26
3. FORM AND PROCESS
...
27
3.1 INTRODUCTION ... 27
3.2 FORMATION AND EROSION OF ESTUARINE BEACHES ... 29
3.3 THE EFFECT OF WAVES ON THE DYNAMICS OF BEACH SYSTEMS ... 31
3.3.1 Swell waves ... 33
3.3.2 The effect of Southern Ocean Swell Waves on the Study Area ... 36
3.3.3 Wind waves ... 36
3.3.4 The Effect of Estuary Wind Waves within the Study Area ... 37
3.4 THE EFFECT OF CURRENTS ON THE DYNAMICS OF BEACH SYSTEMS ... 38
3.4.1 Long-shore currents ... 38
3.4.2 Shore-normal currents ... 40
3.4.2.1 Bed Return Currents ... 40
3.4.2.2 Tidal Currents ... 40
3.4.2.3 Wind Currents ... 41
3.4.3 The Effect of Currents within the Study Area ... 41
3.5 AEOLIAN SEDIMENT TRANSPORT. ... 42
3.5.1 Aeolian Sediment Transport in the Study Area ... .45
3.6 HUMAN IMPACTS ON BEACH MORPHOLOGY ... .44
3.7 CHAPTER SUMMARY ... 47
4. METHODS AND RESULTS ... 48
4.1 INTRODUCTION ... 48
4.2 METHODS ... 48
4.2.1.1 Inputting spatial data ... .49
4.2.1.2 Rectification ... 50
4.2.1.3 Digitising aerial photographs ... 50
4.2.1.4 Creation of Digital Elevation Model ... 51
4.2.1.5 Analysis ofdata ... 51
4.3 DATA ACCURACY ... , ... 52
4.3.1 Spatial data ... , ... 52
4.3.2 Attribute Data ... 52
4.4 RESULTS ... , ... 54
4.4.1 1947 -1967 ... 54
4.4.2 1967- 1973 ... 54
4.4.3 1973 - 1981 ... 55
4.4.4 1981- 1988 ... 55
4.4.5 1988- 1998 ... 55
4.4.6 1947- 1998 ... 55
4.5 DIGITAL ELEVATION MODEL 62 4.6 CHAPTER SUMMARY ... 64
5. CHANGES IN THE SHORELINE POSITION ... 65
5.1 INTRODUCTION ... 65
5.2 DISCUSSION ... 65
5.2.1 Shoreline Changes ... 65
5 .2.2 Coastal Bathymetry ... 68
5.2.3 Influence of Coastal Engineering Structures ... 68
5.2.3.1 Influence of Outfall Pipe ... 68
5.2.3.2 Influence of Seawall ... 69
5.2.3.3 Influence of Foreshore development.. ... 75
5.2.3.4 Influence of other factors ... 76
5.2.4 Influence of Coastal Processes ... 77
5 .2.4.1 Influence of Swell and Wind ... 77
5.2.4.2 Influence of Currents ... 79
5.3 CHAPTER SUMMARY ... 79
6. CONCLUSION ...
.
...
.
... 82
6.1 ADDRESSING THE AIMS OF THE THESIS ... 82
6.2 CONCLUSION ... 84
7. REFERENCES ...
... 85
LIST OF FIGURES
Figure 2.1 Location of Study Area 8
Figure 2.2 Study Area 9
Figure 2.3 Average monthly maximum and minimum temperatures, Ellerslie Road Station 14
Figure 2.4 Average monthly precipitation for Ellerslie Road weather station 15
Figure 2.5 Wind Rose data for the Ellerslie Road Weather Station between 1944 and 2000 18
Figure 2.6 Geology map of the Study Area 20
Figure 2.7 Diagram of Long Beach seawall 25
Figure 3.1 The definitions of the Coastal Zone 30
Figure 3.2 Sediment supply within the marine/estuary environment 31
Figure 3.3 Diagram of wave terminology and dynamics 32
Figure 3.4 Onshore and offshore sweep zones depicting 'cut and fill' profiles 34
Figure 3.5 Wave Refraction processes in the upper Derwent River 35
Figure 3.6 Processes involved in Longshore Current formation 39
Figure 3.7 Wave and seawall interaction processes 46
Figure 4.1 Shoreline comparison for Long Beach, 1947-1967 56
Figure 4.3 Shoreline comparison for Long Beach, 1973-1981 58
Figure 4.4 Shoreline comparison for Long Beach, 1981-1988 59
Figure 4.5 Shoreline comparison for Long Beach, 1988-1998 60
Figure 4.6 Shoreline comparison for Long Beach, 1947-1998 61
Figure 4.7 Digital Elevation Model map for Long Beach and surrounding areas 62
Figure 4.8 Digital Elevation Model for Long Beach and surrounding areas. 63
LIST OF PLATES
Plate 2.1 Aerial Photograph of Long Beach and surrounding regions, 1998 11
Plate 2.2 View from Long Point to Blinking Billy Point, Sandy Bay 12
Plate 2.3 View from the southern end of Long Beach towards Long Point, Sandy Bay 12
Plate 3.1 Swell wave breaking on Long Beach, June 2000 32
Plate 5.1 The outfall pipe on Long Beach 62
Plate 5.2 The seawall on Long Beach, August 2000 63
Plate 5.3 Damage on the Long Beach seawall 63
Plate 5.4 Wave impact and reflection off the Long Beach seawall 64
Plate 5.5 Wave reflection and scouring on the seawall 64
Plate 5.6 Sand on the path behind the Long Beach seawall as a result of wave action 67
[image:9.595.104.550.73.719.2]LIST OF TABLES
Table 2.1 Joint wave height- wave period occurrence (percentage) for Wedge Island 16
Table 4.1 Aerial photograph information 46
Chapter 1 - introduction
CHAPTERl
INTRODUCTION
l.lBACKGROUND
The coastal environment is constantly changing. The influence of numerous coastal processes
leads to the development or erosion of coastal landforms at several spatial and temporal scales. To understand the dynamic nature of coastal regions we must first investigate the factors that lead to
these changes. To successfully manage and protect the coastal environment for present and future use, and for aesthetic reasons, we must understand the nature of the change in order to address the
problems.
Sandy beaches are one such coastal environment that are constantly changing in response to coastal
processes. Beaches occur on all sedimentary shorelines exposed to waves and are amongst the most dynamic physical systems on the earth's surface (Davies, 1980). Worldwide, the estimate of
sandy beach coastline ranges from 11 %(53 000 km) to 34 % (170 000 km) (Short, 1999). In Australia, sandy beaches account for approximately 60% of the total coastline (Short, 1999).
Both wind and water act on the sandy coastline in the form of aeolian transport, waves and currents
to remove or deposit sediment within the coastal environment. Beaches are dependent on waves and sediment but are independent of all other surface processes, as a result beaches occur at all
latitudes around the globe (Short, 1999). Beaches are modified by a range of processes including
tide and wind, and parameters such as sediment type, biota, air and water temperature, and water
chemistry (Short, 1999).
Tasmania has 4792 km of coastline, however, of this only 100 km of coastline is protected within
National Parks (Watt, 1999). As a result, the majority of Tasmania's coastline and sandy beaches are subject to the ever increasing impacts resulting from human use and development, and also
Chapter 1 - Introduction
For several decades the Tasmanian coastline has been influenced by human use through: the construction of coastal defence structures; recreational activities; sand extraction; and the introduction of exotic sand binding flora (Davies, 1980). These factors have contributed greatly to the changes witnessed along the majority of the Tasmanian coastline. Efforts have been made to
manage and conserve Tasmania's coastal environment, however without a proper understanding of the nature of change many of these efforts have proven futile (Davies, 1980).
Human-induced pressures accelerate rates of change and highlight the need for management and conservation of coastal areas (Baily, 1996). The increasing number of people utilizing the coastal zone is resulting in greater impacts on sandy beaches. Dune erosion, foreshore development and the construction of coastal defence structures, to halt shoreline retreat and protect foreshore regions, are just some of the impacts which are accelerating changes to the coast.
An increase in demand, and a subsequent rise in value, of land in the coastal zone has placed a strong dependence on the protection of sandy beaches. In many cases the presence of the coastal foreshore is a major factor in the location of resorts and tourism facilities, and reflects the high real estate value of those areas.
The need to protect the coastal foreshore has resulted in the wide-spread use of coastal defence structures. The implementation of coastal engineering structures has severely restricted the dynamic nature of the coastal environment (Cooke and Doomkamp, 1990). Beaches are no longer able to change in response to the seasonal conditions or the dominant wave climate. The cyclic nature of sediment transport has been altered through the development of the foreshore and the presence of defence structures (Viles and Spencer, 1995).
Engineering structures can lead to changes in sediment transport within a system and can have severe impacts on the nourishment of beaches (Bailey eta!. 1996). In many cases in Australia, and in the rest of the world, the construction of coastal defence structures has not only failed to resolve the particular problem but has contributed to the deterioration of the situation and the instigation of numerous secondary effects (Evans, 1992). The failure of numerous coastal defence structures has been related to a lack of understanding of the geomorphological processes in operation.
Chapter 1 - Introduction
subject to a range of coastal processses including: southerly swell and wind waves, northerly wind waves, longshore currents and tidal currents. A combination of tide and swell induced currents, seawall scouring, and a dominance of southerly winds has resulted in large scale erosion of Long Beach since the early 1950s.
In March of 1908 the first timber seawall was constructed on the foreshore of Long Beach, Sandy Bay in an attempt to halt coastal erosion. In 1940 a longer concrete seawall was constructed. Since the initial construction of these coastal defence structures, constant repairs have been required due to wave impact. It appears that the construction of the original concrete seawall caused Long Beach to change from a stable beach system, consistently recovering from erosion events, to an undernourished, unstable beach. From these early stages of coastal engineering several efforts have been made to restore Long Beach to its original condition.
The main objective of coastal engineering structures is to prevent the erosion or flooding of the coastal zone, while the fundamental objective of coastal management is to satisfy the demands on coastal resources without degrading the coastal environment (Evans, 1992). To successfully manage and maintain the coastal environment in the present day, both human and natural processes impacting on a region must be addressed and a solution found that ensures the long term presence and amenity of coastal areas.
1.2 PREVIOUS STUDIES ON THE AREA
Several studies have been carried out on the Long Beach and Nutgrove Beach (Sandy Bay Beach) coastal foreshore areas of Sandy Bay and reports produced. A nu,mber of studies have been commissioned by the Hobart City Council (HCC) in an attempt to identify the coastal processes operating and total sediment movement occurring within the Long Beach-Nutgrove Beach system. Previous geomorphological studies have examined the long term erosion problems present on Long Beach and suggested possible means to halt the retreat of the shoreline and protect the valuable foreshore. The earliest study of the region was carried out by Cruise (1978). This report provided predominantly historical information as far back as 1834 in relation to meteorological data, hydrographic data, tidal data, map summaries and major accretion and erosion occurrences. The report by Cruise (1978) included a detailed engineering chronology of the Nutgrove Beach, Long Beach foreshore and reserve from 1834 to 1977, and also made mention of possible reasons for the decline in form of Long Beach. Here, it was suggested that a shift in the balance between northerly
Chapter 1 -Introduction
and southerly winds resulted in a net sediment movement north, towards Nutgrove Beach. In addition, it was suggested that land reclamation at Blinking Billy Point may have reduced sediment
supply onto Long Beach from the south.
Further geomorphological studies into the estuarine beaches of Sandy Bay have been conducted by Carpenter (1984). The report summarises the work, up to that point, investigating beach erosion,
and suggests methods to maximise foreshore protection and appearance. Included in the suggestions were several options and designs for sloped seawalls, and a range of costs for various rehabilitation options. The Carpenter report also mentions the significance of sand lost to the onshore system and the problems brought about by wave reflectance from a vertical seawall. Outlined in the report is a discussion of the processes related to turbulence and scouring associated with seawalls.
More recent investigations into Long Beach include those by Kinhill Engineers (1994) and
Patterson and Britton (1998). The first such report was the Sandy Bay Beach Redevelopment
Study undertaken in 1994 by Kinhill Engineers Pty Ltd. This report involved a high degree of
on-site field work resulting in detailed bathymetric charts, current measurements and seabed sampling. A primary focus of the report was the development of new ideas on the coastal processes acting in
the region. These included detailed measurement and interpretation of the tidal currents operating
in the study area, wind analysis and seabed sampling. The Redevelopment Study also contained views from the local population as to the possible causes of the erosion problems and possible solutions.
Chapter 1 - Introduction
1.3 AIMS AND OBJECTIVES
The principal aim of this thesis is to study the long term morphology and shoreline change of Long Beach and surrounding areas, and investigate the relationship between form and process in the study area. In addition to this primary objective there exist several objectives:
1) to effectively utilise aerial photography and Geographic Information Systems to monitor the changes in shoreline position of Long Beach during the period 1947 to 1998;
2) to assess the rate of change in shoreline position of Long Beach by analysing the rate of sediment movement within the Long Beach-Nutgrove Beach system; and
3) to investigate the effect of the seawall on rates of erosion on Long Beach, and to study the possible effects resulting from the construction of further coastal defence structures.
1.4 STRUCTURE OF THE THESIS
This thesis consists of six chapters. The first chapter includes a background to the coastal environment, with emphasis on the Tasmanian coastline and in particular the estuarine beaches of Sandy Bay. A brief history and overview of the erosion problem will be provided, outlining significant occurrences in the history of Long Beach. Chapter One also provides a brief overview of previous studies conducted in the Long Beach-Nutgrove Beach system, and identifies the objectives of the thesis.
The second chapter of the thesis provides a background to the study area. This chapter presents the location of the study area; regional setting; climatic conditions; vegetation; and past and present land use. Geological and geomorphological information will also be included in this chapter.
Chapter Three details information related to the coastal processes operating within estuarine beach systems and the formation of coastal landforms. The third chapter also outlines the various methods used to measure, monitor and predict coastal processes and coastal landforms. Also included in this chapter is a discussion regarding the influence of specific processes on the morphology of Long Beach.
Chapter 1 - introduction
The methods and techniques used during the investigation into the long term changes in shoreline position of Long Beach since 1947 are presented in Chapter Four. Provided in this chapter is an
overview of the methods used and sources of data inaccuracy and error within the methodology. Within the discussion of these results the more significant changes in the shoreline position will be linked with the chronology provided in the report by Cruise (1978).
Chapter Five contains the results of the study. Included in this chapter is the graphical output generated using GIS, including shoreline change maps and Digital Elevation Models. In addition a discussion of the results is presented. Also included in this chapter is a discussion on the possible influence of coastal processes and engineering structures on the shoreline of Long Beach.
Finally, Chapter Six summarises the results of the study and makes recommendations for the future management of Long Beach, including the preferred rehabilitation option identified by Patterson
Chapter 2 -Background to Study Area
CHAPTER2
BACKGROUND TO STUDY AREA
This chapter provides an outline and description of the study area. Included is information
related to the location and physical environment of the study area, incorporating discussions on climate and geological characteristics, past and present land use, and flora and fauna.
2.1 LOCATION AND ACCESS
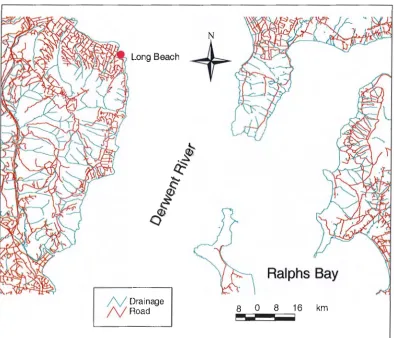
Long Beach is located in lower Sandy Bay on the western shore of the Derwent River, approximately 3 kilometres south of the Hobart CBD as shown in Figure 2.1. Long Beach is located between Blinking Billy Point to the south and Sandy Bay Point (Long Point) to the north, forming Little Sandy Bay.
Long Beach is orientated in a n01th-south direction. The headlands to the north and south of the beach therefore provide some protection from the wind and swell waves from the north, north
west and south east (Plate 2.2). Swell waves from the south have been shown to refract around Blinking Billy Point and impact on the shoreline, causing erosion (Patterson and Britton, 1998).
The deep water channel of the Derwent River passes close to Sandy Bay Point forming a sharp
dropover from the foreshore into the channel (Kinhill, 1994). As a result, Sandy Bay Point is severely eroded during periods of significant swell from the dominant directions of the north and southeast. However, wind blown sand from Long Beach and Nutgrove Beach has been stabilised
in vegetated dune systems on Sandy Bay Point.
Long Beach is located off Sandy Bay Road and has a road and carpark located behind the seawall
over the majority of its length (Plate 2.3). A walking track is located along the entirety of the seawall from Sandy Bay Point to Blinking Billy Point and is used for recreational purposes.
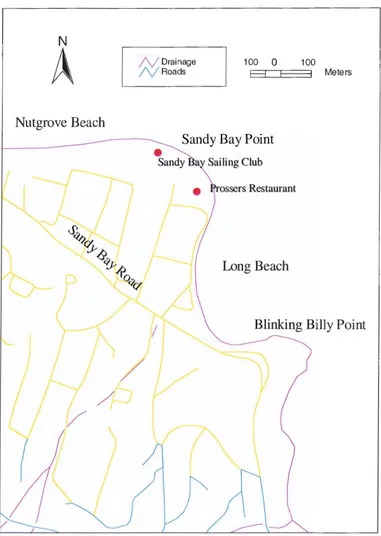
Wrestpoint Casino is located on the western end of Nutgrove Beach, while Sandy Bay Sailing Club, Regatta Pavilion and Prossers Restaurant are situated on Sandy Bay Point (Figure 2.2).
Chapter 2-Background to Study Area
0
·
~
Long Beach
+
"-'-
~,...___
Ralphs Bay
N Drainage
N Road 8 0 8 16 km
[image:17.595.116.510.336.674.2]N
A
Nutgrove Beach
N Drainage N Roads
Chapter 2 - Background to Study Area
100 0 E3
100
Meters
[image:18.595.118.499.124.660.2]Sandy Bay Point
Figure 2.2 Study Area (DPIWE, 2000).
•
Sandy Sailing Clubossers
RestaurantLong Beach
Blinking Billy Point
Chapter 2-Background to Study Area
Nutgrove Beach is located to the north of Sandy Bay point and, in addition to Long Beach,
Blinking Billy Point and Sandy Bay Point form a closed system in which sediment is transported
(Carpenter, 1984). Nutgrove Beach is aligned in a northerly orientation and increases in width
with proximity to Sandy Bay Point, the western end of the beach is predominantly rock with
Chapter 2-Background to Study Area
Plate 2.1 Aerial Photograph of Long Beach and surrounding regions, 1998.
Scale 1: 12, 500.
Chapter 2- Background to Study Area
Plate 2.2 View from Long Point to Blinking Billy Point, Sandy Bay.
Chapter 2- Background to Study Area
2.2 CLIMATIC CONDITIONS
The climate of south-eastern Tasmania, including the Sandy Bay reg1on, is considered to be
temperate maritime, with an above average evaporation rate resulting in the net loss of water
(Tasmanian Conservation Trust, 1978). Climate data for the study area was obtained from the
Ellerslie Road weather station, located 3 km north west of Long Beach ( 42.53° S; 147.19° E).
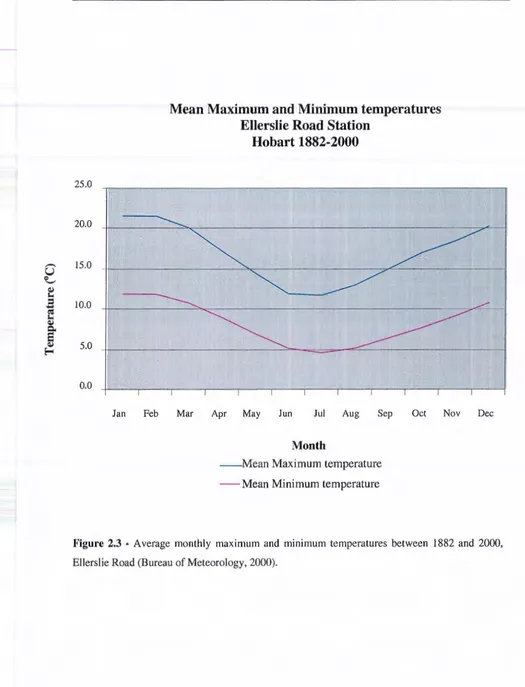
Temperature averages recorded at the Ellerslie Road weather station range from an average
maximum of 22°C in February to l2°C in July; and minimum average temperatures of l2°C in
February and 4°C in July. The highest average temperature maximum was 25°C recorded in
February; the lowest recorded average minimum temperature was 3°C in June and July (Figure
2.2).
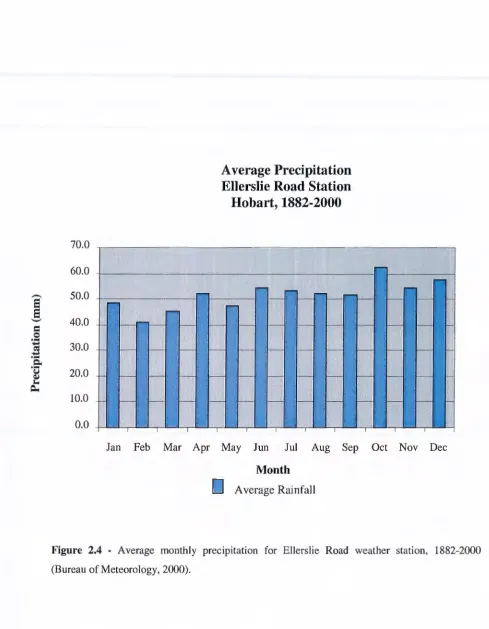
Rainfall within the south-eastern Tasmania region has been recorded at approximately 600 mm
per annum, but can vary greatly with distance to the south and east. An average annual rainfall of
621 mm has been recorded at Ellerslie Road station over the period 1882 to 2000. Extreme
annual precipitation has been recorded as high as I I 04 mm and as low as 390 mm. In Figure 2.3
it can be seen that the average precipitation is highest in October, however there is little variation
in precipitation between months.
,.-...
u
0 [image:23.595.15.540.72.759.2]-
~ ;..=
... ~
;.. ~
c.
5
~ E-;25.0
20.0
15.0
10.0
5.0
0.0
Chapter 2- Background to Study Area
Mean Maximum and Minimum temperatures
Ellerslie Road Station
Hobart 1882-2000
Jan Feb Mar Apr May Jun Jul Aug Sep Oct Nov Dec
Month
- -
Mean Maximum
temperature
- -
Mean Minimum temperature
Figure 2.3 • Average monthly maximum and minimum temperatures between 1882 and 2000,
-
s
s
.._.,
c
0·-
-
s
·a
·-
C.l~
""'
~70.0
60.0
50.0
40.0
30.0
20.0
10.0
0.0
Chapter 2 -Background to Study Area
Average Precipitation
Ellerslie Road Station
Hobart, 1882-2000
Jan Feb Mar Apr May Jun Jul Aug Sep Oct Nov Dec
Month
IJ
Average Rainfall
Figure 2.4 - Average monthly precipitation for Ellerslie Road weather station, 1882-2000
(Bureau of Meteorology, 2000).
[image:24.595.37.526.103.732.2]Chapter 2 -Background to Study Area
Winds recorded at the Ellerslie Road weather station show significant daily variation, however
detailed studies by Cruise (1978) showed that dominant wind directions are from the north-west
and south-west quadrants with a south-east sea breeze during the summer months.
2.3.1 Wave Climate
Swell data was recorded by the CSIRO from wave buoys near Wedge Island in Storm Bay,
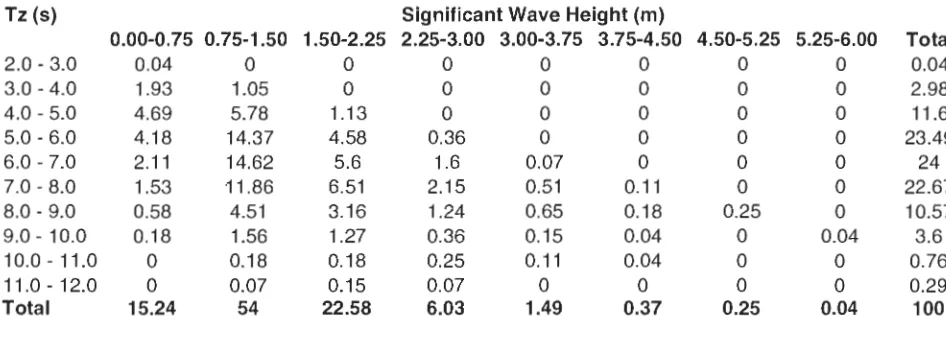
however only one year of data has been recorded ( 1993). Wave data is included in Table 2.1. The
data compares a range of swell periods in seconds (Tz) to the probability, in percentage, of wave
height ranges occurring. The data may be used to gain an understanding of the frequency of
waves of varying size impacting on Long Beach - and the resulting erosion potential of the
waves. Interpreting the data, it can be seen that incoming waves reduce as wave height increases
and wave period increases.
Table 2.1 Joint wave height- wave period occurrence (percentage) for Wedge Island (CSIRO,
1993).
Tz (s) Significant Wave Height (m)
0.00-0.75 0. 75-1.50 1.50-2.25 2.25-3.00 3.00-3.75 3.75-4.50 4.50-5.25 5.25-6.00
2.0- 3.0 0.04 0 0 0 0 0 0 0
3.0-4.0 1.93 1.05 0 0 0 0 0 0
4.0- 5.0 4.69 5.78 1.13 0 0 0 0 0
5.0-6.0 4.18 14.37 4.58 0.36 0 0 0 0
6.0-7.0 2.11 14.62 5.6 1.6 0.07 0 0 0
7.0- 8.0 1.53 11.86 6.51 2.15 0.51 0.11 0 0
8.0- 9.0 0.58 4.51 3.16 1.24 0.65 0.18 0.25 0
9.0-10.0 0.18 1.56 1.27 0.36 0.15 0.04 0 0.04
10.0 -11.0 0 0.18 0.18 0.25 0.11 0.04 0 0
11.0 -12.0 0 0.07 0.15 0.07 0 0 0 0
Total 15.24 54 22.58 6.03 1.49 0.37 0.25 0.04
It can be seen that the most prevalent wave setup acting in the area is low wave height with
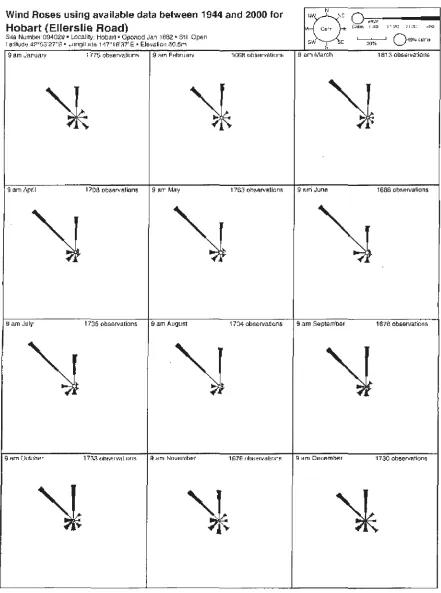
mid-range wave period. Wind roses, constructed using data from Ellerslie Road weather station
between 1944 and 2000, are presented in Figure 2.5.
Total 0.04
[image:25.595.88.561.435.608.2]Chapter 2- Background to Study Area
2.3.1.1 Swell Waves
Swell generated in the Southern Ocean travels into Storm Bay, refracts in the area of the John
Garrow Light and impacts upon the shoreline of Long Beach (Patterson and Britton, 1998).
Although no long term swell data records exist, pictures and video of swell at Long Beach have
shown that breaking waves of up to I metre in height have occurred. Numerical modelling
conducted by Lawson and Treloar ( 1998) estimated severe swell heights to be in the range of I to
1.2 metres.
2.3.1.2 Wind Waves
Wind waves in the study area can be largely interpreted from the wind roses presented in Figure
2.4. The wind roses show that the dominant wind direction is from the north and north west
during all months. North west winds are strongest during late autumn and during winter and
weakest during the summer months. Southerly sector winds are minimal during the whole year
except December and January where south east winds are stronger.
This data suggests that during the year there is a very high north to south wind ratio. Given the
sho11 northerly wind fetch in the study area, the strong north and north west winds would produce
wind waves with high erosion potential. Given the high strength and frequency of no11herly
sector winds, resulting currents would suggest sediment is being transported from the north to the
south, removing sediment from Nutgrove Beach to Nourish Long Beach.
The low proportion of southerly waves cannot be directly linked to the frequency of southerly
swell waves occurring. Swell waves are generated over long distances from where the data used
in this study was recorded.
From this wind data it could be hypothesised that there is a large north to south movement of
sediment within the study area. However, due to the influence of currents and tides within the
region, this is not the case, and will be discussed further in chapters three and five.
Chapter 2 -Background to Study Area
Wind Roses using available data between 1944 and 2000 for Hobart {Ellerslie Road)
s,te Nu~1b~r 094029 • Locality: Hob~n • Opened Ja, 1882 • 5til Open
! e:itl..Jd~ .:1:":.0!)3'27"~. ~ongii.J(tA 1-17'11g'37' E. E.h~·Ja1iCI1 ~10.5M ~ 775 otn>erv~.tions 9 ;:un FehriJct ry
170S OO.'WVRiions
Dam Jull' 1 l35 obsorvations 9 am August
1 tJfJR ohSHPJrllimn;
1763 l)h~"'"'Riion~
1 7~ observations
16?f: oJ:u;~rvaL~m·!=i
N tN \~
., C£l1T
5\'V [
f,
9 <>ro l\1il.fCh 1813 ollstrva:ic :lb
9 1;rri June 1686 obMrvalions
9 am ~ptembsr 1 e1e observations
17 30 observ!ltions
Figure 2.5 Wind Rose data for the Ellerslie Road Weather Station between 1944 and 2000
[image:27.595.104.545.93.686.2]Chapter 2 -Background to Study Area
2.3 GEOLOGY AND SOILS
A brief description of the geology of Long Beach and surrounding areas was included in studies
conducted by Carpenter ( 1984) and later by Patterson and Britton ( 1998). Several detailed
studies into the geology of the region have been carried out, the ease of access to the study area
and the presence of large road cuttings and wave-cut platforms has lead to numerous reports. The
first geological reference to the region was by Darwin (1844 ), who noted the presence of basaltic
lava and brecciated scoria on the west side of Storm Bay (Spry, 1955). Further studies were
carried out by Johnston (1881), White and Macleod (1898), Petterd (1910), Noetling (1913),
Au rousseau ( 1926), Edwards ( 1949) and also Carey and Banks ( 1955).
Sandy Bay Point, in the north of the study area, has been defined as an estuarine cuspate foreland
containing deep sand and shell deposits (Carpenter, 1984). To the south of Long Beach, Blinking
Billy Point is characterised by complex deposits of basaltic rock, possibly volcanic in origin
(Spry, 1955). Triassic sandstone deposits are common throughout the study area and have been
suggested as a possible sand source (Spry, 1955).
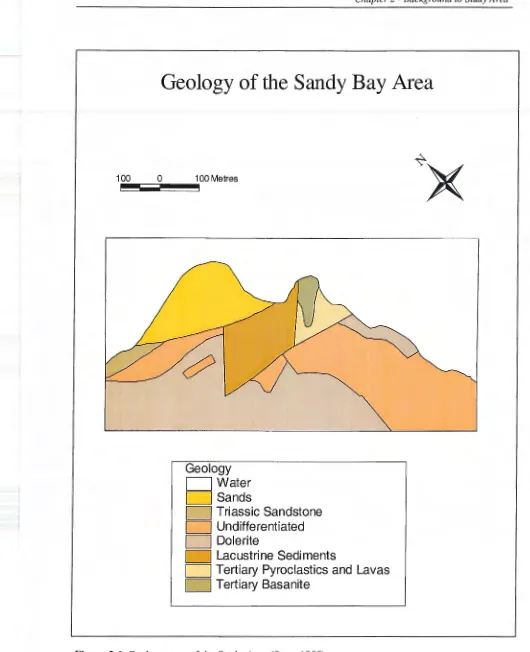
The geology of the study area is described as being a combination of coarse and fine-grained
pyroclastics overlying Tertiary lacustrine beds, with a thick layer of Tertiary rock forming a
faulted block (Spry, 1955). The presence of Permian and Triassic sediments and Jurassic Dolerite
has also been noted (Spry, 1955). The various geological strata present in the Long Beach region
are illustrated in Figure 2.6.
The boulder bed exposed at the large road cutting at Blinking Billy Point is indicative of the
Tertiary rock system present in the area. Permian sediments, pebbles and also, to a lesser extent,
sand are present within this region varying in size from clay to boulders, with a wide size
distribution (Spry, 1955). The texture of the Tertiary material is typical of till, landslide debris or
mudflow material (Spry, 1955).
The wave-cut platform on the promontory south of Blinking Billy Point has exposed a diverse
range of volcanic rock. Basanite, tuff and volcanic breccia have all been recorded and are
strongly folded (Spry, 1955). The pocket beaches to the no1th and south of Sandy Bay Point have
been shown to contain a shingle layer at a depth of I to 2 metres, which acts as a buffer in the
event of severe erosion (Carpenter, 1984).
Chapter 2 -Background to Study Area
Geology of the Sandy Bay Area
100 Metres
~~~~
100 0
Geology
c=J
Water
c=J
Sands
c=J
Triassic Sandstone
c:=J
Undifferentiated
c=J
Dolerite
c:=J
Lacustrine Sediments
[image:29.595.15.545.68.720.2]c=J
Tertiary Pyroclastics and Lavas
c=J
Tertiary Basanite
Chapter 2 -Background to Study Area
During the last sea level rise 6000 years ago sand was transported onto the present day coastline
and into the lower reaches of the Derwent River estuary (Davies, 1980). Over the past 6000 years
since the initial sand deposition, the shoreline has been shaped by the dominant southerly swell,
resulting in the movement of sediment to the north. The presence of rocky outcrops to the south
of Blinking Billy Point, to the north of the study area and to the west of Sandy Bay Road suggests
the sand plain is a depositional feature (Spry, 1955). Past survey plans have noted the presence of
remnant dunes over the sandy plain, supporting the suggestion that the sand plain is a depositional
feature. The growth of the frontal dune on Nutgrove Beach over the last forty years indicates that
the formation of the sandy plain is still continuing. Estimations indicate that over the last 6000
years, 1.5 million m3 of sand has accreted to form this landform - an average annual sand supply
of 250 m3/year (Patterson Britton and Partners, 1998).
2.4 HISTORY OF LAND USE
2.4.1 Commercial Operations
In 1813 land in the Nutgrove Beach-Long Beach area was bought and farmed, the first
landholders in the area being documented as Messrs Walford, Cropper, Fisher, Cmtwright and
Pitcairn (Cruise, 1978). The purchase of 2 units of land at the southern end of Long Beach in
1815 signified the importance with which the Crown viewed the beaches.
Early reports indicate that the backdune area of Sanely Bay Point was extensively logged during
the mid 1800s removing much of the native vegetation (Carpenter, 1984).
2.4.2 Recreation
The beaches of Sandy Bay, and in particular Long Beach, were used extensively for recreational
purposes during the 19th and 20th centuries. Horse racing was conducted in the area as early as
1816 in order to "ease the dull monotony of Hobart Town," as was reported in 1827 (Cruise,
1978). Horse racing was a common past time up until 1844 (Carpenter, 1984).
The extension of the Sandy Bay tram system to include Long Beach and Nutgrove beach in 1913
resulted in an increased number of people using the beach area. In 1919 further developments of
the Sanely Bay foreshore were made in the construction of croquet lawns, bathing boxes, tea
Chapter 2 -Background to Study Area
rooms, diving platforms and sanitary facilities (Cruise, 1978). In 1924-25, a bowling green and
two grass tennis courts were constructed, increasing the recreational value of the area (Cruise,
1978).
2.5 PRESENT LAND USE
The Long Beach-Nutgrove Beach foreshore has been developed considerably and is now used by
a number of user groups to address a range of needs. The foreshore is used frequently throughout
the year for a range of recreational purposes, while the region to the rear of the beach extending
back to Sandy Bay Road has grown into a significant retail and commercial center, providing the
residents of lower Sandy Bay with goods and services.
2.5.1 Commercial and Residentiallanduse
In 1932 sub-division of the land behind Nutgrove beach began (Cruise, 1972). Since the initial
construction of residential properties, building has spread along the entire foreshore of Nutgrove
Beach and Blinking Billy Point. Long Beach and Long Point have not been subdivided and
remain the property of the Crown. As previously mentioned, the area to the rear of Long Beach
and Nutgrove Beach has been developed extensively and includes several small shops and
commercial operations.
In recent decades commercial properties have extended from the central zone of Sandy Bay Road,
down Beach Road towards the Long Beach foreshore. Several commercial operations exist
within the boundaries of the study area.
2.5.2 Recreation
Recreation is perhaps still the most common use of the Sandy Bay foreshore. The region is used
year-round for a range of activities including: sailing, walking, jogging, windsurfing and general
relaxation. The decline in the water quality of Little Sandy Bay due to upstream pollution has
resulted in a decline in the use of the beaches for water based activities, such as swimming and
fishing. The gradual widening of Nutgrove Beach and the development of its dune system over
past decades has resulted in an attractive beach environment which is popular with the people of
Chapter 2 -Background to Study Area
erosion of Long Beach. The narrowing of Long Beach has also lead to a shift in beach use to
Nutgrove Beach. The walking tracks on Blinking Billy Point and Long Beach foreshores are
regularly used by local residents for the walking of dogs and other activities. The Sandy Bay
Sailing Club is located on the northern side of Long Point and is one of the largest sailing clubs in
greater Hobart.
2.6 VEGETATION
Intensive logging of Long Point and surrounding areas between 1834 and 1860 resulted in the
loss of much of the native vegetation. However, from notes included in the report by Cruise
(1978) early vegetation species present in the Nutgrove Beach, Sandy Bay Point area included
honey suckle (Banksia marginata), coast wattle (Acacia sophorae) and several Eucalyptus
spec1es.
Although intensive development of the hind-dune area of Long Beach and Nutgrove Beach has
seen the construction of car parks, roads, seawalls and buildings there still remain small pockets
of remnant vegetation.
The developed dunes on the eastern end of Nutgrove Beach have been stabilised to a significant
degree by the presence of the introduced species marram grass (Ammophila arena ria), which in
some areas has been replaced by coast wattle (Acacia sophorae) through succession. The origin
of the marram grass (Ammophila arenaria) is believed to be from a funded planting along the
foreshore in 1921 (Cruise, 1978). Coast wattle is the dominant vegetation type throughout the
dune system, however species diversity is low within the study area. Behind the seawall on Long
Beach an area of the foreshore has been fenced and man·am grass (Ammophila arena ria) planted
in an attempt to develop a dune system and hence a buffer for the protection of the seawall.
Throughout the study area isolated blue gum (Eucalyptus globulus) spec1mens have been left
during development. Their size indicates an origin from the late 19th century or early 20th
centrury. In addition to the natives already mentioned, there exists a large range of exotic
species, the most prolific species being the pine (Pinus radiata). Stands of pine are found in the
parkland to the rear of Long Point and also behind the seawall of Long Beach.
Chapter 2-Background to Study Area
2.7 HUMAN IMPACTS
Human impacts on the Sandy Bay foreshore since early European settlement have resulted in a
number of changes in the study area, patticularly to the coastal environment. The construction of
buildings, concrete roads and carparks and the use of both timber and concrete seawalls to protect
the foreshore have resulted in vast changes in the orientation and width of Long Beach and
Nutgrove Beach.
The first recorded shoreline position of 1834 indicated that Long Beach was 30 metres wider than
it is today and that Nutgrove Beach was at the same position as today (Cruise, 1978). Some thirty
years later, the centre of Nutgrove Beach had receded by I 00 metres, this sand widening the
southern end of Long Beach (Cruise, 1978).
In 1908 the first seawall constructed from timber was erected along Long Beach at the high tide
mark (Cruise, 1978). Immediately after, Beach Road was constructed behind the seawall. The
excavation required for the construction of Beach Road resulted in large amounts of sand being
pushed onto Long Beach. Between August 1906 and March 1908, 15 000 cubic yards of sand
had been deposited (Cruise, 1978). The construction of the seawall greatly altered the natural
cycles of erosion and deposition that previously existed on Long Beach. Scouring and wave
reflection from the vertical structure resulted in increased erosion during storm events.
The subdivision and property development along the Nutgrove Beach foreshore in 1932 greatly
impacted on the closed sediment cycle existing within the study area. The construction of fences
and cut-off walls at the seaward boundaries of properties resulted in sand being trapped within
this region and not being recycled to renourish other regions in the system. The construction on
Nutgrove Beach resulted in the beach being unable to respond to variations in climatic conditions
(Kinhill, 1994). The construction of housing on the Nutgrove Beach foreshore also lead to the
problem of wind blown sand being transported onto these properties. To alleviate this problem
sand trapping fences were constructed and vegetation planted. As a result the frontal clune along
Nutgrove beach was stabilised.
Between 1938 and 1940 the seawall at Long Beach was replaced with a concrete seawall. In
Chapter 2- Background to Study Area
SITE 11
--- --- :. --- SITE 6
---/-
--/.-14 flCIST G TRE S
/~
(
l
>->- \
--Er_~
~;
~5 ill
~0 '
a..m jl
SITE 15
/( EXISTING SEAWALL
..._...,-,,~=""'· =-"'~~..,!!__\.\ ~ ~ TIUL R.UrZ
~
-=-::
TYPICAL SEC
T
ION
S
I
T
E 16 (EX
I
S
TI
NG
)
:
_::: _:
L
ONG BEA
CH
[image:34.595.37.547.61.668.2]EXISTING PROHI, ADE
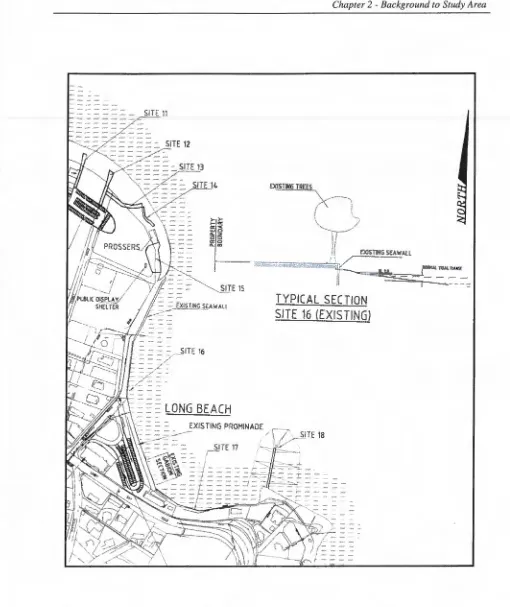
Figure 2.7 Diagram of Long Beach and surrounding areas, showing the location of the seawall,
existing gab ion section and a cross-sectional profile of Long Beach (Patterson and Britton, 1998).
Chapter 2 -Background to Study Area
an additional sixty metres to protect the Regatta Pavillion (Cruise, 1978). Since the initial
repairing of the seawall, several storm events have occurred which necessitated further repair
work.
Further construction work was carried out on Long Beach in 1961. Land reclamation at Blinking
Billy Point, for the construction of an extended sewerage outfall, resulted in Blinking Billy Point
protruding further into the Derwent River. As a result, southerly swell waves were refracted
around the point. The realignment of incoming swell impacting on the beach resulted in erosion
from different regions of Long Beach (Cruise, 1978).
2.8 CHAPTER SUMMARY
The Sandy Bay foreshore, including Long Beach and Nutgrove Beach and adjacent points, has a
range of geological, climatic and biological characteristics that are unique to the area. The past
and present land uses of the area have created a degree of cultural significance that has sustained
interest in the region.
The vegetation of the study area is limited due to intensive development, however native species
including blue gum (Eucalyptus globulus) and coast wattle (Acacia sophorae) are common, as are
the exotic species man·um grass (Ammophila arenaria) and pine (Pinus radiata).
Human impacts on the study area have been significant and have played a large part in the change
in the evolution of Long and Nutgrove Beaches over the past 50 years. The construction of the
Long Beach seawall, in addition to development on the Nutgrove Beach foreshore have resulted
in substantial changes to the shoreline.
The following chapter will provide an overview of the dynamics of Long Beach and surrounding
Chapter 3- Form and Process
CHAPTER3
FORM AND PROCESS
Chapter Three analyses and discusses literature related to the formation and dynamics of estuarine beach systems. This chapter concentrates on the evolution of Long Beach and Nutgrove Beach in the 50 years since 1947 and also discusses the processes operating within the lower Derwent
estuary. Sediment transfer and cycling within the study area will also be mentioned. The aim of this chapter is to gain an understanding of the coastal processes operating within coastal estuarine beach systems, and to associate these processes with the movement of sediment and the formation
of landforms. The major themes are then discussed in the context of the Long Beach, Nutgrove Beach system.
Section 3.1 provides an introduction to the problems associated with the coastal environment in the global context, with an emphasis on coastal erosion in estuarine beach systems. Section 3.2 also provides an overview of the development and evolution of estuarine beach systems and outlines the processes acting, and their effects, on sediment movement within the study area. Section 3.3 discusses the significance of several meteorological variables on sediment transport, and comments
on the effects of wind direction on accretion and erosion patterns on Long Beach. Section 3.4 focuses on the influence of wave action on a sandy beach system, and makes reference to the types of waves and their effects on Long Beach. Section 3.5 provides an overview of the various types
of currents acting in an estuarine beach system and the influence that they would have on the movement of sediment; in this section the cutTents operating within Little Sandy Bay and Sandy
Bay will be discussed. Section 3.6 will summarise the chapter.
3.1 INTRODUCTION
About 20 % of the world's coast is sandy and backed by beach ridges, dunes, or other sandy deposits. Of this, more than 70 % has shown net erosion over the past few decades (Bird, 1985a in
Viles and Spencer, 1995). In addition to this, 50 % of the population in the industrialised world
lives within one kilometre of a coast. This population will grow at about 1.5 % per year during the next decade (Goldberg, 1994 in Viles and Spencer, 1995).
Chapter 3-Form and Process
As coastal populations grow, problems affecting the coastal environment are becoming more prevalent throughout the world's beaches. The problems affecting coastal areas are diverse and vary with location around the world. However, a common problem affecting sandy coastlines is coastline retreat. The reasons for shoreline erosion can be classified into those that result from changes in the relationship between sea level rise and sediment supply, human-induced pressures on the coastal zone, and the initial signs of human-induced climate change (Viles and Spencer, 1995). Throughout the world human activity is a major influence on the coastal zone. Human influences on the coastal zone may be direct or indirect, and include: dredging operations, extraction of sand and gravel, building of dams to reduce fluvial sediment inputs, reduction in sediment supply from eroding cliffs due to basal protection, and interference with longshore sediment transport from the construction of piers, jetties and breakwaters (Viles and Spencer,
1995).
Natural processes are also largely responsible for changes to the shoreline. The influence of several coastal processes leads to the development and erosion of coastal landforms. The effects of wind, waves and currents on sandy beaches are discussed later in section 3.3.
Owing to increased population, and development of the coastal zone, sandy beaches are no longer able to change and react in response to changing sea conditions. Beaches are being stabilised and infrastructure being built to prevent sand loss and retain the value of land in the coastal zone.
Chapter 3 -Form and Process
Dobson and Williams ( 1977) made several recommendations to help control the erosion at Dodges
Ferry. The recommendations were based on two stages of action, the first being initial work and
construction to reduce erosion. This initial stage involved the stabilisation of the eroding bank, the
repair of blow-outs caused by access tracks, the creation of steps and walkways and the general
maintenance of the area. The second phase of the recommendation was the implementation of an
on-going management programme including, environmental information programmes, monitoring
programmes and the creation of a town plan.
The problem of shoreline retreat on Long Beach is an ideal example of the relationship between
form and process acting on many ocean and estuarine beach systems in Tasmania and the world.
The influence of coastal processes including waves, currents and wind, in addition to the human
induced changes such as coastal defence structures, has greatly altered the morphology of the Long
Beach shoreline over the past 50 years.
The subsequent sections of this chapter will discuss the formation of estuarine beaches and the
influence of several coastal processes on sandy beaches, with an emphasis on shoreline erosion.
The effect that these processes have on Long Beach, and the surrounding study area, will be
discussed. Literature relating to the relationship between coastal erosion and coastal processes will
be discussed in order to fully understand the problems present on Long Beach.
3.2 FORMATION AND EROSION OF ESTUARINE BEACHES
Estuaries are defined as semi-enclosed inlets where saltwater and river water mix (Viles and
Spencer, 1995). Estuaries are found world wide; but are usually more developed in the
mid-latitudes with wide continental shelves and locally rising sea level (Viles and Spencer, 1995).
There are a number of variables that influence the formation of all beach types. First is the
sediment budget and sediment type; second is wave type and wind regime; and finally, biota and
water temperature all play an important part in the formation of a sandy beach (Short, 1999). For a
beach to form there must be an adequate supply of sediment. Sediment within a beach system is
moved by waves and deposited in an accumulation area. For a beach to remain stable the sediment
budget must be balanced or positive, whilst a negative budget will result in the loss of sand from a
beach (Short, 1999). Sediment budgets fluctuate greatly with time and can vary in response to
storm events and season.
Chapter 3 -Form and Process
Sediment type can influence the type and characteristics of a beach that may be formed, and varies
greatly with geographical location. Beaches in the mid to low latitudes are commonly composed of
fine to medium sands, but beaches can be composed of gravel and boulders in the higher latitudes.
Sediment type greatly influences the beach slope and overall morphology of a beach (Short, 1999).
Regional and
Backs
h
o
r
e
z
one
Swash
z
o
n
e
Inter
tidal
zone
earshore zone
[image:39.595.98.562.227.433.2]Surf zone Breaker zone
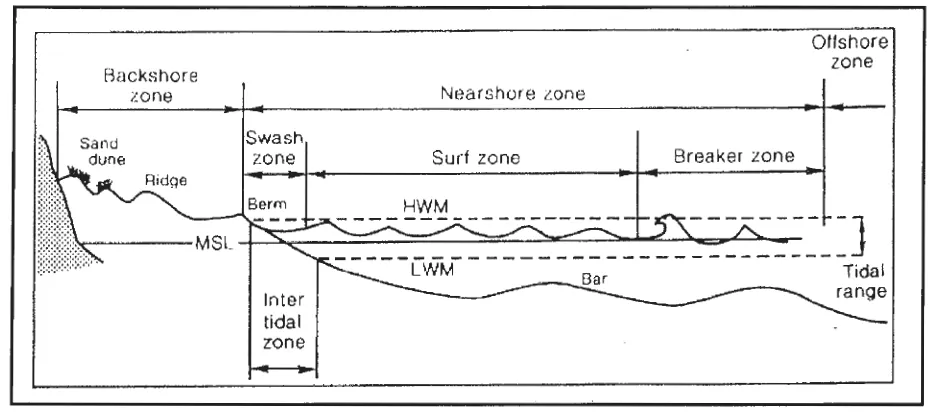
Figure 3.1 The definition of the shore zone regions (Viles and Spencer, 1995).
Offshore
z
on
e
Tidal
local variation in sediment type is governed largely by climate, source rocks, substrate and biota
(Short, 1999).
Wind speed and direction can also contribute greatly to the formation and erosion of beach
systems. Longshore winds can contribute to longshore currents and, as a result, sediment
movement. Strong onshore and offshore winds can contribute to sub-aqueous sediment transport
through downwelling and upwelling currents (Short, 1999). Onshore winds also contribute to
aeolian sediment transport, which will be discussed in greater detail later in section 3.5.
Two primary environmental factors influence the formation of estuarine beaches and often lead to
the narrow, low beach profile characteristic of many estuarine beaches. First, the low wave
Chapter 3 -Form and Process
change in the beach profile (Davies, 1980). Second, the depositional phase of the beach change
cycle is suppressed and the dominance of erosion conditions limits the amount of sediment
available to the beach (Nordstrom, 1989).
The narrow beaches of estuarine and bay systems have limited sand supplies and as a result dunes
are slow to form. Dunes that are established are often destroyed through overwashing during small
storms or spring tides (Nordstrom, 1989). Estuarine sediments are derived from a range of sources
including the drainage basin, the continental shelf and coastal waters, the atmosphere, erosion and
biological activity (Viles and Spencer, 1995) (Figure 3.2). In the majority of estuarine systems
around the world the marine environment is the dominant source of sediment.
TIDAL
~ PROCESSES
0.1 °/oo SALINITY
LIMIT OF TIDAL INFLUENCE
FACIES BOUNDARY BETWIOEN
MARINE (TIDALLY-) lNFLUtNCEO
AND F1.UVIAL SEQip,jENTS
<1--- --·- --ESTUARY!Oalrymple et al11992l
--
·
--
41
-RIVER-&-- -- - - - -ESTUARY !Pritchard71967)
~
- - -RIVER---Figure 3.2 Sediment supply within the marine/estuary environment (Perillo, 1995).
3.3 THE EFFECT OF WAVES ON THE DYNAMICS OF BEACH SYSTEMS
Beaches vary considerably in plan, profile and dynamic behaviour - the wave climate in a given
region is the most influential factor when considering beach morphology (Davies, 1980). From the
initial conception of an ocean swell kilometres offshore, through to the impacting on the beach,
[image:40.595.106.546.307.550.2]Chapter 3 - Form and Process
several changes take place in the characteristics of the wave. Davies (1980) describes these
changes through the defining of three zones - the deep water zone, the intermediate water zone and
the shallow water zone.
In the open ocean waves travel at high velocities, with both high potential and kinetic energy.
Wave movement is in closed circular orbits that have minimal forward movement and transport.
The orbital diameter is equal to the amplitude of the wave and decreases exponentially with depth
(Davies, 1980). At a depth equal to half the wavelength, forward motion ceases - this depth is
defined as the wave base (Bird, 1964). This theory is illustrated in Figure 3.3.
As the wave train moves into shallow water the orbital motion touches the ocean bottom, wave
velocity decreases and, as a result, wave length also decreases. Variations in the bottom contour
can lead to unequal deceleration in the wave resulting in refraction (Davies, 1980). Refraction of
swell waves can in turn result in the realignment of beaches. The dominant wave refraction pattern
will erode and deposit sediment from a beach until the beach is in equilibrium and consistent with
the wave pattern.
CREST CREST
1 - - -- -- WAVE LENGTH-
-ORBITAL
MOTION
OIMINI SHING WITH OEPTH
s
E A(L)
OIREC TION OF
WAVE AOVAN<:;€.
[image:41.595.89.557.390.778.2]FLO OR
Chapter 3 - Form and Process
On-site field work by Ingle (1966) showed that the most reliable indicator of erosion and accretion
on natural beaches is the average breaker height. Increasing deep-water wave steepness has been
shown to be linked with increased seaward sand movement. As a result it can be concluded that
wave height and wave steepness are directly related to the degree of sand movement.
Plate 3.1 Swell wave breaking on Long Beach, June 2000.
3.3.1 Swell waves
The transfer of energy from wind to the sea surface results in the formation of various sea
conditions and currents. The fetch, or distance over which wind blows continuously, determines
the intensity and type of swell (Davies, 1980). Swell waves are formed as a result of consistent
winds blowing over a long fetch and often result from distant storms (Davies, 1980). Swell waves
are formed when they leave the area of wave generation (Short, 1999).
Chapter 3 - Form and Process
Swell waves are characterised by a long wave length, a long period between waves, and a low
wave frequency (Davies, 1980). Once swell leaves the area of generation it transforms to allow
great distances to be travelled with minimal energy loss (Short, 1999). Swell waves decrease in
height, increase in length and become more uniform as they leave the area of generation (Davies,
1980). Swell waves travel in wave groups, sets of higher and lower waves, that contribute greatly
to the energy of the surfzone (Short, 1999).
Swell waves are often associated with the accretion or fill of the beach system. Figure 3.4
illustrates the position of both the onshore and offshore sand accumulation areas, and indicates
cross section profiles during periods of accretion and erosion. The low frequency of inbound
waves allows sufficient time for wave run up to percolate down into the beach surface, depositing
suspended sediment in the swash zone (see Figure 3.1). However, the effect that swell waves have
on a coastal region is largely dependent on the location and orientation of the beach and the
intensity of the swell waves (Davies, 1980).
r On:;h~re sweep
wn~
[image:43.595.126.539.412.591.2]___ Higtt still woter
Figure 3.4 Onshore and offshore sweep zones depicting 'cut and fill' profiles (Davies, 1980).
Swell waves approaching at an oblique angle to the coast result in the longshore movement and
deposition of sediment as a result of littoral drift, this process will be discussed in detail later in
Chapter 3 - Form and Process
The influence of swell waves on an estuarine beach system is dependent largely on the distance of
the beach from the point of refraction and the orientation of the beach. Swell waves lose a large
percentage of their energy, and as a result their ability to move sediment, when refracting around
headlands or other areas of shallow water (Nordstrom, 1992).
Figure3.5 shows refraction patterns for southerly swell waves in Frederick Henry Bay, Tasmania.
It can be seen that the original south west swell has been refracted and impinges on Seven Mile
Beach as a south east swell. This high degree of refraction would result in a large loss of wave
energy. A similar situation exists in bays and inlets around Tasmania, including the Derwent
Estuary where swell waves refract around Blinking Billy Point and impact on Long Beach.
I Mil.(
.___,
Figure 3.5 Wave Refraction processes in the upper Derwent River (Davies, 1958)
[image:44.595.51.553.90.758.2]Chapter 3 - Form and Process
3.3.2 The effect of Southern Ocean Swell Waves on the Study Area
The swell waves that influence Long Beach are produced by strong westerly winds in the Southern
Ocean, with unlimited fetch and storm duration (Patterson and Britton, 1998). The 'Roaring
Forties' formed by deep low pressure systems produce these swell waves. On leaving the
generation area the swell waves are deflected by the Coriolis Force causing them to travel as south
west swell (Short, 1999). The south west swell averages 1.5 to 2 metres in height and has an
average period of 12 seconds (Patterson and Britton, 1998).
Swell waves travel up the Derwent River and are refracted around Blinking Billy Point onto Long
Beach (Carpenter, 1984). The association of swell waves with low pressure systems can result in
unusually high water levels, resulting in a higher wave run up height and over-topping of the
seawall, which exacerbates beach damage. Although swell waves are often associated with
accretion and the regeneration of beaches, this is not the case at Long Beach. Swells refracting
around Blinking Billy Point and breaking onto Long Beach produce plunging waves of up to 1.5
metres with high erosion potential (Carpenter, 1984).
There are only limited long term records for swell waves in the study area. Wave parameters such
as wave height, period and wave direction are limited, making it difficult to gain an overall
perspective on the wave climate. However, CSIRO collected one year of wave data in 1993 near
Wedge Island in Storm Bay. This information suggests a high proportion of waves with low wave
height and mid-range period and is presented in greater detail in section 2.3.1.
The influence of swell waves on sediment movement on Long Beach is discussed further 1n
Chapter Five.
3.3.3 Wind waves
Wind waves are often associated with inconsistent winds blowing over relatively short fetches.
Wind waves are characterised by short wavelengths and period, by a steep wave crest and low rates
of longshore sediment transport (Davies, 1980). The maximum height which these waves will
reach is largely governed by fetch, wind duration, wind direction, wind velocity and water depth