Modeling New Zealand
’
s Log
’
s Supply Chain:
A Two-Tiered Modeling Approach of Logistical Network Resilience
A thesis presented in partial fulfillment of the requirement for the degree
of
Master of Supply Chain Management
At Massey University, Palmerston North, New Zealand
Mohammed Zuhair Hassan Alaqqad
Abstract
The global characteristic of today’s market raise concerns regarding the compatibility between the different nodes within a supply chain. Political, economic, infrastructural, cultural and other risks should be considered when operating globally. Tsunamis, strikes, hurricanes, bio-security threats and wars and their impact on the logistical networks are all examples of major events that might happen in a certain place and affect other supply chain members in other parts of the world. This type of events and their disastrous consequences show the importance of being ready and having a contingency plan for such events to minimize their effect on the companies’ supply chains
The objective of this research is to provide the building bricks of a tool that functions as a decision support system to help practitioners in the log industry deciding their course of action spontaneously in response to sudden major events that might disrupt their supply chains. The resulting decision support system and recommendations of this research aim at improving the resilience of the log supply chain in New Zealand and the logistical network in general. Hopefully, the resulting DSS will be capable of producing recommendations that would increase the profitability of logs supply chain and make it more reliable and resilient under multiple disruption scenarios.
Acknowledgments
Contents
Chapter One: Introduction ... 9
Chapter 2: Literature Review ... 14
2.1- Supply Chain Risks ... 15
2.2-Supply Chain Disruptions ... 18
2.3- Calculating Ports’ Capacities ... 19
2.4-Supply Chain Risk Mitigation ... 21
2.5- Decision Support Systems (DSS) ... 22
2.6- Theory of Constraints ... 25
2.7- DSS Moderating Effect on the Impact of Supply Chain Risks. ... 27
2.8- Research Gap ... 28
2.9- Literature Review Summary ... 29
Chapter 3: Research Objective and Methodology ... 31
3.1- Research Objective ... 33
3.2- Epistemological and Ontological Standing ... 36
3.2.1- Ontological Positions ... 36
3.2.2- Epistemological Positions ... 37
3.2.3- Researcher’s Ontological and Epistemological Positions ... 38
3.3- Appraisal of Different Research Methodologies ... 39
3.4- Data Collection and Analysis ... 41
3.4.1- Data Collection ... 42
3.4.2- Sampling ... 43
3.4.3- Analysis ... 43
3.5- Validity and Reliability ... 45
3.6- Ethical Consideration ... 46
Chapter 4: Macro Analysis and Results ... 48
4.1- New Zealand’s Ports’ Capacities ... 49
4.2- New Zealand’s Forests Distribution ... 52
4.2.1- North Island Forests ... 55
4.2.2- South Island Forests ... 57
4.3- Linear program ... 58
4.4- Linear Program Application ... 66
4.4- North Island Model Results ... 71
4.5- South Island Model Results ... 76
4.6- Sensitivity analysis ... 79
4.6.1- Log Prices. ... 79
4.6.2- Costs ... 80
4.7- Findings ... 82
Chapter 5: Micro Analysis and Results ... 85
5.1- Model Description and Region Selection ... 87
5.1.1- Harvesting ... 91
5.1.2- Primary Transport ... 92
5.1.3- Rail Way ... 93
5.1.4- Road Network ... 94
5.1.5- Ports ... 94
5.2- Results... 97
5.2.1- Wellington Port Closure Simulation (Scenario Zero) ... 97
5.2.2- Exploiting Constraint Number (1): New Plymouth Yard ... 101
5.2.3- Exploiting Constraint Number (2): Train Scaling /Unloading at Napier Port ... 104
5.2.4- Exploiting Constraint Number (3): Ship Arrival Rate at New Plymouth Port. ... 108
5.3- Summary ... 112
Chapter 6: Discussion ... 115
6.1 Conceptual Implications ... 116
6.2.1 Macro Level Analytical tools ... 119
6.2.2 Micro Level Analytical tools ... 120
6.2.3 The Two-tiered Methodology ... 121
6.3 Theoretical Implications... 122
6.3.1 Guidance on integrating Analytical tools ... 122
6.3.2 Hidden Factors affecting Supply Chain Robustness ... 123
6.3.3 Resource Sharing and Theory of Constraints ... 124
6.4 Policy Implications ... 125
6.5 Managerial Implications... 126
6.6 Limitations and direction for future research... 127
Chapter 7: Conclusion ... 129
7.1- Conclusions for Academics ... 130
7.2- Conclusions for Policy Makers and Practitioners ... 131
References list ... 133
Appendices ... 142
Appendix A ... 142
Appendix A.1 Ports Description ... 142
North Island Ports... 142
Tauranga Port ... 142
Wellington Port ... 143
Napier Port ... 143
New Plymouth Port ... 144
Whangarie Port ... 145
Gisborne Port ... 146
South Island ... 147
Nelson Port ... 147
Christchurch Port ... 148
Otago Port ... 149
Invercargill Port ... 150
Timaru Port ... 151
Picton Port ... 152
Appendix A.2 Yield, Processing And Exporting Volumes By District ... 154
Appendix A.3 Model Districts With their Corresponding Exporting Volumes ... 156
Appendix B ... 158
Appendix B.1 (Distances between districts and ports) ... 158
North Island ... 158
South Island ... 159
Appendix B.2 (Distances between districts and train log siding) ... 160
North Island ... 160
South Island ... 160
Appendix B.3 (Rail distances between train sidings and ports) ... 161
North Island ... 161
South Island ... 161
Appendix C (Allocation matrices) ... 162
Appendix C.1 (Primary port Allocation) ... 162
North Island ... 162
South Island ... 163
Appendix C.2 (Secondary port Allocation) ... 163
North Island ... 163
South Island ... 164
Appendix C.3 (Train Sidings Allocation) ... 165
North Island ... 165
Appendix D (Train and trucking rates) ... 166
Port costs (Wharfage +Berthage +Tugs) ... 167
Density Conversion Rates ... 167
North Island ... 167
South Island ... 168
Appendix F (Results) ... 169
North Island Results (Forests Allocation with Quantities) ... 169
South Island Results ... 176
Appendix G Sensitivity Analysis (Forest Allocation Results) ... 183
North Island ... 183
20% Cost decrease ... 183
20% Cost Increase ... 190
20% Price Decrease ... 196
20% Price Increase ... 203
South Island ... 209
20% Cost Decrease ... 209
20% Cost Increase ... 216
20% Price Decrease ... 223
List of Figures
Figure 1 Risks spread across the supply chain (Mentzer, 2001) ... 17
Figure 2 Risks overlap in the supply chain (source:author) ... 18
Figure 3 General supply chain risk mitigation framework, adopted from Ho et al. (2015). ... 22
Figure 4 DSS moderating effect on the impact of exogenous risks on transportation and capacity risks (source: author) ... 28
Figure 5 Logs exports per port in New Zealand, adopted from (NZFOA, 2014). ... 34
Figure 6 World largest round wood trade channels in 2014 Adopted from Bezuidenhout., Pusztai, Christians,& Wilson, (2016). ... 34
Figure 7 The Integration of Macro and Micro Level Analysis in The Proposed DSS ... 45
Figure 8 Total quarterly log volume exported from the port of Tauranga during the period from Jan 2010-Jun 2016. ... 51
Figure 9 New Zealand ports with their corresponding estimated annual log export capacities. ... 52
Figure 10 contribution of different species to New Zealand’s forests, Adopted from (MPI (B), 2017) ... 53
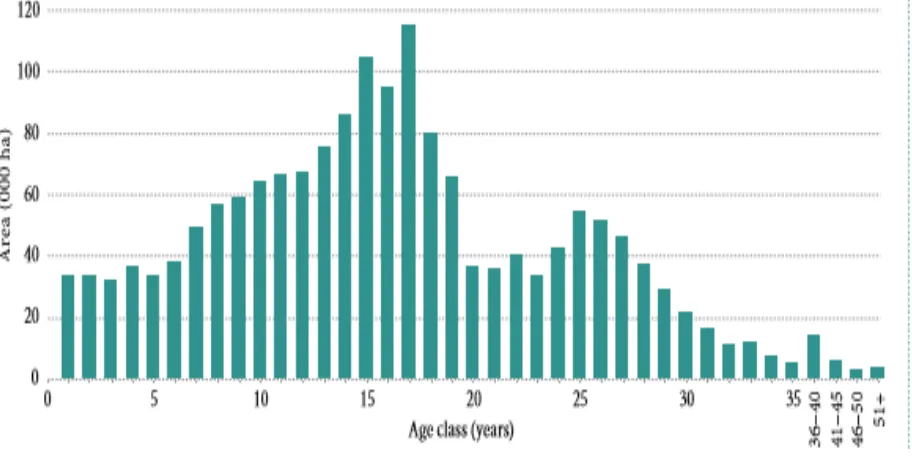
Figure 11 New forest planting (since 1988) and deforestation (since 2005), (Adopted from NZFOA, 2017) . 53 Figure 12 Forest age distribution as at April 2011, adopted from (MPI, 2017 a) ... 54
Figure 13 : Forest age distribution as at April 2015, adopted from (MPI, 2017 b) ... 54
Figure 14 North island’s regions and territorial districts. adopted from (MPI (B), 2017) ... 56
Figure 15 South Island’s regions and territorial districts. adopted from (MPI (B), 2017) ... 57
Figure 16 Costs Included in the Model ... 61
Figure 17 Price Calculation Decision Tree... 70
Figure 18 Waiting Vs Allocated Quantity During Each Closure Scenario ... 74
Figure 19 Cost/ Profit During Each Closure Scenario ... 75
Figure 20 Waiting Vs Allocated Quantity During Each Closure Scenario ... 77
Figure 21 Cost/ Profit During Each Closure Scenario ... 78
Figure 22 Logs Supply Chain Activities ... 89
Figure 23 Forest Allocation Before and After Wellington Port Closure ... 90
Figure 24 Train Sidings and Rail Line locations. ... 93
Figure 25 Simulation Results Report for The Current State ... 98
Figure 26 Stock Level Charts For Scenario Zero ... 100
Figure 27 Simulation Results Report After Exploiting Ship Loading Rate at New Plymouth ... 102
Figure 28 Stock Level Charts After Exploiting Ship Loading Rate ... 103
Figure 29 Simulation Result Report After Exploiting Train Scaling and Unloading Activity at Napier Port 106 Figure 30 Stock Level Charts After Exploiting Train Scaling and Unloading Activity at Napier Port ... 107
Figure 31 Results report After Increasing Ship Arrival Rate at New Plymouth Port ... 110
Figure 32 Stock Level Charts After Increasing Ship Arrival Rate at New Plymouth Port ... 111
Figure 33 Impact of Releasing Constraints on the Logistical Network Throughput ... 113
List of Tables
Table 1 Sources of supply chain risks, ... 16
Table 2 Comparison between objectivism and Constructionism, adopted from Bryman and Bell (2011) ... 37
Table 3 Comparison between positivism and interpertivisim, adopted from Bryman and Bell (2011) ... 38
Table 4 Comparison between quantitative and qualitative methodologies, adopted from Bryman and Bell (2011) and Neuman (2006) ... 40
Table 5 Research design consideration ... 41
Table 6 Research Concept Operationalization ... 41
Table 7 Data Collection Phases ... 43
Table 8 A Sample of North island’s yield, processing and exporting volumes by district (Scion, 2017). ... 56
Table 9 A Sample of South Island’s yield, processing and exporting volumes by district (Scion, 2017). ... 57
Table 10 Glorious Plumeria ship characteristics (Scion, 2017). ... 67
Table 11 Calculated Capacities. ... 71
Table 12 Allocated Quantities for Each Port. ... 72
Table 13 Future Adjusted Capacities... 72
Table 14 Port Utilization During Each Closure Scenario ... 73
Table 15 Resilience Index During Each Scenario ... 75
Table 16 Calculated Ports Capacities Vs Allocated Quantities ... 76
Table 17 Port Utilization during Each Scenario ... 77
Table 18 Resilience Index During Each Scenario ... 78
Table 19 North Island Model Sensitivity Analysis for Price ... 80
Table 20 South Island Model Sensitivity Analysis for Price ... 80
Table 21 North Island Model Sensitivity Analysis for Cost... 82
Table 22 North Island Model Sensitivity Analysis for Price ... 82
Table 23 General Transport Activities time ... 92
Table 24 Train Sidings Capacities ... 93
Table 25 Rail Line Capacities ... 94
Table 26 Ports Facilities and Capacities ... 95
Table 27 Ships Loads Distributions... 95
A supply chain is a network of facilities in which material flows from suppliers to be processed in factories and then to be delivered to end customers, it also includes information flow from customers to suppliers and vice versa (Petrovic et al., 1998). Most academics agree that supply chain scope includes all the stages the material goes through from its ore to the final consumption point (Cooper et al., 1997). The complexity and interference of a supply chain differs with the number of nodes included within that supply chain. Businesses in modern market are being forced by the new market environment to operate on a global scale in order to improve their offerings, profitability and performance by getting lower labor costs, expanding their markets or getting closer to their suppliers. This tendency increased the complexity of the supply chains of these businesses and positioned the supply chain operations in the center of the improvement efforts as it affects the product quality, service level and profitability.
The high number of stakeholders involved in the activities taking place in different parts of the supply chain necessitated the evolution of the supply chain management concept. Supply chain
management is defined by Christopher (2011) as “The management of upstream and downstream
relationships with suppliers and customers in order to deliver superior customer value at less cost to the supply chain as a whole” (p. 3). In addition, Cooper et al. (1997) mention that the main objectives of supply chain management are to allow the business to transform its supply chain into a competitive edge and to reduce the total cost by levelling material flow to accommodate customer needs. Therefore, it can be concluded that supply chain management aims at improving the overall supply chain performance to enhance customer satisfaction at lower cost. However, the wide scope of the supply chain and the corresponding risks to different stages of the supply chain make fulfilling this objective a hard task to do.
chains were disrupted by the Thailand flooding in 2011 (Chopra & Sodhi, 2014). These events and their disastrous consequences show the importance of being ready and having a contingency plan for such events to minimize their effect on the companies’ supply chains.
Even though complex supply chains’ risks and vulnerabilities were widely addressed in the literature, there is not enough empirical research and findings that practitioners can use to mitigate supply chain risks (Brandon-Jones, 2014). Furthermore, transportation risks are surprisingly one of the least addressed risk types in the literature (Ho et al., 2015). The literature provides a deep insight on the types of supply chain risks, risk assessment techniques, management strategies and some conceptual frameworks for risk mitigation. The available literature provides a base for researchers to build practical tools and models that can be used in different industries to mitigate supply chain risks.
Decision Support Systems (DSS) are sought after to present solutions for problems in the supply chain from tactical to strategic level (Tako & Robinson, 2012). Researchers have used different modelling tools to simulate systems under different conditions to prepare these system for the changes that might happen in their environments and accordingly improving their responsiveness and resilience. These modelling tools include linear programing (Santoso et al., 2005), fuzzy modelling (Petrovic et al., 1998), Discrete Event Simulation (DES) (Terzi & Cavalieri, 2004) and hybrid models (Umeda & Zhang, 2006). Some researchers focused on the aggregate level analysis (e.g. Meepetchdee & Shah, 2007; Cakravastia & Diawati, 1999; Towill, 1996), while other researches addressed the micro level analysis by isolating a certain part of the supply chain to be studied in depth (e.g. Legato & Mazza, 2001; Cheng & Duran, 2004). The integration of multiple tools in one decision support system will allow that system to capture both strategic and operational considerations in the decision-making process in order to produce more reliable recommendations.
18000 jobs in 2014 (NZFOA, 2014). In 2013, New Zealand dominated more than 20% of the world’s softwood log trade and became the world largest exporter of softwood log (Scoop,2014). The log industry is a large part of New Zealand’s exports contributing by more 16 million m3 of logs in exports in 2014 (NZFOA, 2014). The disruption of this supply chain by a port closure might have catastrophic
consequences on New Zealand’s economy, which necessitates the creation of contingency plans for such events.
This research is an industry sector study addressing the log’s industry in New Zealand. More specifically, it is addressing transportation risks associated with the logs exporting under different port closure scenarios. The objective of this research is to provide the building bricks of a tool that functions as a Decision Support System (DSS) to help practitioners in the log industry deciding their course of action in response to sudden major events that might disrupt their supply chains. The resulting decision support system and recommendations of this research aim at improving the resilience of the log supply chain in New Zealand and the logistical network in general. Hopefully, the resulting DSS will be capable of producing recommendations that would increase the profitability of the log supply chain and make it more reliable and resilient under multiple disruption scenarios.
. The research is a quantitative cross-sectional study as some data was collected during the time of conducting the research in addition to historical data. The structure of the research is formal, in which certain parameters was defined and measured according to a clear procedure. Linear programing and simulation were the main analytical tools, in which there is some control over the variable in the system being studied.
This chapter is a review of the relevant literature in the supply chain risk and logistical network resilience fields. Section 2.1 present the definition of supply chain risk followed by the types of these risks and their interaction. Section 2.2 addresses the impact of these risks and provides some examples of disruption events with their resulting costs and effects. Section 2.3 discusses the factors affecting the severity of supply chain disruption and provides a general risk mitigation framework. Section 2.4 addresses the calculation methods of ports’ capacities. Section 2.5 provide some insight on the concept of decision support systems, the modelling tools used to develop them and their use in the supply chain context. It also discusses some example of decision support systems used in supply chain context. . Section 2.6 sheds some light on the theory of constraints and its applications. Section 2.7 presents the research conceptual model and shows the interaction between different types of risks and how decision support systems help tackling these risks. Section 2.8 points out the gaps that were found in the literature and shows which gaps the research is addressing. Section 2.9 provides a brief summary of all the previous sections.
2.1- Supply Chain Risks
Supply chain risks are defined in a number of published papers; however, these definitions were affected by the authors’ views and they were focusing on certain parts of supply chain risks. Some of them focused on supply risks (Zsidisin, 2003; Ellis, Henry, & Shockley, 2010), and information and material flow risks (Jüttner, Christopher, 2003). In this study supply chain risks are defined as the probability and the effect of any unforeseeable events and circumstances that might impair the performance of any part of the supply chain at the tactical, operational or strategic level (Ho et al., 2015). This comprehensive definition includes all types of risks regardless of it being at macro or micro level.
their interactions. The study will focus only on the first three types because they cover the three tiers of the simple supply chain.
RISK TYPE RISK SOURCE
SUPPLY RISK Inventory, price volatility, product design robustness, and technological disruptions OPERATIONAL RISK Machines breakdown, production process capability, and operating exposure DEMAND RISK Demand fluctuations, introducing new products to the market, and the bullwhip effect SECURITY RISK Vulnerability of the supply chain to be infiltrated by unauthorized access to information ,
infrastructure security violation, or by physical products damage.
MACRO RISK Major events such as natural disasters, economic shifts and significant changes in exchange rates COMPETITIVE RISK Lack of market intelligence
Table 1 Sources of supply chain risks,
Supply risk is the probability of a supplier or supply market failing to fulfil customer demand at the expected time, cost and quality due to a certain event(s) (Zsidisin et al., 2004). Supply risk includes the risks associated with supplier selection, make or buy decisions, national and international sourcing and all the material movements from its origins to focal nodes in the supply chain. These risks affect the early stages of the production, which mean that they have chronic ramification on all the other parts of the supply chain. The large number of papers addressing the risks associated with supplier selection and evaluation indicates its importance. Some examples of papers addressing parts of supply risks include, quality risks (Talluri, Narasimhan, & Nair, 2006), supplier time tardiness (Talluri & Narasimhan, 2003), supplier capacity risks (Viswanadham & Samvedi, 2013), transportation and geographical distance risks (Chan & Kumar 2007), breakdown risks (Ruiz-Torres, Mahmoodi, & Zeng, 2013), financial risks (Lockamy & McCormack, 2010), service level risks (Chen & Wu, 2013),
suppliers’ responsiveness (Ho, Dey, and Lockström 2011) and level of supplier cooperation and
integration risks (Chaudhuri, Mohanty, & Singh, 2013). These risks should be considered while selecting a supplier in order to minimize the supply chain disruptions that they might cause in the future.
Demand risk is the probability of occurrence of an event that might influence the number of order, order volume or orders’ assortment placed by customers. Demand risks also include the risks associated with delivering the products from a focal node in the supply chain to the final customer. Inaccurate information received from the downstream supply chain is one of the sources of demand risks (Johnson, 2001). Other sources of demand risk include improper introduction of new products, degree of innovation in the introduced product (the higher the innovation the higher the risk as the company might over/under stock the product, which will cause significant losses), new products introduced by competitors and seasonality of the product.
As mentioned earlier supply chain risks can affect a part or the whole supply chain. Figure 1 shows the main risks associated with each part of the supply chain. It shows a logical spread of the risks across the supply chain, in which in the upstream risks are mainly supply risks and at the middle part of the supply chain, where the production takes place, it is mainly operational risks and as we move closer to the distributors and final customer it becomes more focused on demand risks. It also shows that security risks are being considered at all the stages of the supply chain. Although the Figure shows that each risk is concentrated in certain parts of the supply chain, it can be argued that there
Figure 1 : Risks spread across the supply chain (Mentzer, 2001)
security is an overarching risk in which this risk must be considered carefully during all the stages the products goes through from its ore to the final customer. Regardless of the risk type and place in the supply chain, it can cause disruptions and serious problems to the material and/or information flow, which will lower the profitability of the supply chain. It is important in this context to know more about the impact of these disruptions to understand the effect of supply chain risks on its performance.
Figure 2 Risks overlap in the supply chain (source:author)
2.2-Supply Chain Disruptions
Supply chains disruption happens when an event prevents the flow of material from following its normal track and arriving at its planned time (Sevensson, 2000). In other words, disruptions are the undesired results associated with the supply chain risks. It might be at small scale due to minor reasons such as machine breakdown or it might happen at a large scale due to major events such as wars, unforeseen disasters , earthquakes, economy crises, strikes and biosecurity threats (Blackhurst et al.,
2005). These events in turn might lead to shutting down airports, ports and make the use of certain roads prohibitive. Furthermore, it might affect the communication infrastructure, which may slow down the material and information flow in the supply chain.
(Blackhurst et al., 2005). Furthermore, labour strikes in October 2002 led to shutting down 29 ports in America’s west coast, which resulted in closing the manufacturing plant of New United Motor Manufacturing (Wilson, 2007). In 2011 Toyota’s production capacity was dropped by 40,000 vehicles due to Japan’s tsunami and the consequent nuclear crisis (Pettit, Croxton, & Fiksel, 2013). Computer manufacturers and Japanese car manufactures supply chains were disrupted by Thailand flooding in 2011 (Chopra & Sodhi, 2014).
The aforementioned examples shed some light on the severe impacts that a disruption event can cause to the supply chain members. However, not all disruption events lead to catastrophic losses so determining the severity of the disruption event is important to consider in the contingency plan. The impact of supply chain disruptions vary depending on the disruption scale, design of the affected supply chain and the supply chain ability to mitigate the risk and recover after it passes (Craighead et al., 2007). In the context of this research the addressed disruption event is port closure, the severity of the closure is dependent on the importance of the port, the infrastructure readiness, and the closing time. The closure of a major port with big capacity for a long period is more severe than closing a small port for a short time. Port capacity is an indicator of its importance to the logistical network so it is important to understand how port capacities are calculated as it is the main factor that will determine the severity of the disruption in our model.
2.3- Calculating Ports
’
Capacities
Globalization had boosted the number of international trade transactions, as customers started comparing products and services offered by suppliers from all around the world. This trend had in turn increased the total number of vessels of different types by more than 7000 vessels during the period from 2011 to 2016 (Merchant, 2016). Consequently, marine traffic during the same period has witnessed a constant growth that is expected to continue in to the future (Huang et al, 2016). This growth can cause congestion in ports, which will increase ship waiting times, costs of shipping and navigational risks. Therefore, it is necessary for ports officials to know the current capacities of their ports in order to develop plans to accommodate future growth.
the infrastructure explains the invalidity of using only one of these dimensions as a port capacity indicator (Bellsolà Olba et al, 2015). For example, evaluating the port network capacity depending on bottlenecks can be misleading as the bottlenecks might be shifting from one point to another in the network when handling different kind of ships. Accordingly, it is important to study the factors that need to be considered during the process of evaluating port capacity.
The dimensions of port capacity can be categorized into two main groups, physical factors and institutional factors (Bassan, 2007). Physical factors include, the size of container yard, availability of inland waterways, number of gates and berths, cranes and all the other infrastructural facilities in the port (Islama & Olsena, 2011). Institutional factors include regulations and labour related issues such as skill levels, working hours and safety rules. Even though it is hard to quantify institutional dimension of port capacity, it is important to consider its impact on the port throughput. Taking the previously mentioned points in mind, port capacity can be defined as the maximum number of ships of a given fleet that a port can handle using its current infrastructure and resources, under a certain demand rate and traffic composition during a certain period of time, while fulfilling its service time promise and satisfying safety requirements (Fan and Cao, 2000).
Using historical data of the annually handled volume provide some insight on the port capacity but it will not provide a fully reliable measure as it is not guaranteed that the port was operating at its full capacity. After determining the disruption severity (represented by port capacity in this research), the decision makers should determine their course of action to mitigate the effect of this event. In the next section a risk mitigation framework will be discussed to understand the mechanism of responding to supply chain risks.
2.4-Supply Chain Risk Mitigation
Figure 3 General supply chain risk mitigation framework, adopted from Ho et al. (2015).
Mitigation strategies include avoidance, postponement, transferring /sharing risk, hedging and control. For further details of these strategies readers are referred to Manuj and Mentzer (2008). Regardless of the mitigation strategy, responding to risks requires making important decisions in a short period of time. However, it is hard to make the right decision at a short notice to respond to a sudden undesired event. Accordingly, there is a need for a tool that function as a decision support system to allow the decision makers to make their decisions rapidly. Thus, it is important to understand the concept of decision support systems that serve to fulfil that objective.
2.5- Decision Support Systems (DSS)
(Santoso et al., 2005), fuzzy modelling (Petrovic et al., 1998), System Dynamics (SD) (Angerhofer & Angelides, 2000), Discrete Event Simulation (DES) (Terzi & Cavalieri, 2004) and hybrid models (Umeda & Zhang, 2006) among other tools (Tomlin, 2006; Kim et.al, 2011). Some researchers focused on the aggregate level analysis (e.g. Meepetchdee & Shah, 2007; Cakravastia & Diawati, 1999; Towill, 1996), while other researches addressed the micro level analysis by isolating a certain part of the supply chain to be studied in depth (e.g. Legato & Mazza, 2001; Cheng & Duran, 2004). The use of linear programing in the aggregate level analysis (e.g. Meepetchdee & Shah 2007; Santoso
et al., 2005) and the use of discrete event simulation in the operational level analysis (e.g. Terzi &
Cavalieri, 2004; Legato & Mazza, 2001) indicated their effectiveness in the corresponding level of analysis. The integration of these tools in one decision support system will allow that system to capture both strategic and operational considerations in the decision-making process in order to produce more reliable recommendations.
DES emerged in the 1950s and in that time, according to Robinson (2005), it was developed in machine codes. He adds that the introduction of programming languages and high speed PCs in the 1960s founded a base for breakthroughs in the simulation field and allowed for the development of specialist simulation software such as GPSS, SIMSCRIPT and SIMULA. Hurrion (1976) addressed the potentials of the new simulation programming languages in regards to their ability to use animation and be both more visual and interactive after the introduction of microcomputers in the 1970s. These revolutionary improvements were the foundation of more complicated simulation software packages in the next three decades. The first Visual Interactive Simulation (VIS) program is SEEWHY, introduced in 1979. The continuous development of computers in the 1990s continued to support the commonality of VIS and led to the introduction of low cost VIS packages such as EXTEND (Robinson, 2005). After these VIS packages were introduced users demanded simulation optimisation solutions, which were later created by the VIS vendor such as SimRunner for ProModel (Harrel & Price, 2003). From the previous discussion, it can be noted that a lot of work had been done on VIS packages to make them more reliable as a DSS, which explains their extensive use now.
activities, supply chain optimisation and transportation planning. Furthermore, sometimes it is used in conjunction with SD at the strategic level (Tako & Robinson, 2012). Articles published in this field accordingly validate its success in tackling the uncertain environment of the supply chain (Schmitt & Singh, 2009; Petrovic et. al, 1998; Spedding & Sun, 1999).
Meepetchdee and Shah (2007) tried to define the concept of logistical network resilience and suggested that resilience should be considered by decision makers during the logistical network design stage. In their work, they developed a mathematical model using MILP with an objective function minimizing the cost while maintaining a minimum level of resilience to obtain a logistical network configuration that satisfy the prescribed requirements. The model is designed to help decision makers to determine the number of distribution centres to be established in order to maintain a certain level of resilience. It was also an effective tool for assigning customers to warehouses and establishing contingency links between the customers and the other warehouses to determine which warehouse will be assigned to serve each customer should a disruption occur. However, the work of Meepetchdee and Shah (2007) is simplified and does not address the details of the constraints that might be faced in the logistical network. It only provides a bird eye configuration of the logistical network by locating the facilities in certain locations relative to the customers’ locations. Furthermore, the proposed model is supposed to be used during the design stage and assumes that the decision maker is in control of all the supply chain facilities, which is only true in limited cases. Supply chains usually involve multiple independent organizations that already have established facilities. The proposed model cannot be used to improve their logistical network resilience without building new facilities. However, with some modification the model might be used to help decision makers to establish contingency links between customers and the available warehouses.
Adding the penalty and the location of the vessel’s container in the yard relative to the allocated berth slot to the formula of decision-making makes the process harder to the berth planner, as the planner will have to compromise between efficiency and cost that might be incurred due to any delays in berthing. The approach that they have used allowed them to study the process activities in depth and identify the potential bottlenecks. Accordingly, the model was an effective tool to identify the improvement opportunities in the process flow and for providing some insights on whether activities capacities should be increased or reallocating resources in a more efficient way will resolve the bottleneck. However, the proposed system is only limited to the operations taking place at the terminal. The model does not encompass the bigger picture that includes the interaction between the terminal activities and other activities taking place at the port and the extended supply chain.
Cheng and Duran (2004) developed a decision support system using discrete event simulation in conjunction with stochastic optimal control to optimize an inventory and transportation system in the oil transportation field. In the conclusion of their research they propose a new system that offers better control over the inventory and distribution process compared to the current one. However, they were unable to find the global optimal system due to computational difficulties. DSSs were also used for supply chain re-engineering (Cakravastia & Diawati, 1999; Towill, 1996), inventory management (Sterman, 1989) and international supply chain management (Akkermans et al., 1999).
The results produced using these models are analyzed using different approaches depending on the objective of the decision support system; for example, Lean thinking and value stream mapping can be used if the objective was to eliminate waste (Wee & Wu, 2009) (Seth & Gupta, 2005). On the other hand, the theory of constraints process can be used if the objective was to maximize the throughput by identifying and exploiting the bottlenecks in the system being studied (Goldratt, 1990). The extensive use of DSS for different reasons using various modelling and analyzing tools demonstrates the positive impact of having such systems as a part of the decision-making process in a business.
2.6- Theory of Constraints
accomplishing its goal. TOC proposes that, in order to get an improvement that affects the whole system, improvement efforts must be focused on the constraint within the system.
Over the years TOC was integrated in different managerial areas; such as Project Management (Goldratt, 1997); Integrated Management Systems (Goldratt et al., 2000); Supply Chain Management (Goldratt, 2009). In addition, Watson et al (2007) state that TOC was used in various governmental agencies and mass production facilities such as NASA and Ford. This, according to Goldratt (2009), has provided a proof of the ability of TOC to perform as an alternative approach for production systems management. The thinking process (TP) of TOC is a method that uses a set of tools used individually or collectively to spot , investigate and solve problems (Kim et al. 2008). Cox and Schleier (2010) add that TP-TOC enable the company to identify the main problems and to create a win-win outcome of these problems, in addition to smoothing the way for the implementation of the improvements.
Musa et al. (2005) state that TP fundamentally uses effect-cause-effect relationships and identify the rationale behind the detected problem, which means that it answers why the problem is there rather than how it happens. Pereira Librelato et al. (2014) add that during the consideration of the relationships between the parts of the process an assumption must be kept in mind, that is all the undesired effects are a result of a lower number of causes. Cox and Schleier (2010) summarize applying the methodology of TP-TOC by answering the following three questions using a suggested tool or set of tools:
x What to change? to answer this question a technique called current realty tree (CRT) is used. The CRT aims at identifying the main problem(s) in the system by using a visual representation of the undesired effects and their causes, which are usually lower in number.
x What to change into? evaporating the cloud EC is used to answer this question. EC aims at expressing the assumptions of the main problem to find solutions.
In summery TP-TOC deduce the reasons of the undesired effects and then helps in figuring out how to fix it. Goldratt (2008) mention that the basic assumption of CRT is that complex systems have inherent simplicity, which means that the number of real causes is fewer than the number of all the undesired effects they cause. Even though, the objective of TOC implementation might be more relevant to the system throughput, having a balanced flow of materials in the supply chain reduce its vulnerability to disruptions. This makes its use as a part of a decision support system more desirable, as it helps in increasing throughput and improving resilience at the same time. The use of TOC will allow the decision support system to identify the bottlenecks and the improvement opportunities in the process, which will allow it to present impactful recommendations. Consequently, this integration would also increase the moderating effect of the DSS on the impact of supply chain risks.
2.7- DSS Moderating Effect on the Impact of Supply Chain Risks.
Based on the literature review, this research proposes a tool that functions as a decision support system to help policy makers and practitioners to moderate the effect of supply chain risk. Knowing that this research is directed towards an audience in governmental and commercial sectors, the different perspectives of the target audiences must be considered. Figure 4 shows the interaction between exogenous risks, capacity risks and transportation risks. In this context capacity risks should be thought of from a governmental point of view, accordingly, it is related to the facilities and services that governments offer. On the other hand, transportation risks are approached from a commercial perspective, in which it includes the inbound and outbound movement of the products and materials across the supply chain. Exogenous risks are the risks that are hard or impossible to control, such as tsunamis, earthquakes, bio security threats, and other natural and manmade disasters.
Figure 4 DSS moderating effect on the impact of exogenous risks on transportation and capacity risks (source: author)
2.8- Research Gap
As mentioned earlier, supply chain risk is a well-established field of study with abundant publications addressing different topics in this discipline. Supply chain risks identification, mitigation frameworks, quantitative and qualitative studies for risk mitigation are among the topics that captured the attention of academics and practitioners in the past three decades. However, some risks including transportation risks have not been addressed sufficiently in the literature (Manuj & Mentzer, 2008). Furthermore, according to Brandon-Jones, et al. (2014) there is alack in empirical research addressing supply chain risks. Ho et al. (2015) reviewed 226 articles in the supply chain risk, of which only 1 paper was addressing transportation risks and 6 addressing macro risks. It can be concluded that there is consensus in the literature that transportation and macro risks still need to be researched more. This research will help bridging two of these research gaps as it is going to address the transportation risks due to bio security threats, which is considered a macro risk. It will investigate the impact of a macro
Influence
risk and its ramification on the logistical network and try to present a tool for mitigating the effect of this risk type.
2.9- Literature Review Summary
Supply chain risk is the probability and the effect of any unforeseeable events and circumstances that might impair the performance of any part of the supply chain at the tactical, operational or strategic level (Tako & Robinson, 2012; Schmitt & Singh, 2009; Spedding & Sun, 1999). Supply chain risk types include supply, operational, demand, information, security, policy, competitive and macro risks, it is also possible to categorize these risks in a number of different way using different criteria (Manuj & Mentzer, 2008). These risks are broad and other risks are considered inherent to them such as transportation and capacity risks. These risks could disrupt the material flow across the supply chain causing the supply chain members to incur significant losses. The impact of supply chain disruptions vary depending on the disruption scale, design of the affected supply chain and the supply chain ability to mitigate the risk and recover after it passes (Craighead et al., 2007). It is also worth mentioning that although supply chain risk identification, assessment, mitigation and monitoring are all addressed in the literature, as mentioned earlier there are still some gaps that need to be studied. Researchers developed a number of risk mitigation frameworks, however, the empirical studies on these frameworks are still not enough to prove their validity (Brandon-Jones, et. al., 2014).
3.1- Research Objective
Forestry industry is a major contributor to New Zealand's economy, it is the third largest export
sector, constitute 3.2% of New Zealand’s GDP and it has provided more than 18000 jobs in 2014
(NZFOA, 2014). Forest ownership in New Zealand is divided between international Timber
Investment Management Organization (TIMO’s) and locals. In 2013, New Zealand dominated more than 20% of the world’s softwood log trade and became the world largest exporter of softwood log
(Scoop, 2014). The log industry is a large part of New Zealand’s exports comprising more than 16 million m3 of logs in exports in 2014 (see Figure 5). New Zealand continued to be the world largest
exporter of softwood logs in 2016 followed by Russia and the US, the exports of these three countries combined make up almost 50% of the total traded logs in the world (Scoop, 2016).
Logs are exported from New Zealand via multiple ports. Figure 5 shows the amounts of
exported logs and sawn timber in cubic meters from all New Zealand’s different ports. It is noted that Tauranga port has the largest share of exports followed by Whangarei port and then Auckland port.
China is the main customer of New Zealand’s logs and New Zealand is competing with other global
competitors in the field for a larger share of this market. Figure 6 shows the largest round wood trade
channels in the world in 2014 and confirms that New Zealand’s export log trade channel with china is
the largest of its kind in the world, accounting for 13.3 million m3 of exports in 2014. Furthermore, New Zealand had exported 12 million m3 of logs to China in 2013 and around 10 million m3 in 2015 (Scoop, 2016). This confirms the importance of New Zealand as a major player in the global log trade
and the importance of the log industry to New Zealand’s economy.
Figure 5 Logs exports per port in New Zealand, adopted from (NZFOA, 2014).
Figure 6 Worldlargest round wood trade channels in 2014 Adopted from Bezuidenhout., Pusztai, Christians,& Wilson, (2016).
[image:35.595.65.520.395.612.2]course of action in response to sudden major events that might disrupt their supply chains. The resulting decision support system and recommendations of this research aim at improving the resilience of the log supply chains in New Zealand and the logistical network in general. Hopefully, the resulting DSS will be capable of producing recommendations that would increase the profitability of logs supply chain and make it more reliable and resilient under multiple disruption scenarios. However, it should be emphasized that this study aimed at demonstrating the capability of a combined modelling approach, as opposed to capturing the detailed industry attributes. The systems simulated in this study are not necessarily representative of the real world.
The need for decision support systems to improve the resilience of New Zealand’s log supply chain against disruptions resulting from biosecurity threats had prompted this research. A linear program was created to simulate New Zealand’s logistical network under different port closure scenarios. The objective function of the linear program aimed at optimizing the allocation of logs harvested in different forests across the country to available ports in order to increase the supply chain profitability. This model provides an aggregate view on the country’s logistical network and identify some focal ports that are interesting to be studied in depth. The model findings were used as the starting point of the second part of the research, in which a certain region was selected and simulated using Deseret Event Simulation (DES) to capture the fine details of that region’s logistical network. The primary questions that this research attempts to answer are:
1. What is the impact of a port closure on New Zealand’s logistical network? .
2. What is the best course of actions to be followed when any of the ports is closed due to bio security threats in New Zealand?
The first question will investigate and clarify the ramifications of a port closure on the logistical network and its impact on the companies’ supply chains. The second question aims at producing a response action plan framework to mitigate the impact of the disruption. The objective of this research is to provide a tool for practitioners that allow them to decide their course of action in response to sudden events that might disrupt their supply chains. The resulting DSS and recommendations of this research will improve the resilience of the log supply chain to the different risks that might be
in the log supply chain and to make it more reliable and resilient, which would hopefully improve the supply chain profitability.
3.2- Epistemological and Ontological Standing
Philosophical Epistemological and ontological positions should be clearly defined at the early stages of starting a research as it is a major contributor in selecting the type of questions to be asked and the methods to be followed in the research project.
3.2.1- Ontological Positions
Ontology deals with the question of whether social entities should be studied as and considered to have an objective reality that is not affected by the actors (objectivists’ perspective), or their reality is being constructed by the actors’ actions, experiences and perspectives in that social entity (constructionists’ perspective) (Bryman & Bell, 2011)..
Objectivism is ontological position proposes that there is an external fact associated with any social phenomena that cannot be affected by the actions and experiences of the people participating in that phenomena (Bryman & Bell, 2011). For example, objectivism implies that if we study a culture of certain country or an organization, we will assume that the culture or the organization possess predetermined and accepted sets of rules and procedures that the participants follow. Furthermore, it assumes that whoever fail to confirm to these rules will be undermined or eliminated from that social entity. It can be concluded that ,from an objectivist perspective, participants are not contributing to the set of beliefs or procedures within the social entity rather they are only doing what they are expected to do because that social entity and accepted procedures are restraining them from adding to that culture or organization
this approach should not be pushed to the extreme and they accept the pre-existence of the social entity being studied. Table 2 provides a summary of the main differences between constructionism and objectivism.
Table 2 Comparison between objectivism and Constructionism, adopted from Bryman and Bell (2011)
3.2.2- Epistemological Positions
Epistemological position deals with the question of what is deemed to be an accepTable or true knowledge in a certain field of study (Bryman & Bell, 2011). It defines the researcher’s perspective towards the research topic, it particularly addresses the way that social science should be tackled. In this context, there are two epistemological position positivism and interpretivism. These positions contradict each other on their approach of understanding social science, in which positivism suggest studying it in a similar way to natural science and interpretivism suggests that the principles of studying natural science cannot be copied to studying social science .
Positivism is an epistemological position in which it assumes that knowledge is accepted only if it is observable and measurable (Bryman & Bell, 2011).It proposes studying social sciences the same way natural sciences are being studied, in which reality is not being affected by the perspective, behaviour or culture of the researcher or the participant (Mertens, 2005). In other words, reality is objective by itself regardless of who is studying it, which complement objectivists’ ontological positions. Positivist position is usually associated with deductive type of relation between research and theory, in which a hypothesis is developed according to a theory and a research is conducted to test the validity of that theory by rejecting or failing to reject the hypothesis.
researcher’s and participants’ perspective and past experiences as they are continuously affecting and being affected by the events in their surroundings, which is compatible with interpretivist ontology. This means that studying such a field can only be done by understanding reality from the perspective of the people within that environment being studied (Bryman & Bell, 2011). The results of researches with such type of epistemological position are mostly new theories rather than validating existing ones, which is the usual case in positivists’ researches. This type of research is called inductive research in which the major goal of the research is to introduce a new theory.
From the previous discussion, it can be noted that positivism and interpretivism differs in their approach to social science, effect of the actors, and research outcomes among other differences. Table 3 provides a brief summary of the comparison between the two positions. It can be concluded that each position possesses some uniqueness and have its own contribution to the body of knowledge. However, it can be argued that the results coming from a research with a positivist position are more solid and reliable because they are measurable and repeatable. It also worth mentioning that the difference between positivism and interptivisim is not as straight forward as it is being presented here and it has further complications to be studied (Bryman & Bell, 2011). For example, researches with interpretivist epistemological position might be conducted to test a theory rather than creating new one. However, the below comparison is just a topical one to clarify the uniqueness of each position.
3.2.3- Researcher
’
s Ontological and Epistemological Positions
I believe that an objectivist ontological position and a positivist perspective provide an excellent way for studying social sciences. As these positions can provide the body of knowledge of the field being studied with tangible, repeatable and measurable results that can be generalized and employed in different areas using reliable statistical tools. This research is investigating supply chain risk
mitigation in order to improve performance and reduce costs through collecting some data about the parameters being considered such as costs and time delays. So it can be noted that the objects being studied possess a reality that transcend the participants of the system. As such the completion of this research will support the objectivist and positivist positions’ approach of studying social science by providing outcomes that can be measured and repeated in a part of the social science field.
3.3- Appraisal of Different Research Methodologies
Research methodology is the strategy that defines the general orientation that will govern the research project. Mainly there are two research methodologies quantitative and qualitative, a mixed methodology from both quantitative and qualitative methodologies might be suggested as a third type. It is necessary to differentiate between quantitative and qualitative methodologies as it helps in categorizing the various research methods employed in the business research field (Bryman & Bell, 2011).
Quantitative research methodologies are the methodologies that rely heavily on quantification in data gathering and analysis (Bryman & Bell,2011). Researches that use such methodology usually possess a positivist epistemological position, which in turns mostly related to deductive type of research and objectivist ontological perspective. The deductive nature of quantitative research necessitates the need for data collection for a predetermined set of variables according to a well-defined procedure in order to test the hypothesis. Statistical tools are used after that to analyze and generalize the research results. It worth mentioning that it is also accepTable in a quantitative research to collect some narrative data, however, during the analysis it will be transformed into numbers to be quantified. The main drawback of this type of methodologies is that it is almost impossible to articulate all the variables in the real word within the experiment being conducted to test the hypothesis (Wienclaw, 2015). Consequently, researchers are usually forced to ignore some of the factors and focus on a limited number of them during their experiments.
is done on an ad hoc basis to cope up with the development of the research as it progresses. The techniques used for data gathering in this type of researches enable the participants to share their feelings, experiences and perspectives an example of such techniques is interviews. Some of the limitation of this type of methodologies is that it is hard to include all the questions that the researcher need in an interview or a survey and the reliability of the participants’ answers might be questioned as they might lie or not be motivated to participate sincerely in the research (Wienclaw, 2015). Table 4 summarises the previous discussion of the difference between qualitative and quantitative methodologies.
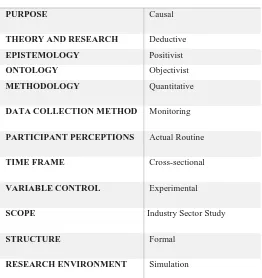
Table 4 Comparison between quantitative and qualitative methodologies, adopted from Bryman and Bell (2011) and Neuman (2006)
CRITERIA RESEARCH POSITION
PURPOSE Causal
THEORY AND RESEARCH Deductive EPISTEMOLOGY Positivist
ONTOLOGY Objectivist
METHODOLOGY Quantitative
DATA COLLECTION METHOD Monitoring
PARTICIPANT PERCEPTIONS Actual Routine
TIME FRAME Cross-sectional
VARIABLE CONTROL Experimental
SCOPE Industry Sector Study
STRUCTURE Formal
[image:42.595.167.429.90.368.2]RESEARCH ENVIRONMENT Simulation
Table 5 Research design consideration
3.4- Data Collection and Analysis
In the context of this research, the concept operationalization is shown in Table 6 (Ghauri & Grønhaug, 2005). The research adopts the idea that Decision Support Systems (DSS) have a positive
impact on the logs’ supply chain resilience. This impact can be measured by the profit increase and cost reduction after employing the DSS. The visualization of this improvement will be apparent in the field by the improved port utilization and the lowered level of inventory at the companies’ side (in the form of logs in the forests).
OPERATIONALIZATION RESEARCH CONCEPT
CONCEPT DSS improve the responsiveness of logs’ supply chain to ports closure due to bio security threats
MEASURES Cost and net profit
INDICATORS Quantity of logs until the closed port open again, and ports utilization.
3.4.1- Data Collection
Scion was used as the main data source for this research in conjunction with other government data as well as export and forest description data. Scion is a specialized research institution in the forestry, wood product and other related industries. Scion is a New Zealand crown research institute
that has a long history dating back to the 1800s (“About Scion”, 2009). Its current headquarter was a forest nursery for a huge governmental afforestation program in the 1800s. Scion started research on its current site in 1947 under a different name as a government forest experimental station. Now the research institute is the leading crown research institute in several areas including forestry bio security,
risk management and mitigation (“About Scion”, 2009) and is one of the largest forestry research
institute in the world. Accordingly, Scion is experienced in the field and is a credible source of information for the forestry industry. The data collected from the institute will be referred to as (Scion, 2016) or (Scion, 2017) from hereafter.
Data collection was done in two phases, the first phase relied on historical data concerning the average volumes handled by all the ports included in the study to get some insight on their capacities. This data was collected for the same period for all the ports. Logistical network capacities and distances travelled by trucks or trains to transport logs from the different districts in the country to each port along with the expected costs were gathered in the during the first phase of data collection. Interviews and road network data-bases were used as a collection method for this phase. In the second phase, the collected data was focused on the details of the activities taking place in different parts in the logistical network. The data was collected by interviewing experts from Scion, the national rail line Kiwi Rail, and other experts in the industry. Interviews covered: current status clarification; available options companies have during these events including routes followed; the costs and time delays associated with these options; details about the activities taking place on different parts of the logistical network and logistical network facilities’ capacities. Table 7 summarizes the collected data with its corresponding source and the phase in which it was collected. Data collected in phase1 is the data that were used to build the linear program, while data collected in phase 2 is the data that was used to build the simulation model.
DATA TYPE DATA SOURCE PHASE 1 PHASE 2
ROAD DISTANCES Google Maps
FORESTS DESCRIPTION Ministry of Primary Industries (MPI) and New Zealand Forest Owners Association (NZFOA)
LOG TRANSPORT, PORT, AND MISCELLANEOUS COSTS
Scion
LOG EXPORTS HISTORY BY PORT Ministry of Primary Industries (MPI)
TIME NEEDED FOR EXECUTING HANDLING ACTIVITIES
C3 (a product handling company operating in multiple ports
in New Zealand), Kiwi Rail and Scion
LOGISTICAL NETWORK FACILITIES AND THEIR CAPACITIES
Council of Log Transport Safety, Scion, C3 and Kiwi Rail
Table 7 Data Collection Phases
3.4.2- Sampling
Two sampling techniques will be used in the two data collection phases: cluster sampling and purposive sampling (David &Sutton, 2011). The first phase data sampling was carried out using cluster sampling in which each of the ports included will be considered as an independent region. In the second phase, purposive sampling was employed. Researcher’s judgment was used for the selection of participants, with the objective of selecting the participants who are the most knowledgeable with the process and its associated costs.
3.4.3- Analysis
linear programing in conjunction with Discrete Event Simulation (DES) and the theory of constraints were used as analytical tools in this research. Linear programing is an optimization tool used to find the minimum or maximum of an objective function that is in the form of a linear equation in the presence of a set of linear constraints in the form of equations and/or inequalities (Bazaraa et al., 2011). DES is a tool used to create models that simulate the changes that occur to a system over time,
in which the system’s status changes instantaneously at discrete and countable points of time (Law, 2006). These models are created in order to allow decision makers to compare the system’s performance under different conditions to improve their businesses profitability (Sweetser, 1999).
Through this tool, it was easy to consider only the strategic level constraints, while neglecting the operational level constraints. This had allowed the linear program to provide configurations that are more profitable than the ones that might be presented if the operational constraints were included in the model.
The second step was focused more on analysing the details of the logistical network by taking into consideration more constraints than the first step to identify the weaknesses of the logistical network and present solutions accordingly. The aim of this step was to consider the operational level constraints, that were not included in the first step, in order to provide a more holistic risk mitigation plan that includes both strategic and operational level insights. In this part of the analysis the thinking process (TP) of TOC was employed to spot, investigate, and release bottlenecks. The simulation model allowed the DSS to present recommendations that would ensure the feasibility of the optimal forest distribution that was recommended by the linear program
Figure 7 shows the steps the DSS proposes to produce a prioritized list of recommendations to improve the resilience of a certain logistical network. The process starts by modeling a certain scenario at the country level in pursuance of the optimal solution, i.e. modeling the distribution of forests after a port closure. Further, the analysis is taken to a more detailed level to predominantly consider the
affected region rather than the country’s whole logistical network by means of endorsing a
recommendation list which mitigates the effect of possible closure scenario in that region. In this research, the macro level analysis included all the ports in the logistical network. However, only one closure scenario was taken to the micro level analysis and simulated using DES to produce a recommendation list.
Repeating the proposed approach for different scenarios in different regions would produce multiple sets of recommendations for different regions. The proposed recommendations impact on the resilience of the logistical network are then compared to create a prioritized recommendation list. The impact of the recommendations can be quantified by comparing the amount of logs exported before and after
3.5- Validity and Reliability
The reliability and validity of data are central issues for any research. Reliability means that the results are repeatable under similar conditions, which indicates that the measurements are dependable and consistent (Neuman, 2006). Validity means that the variables or indicators considered in the research realistically and meaningfully characterize the case or the phenomena being studied (Neuman, 2006). For this research, the research methodology, data collection and analysis tools were carefully selected to ensure that the research results are valid and reliable. The collected data cover a
Recommendations List
Recommendations List
Recommendations List
Prioritized Recommendations List
Recommendations List
Recommendations List
Recommendations List
Linear
Program
Macro
Level
Analysis
Simulation
Model
Micro
Level
Analysis
VS……….
.
VS VS
[image:46.595.55.572.160.534.2]……….
.
long period of time and it also covers all New Zealand ports. Experts’ opinions were taken into consideration while developing the DSS, which excluded the possibility of having unrealistic solutions. Moreover, the collected data also included practices followed by different companies operating in the industry, while their input was used to test the validity of the DSS. Accordingly, this proves the reliability and validity of the collected data and research results.
Given that the first set of data is historical data collected over a long period of time, it provides stability for this set. In addition, because this data was collected for all New Zealand ports it can be considered to be representative. Equivalence reliability is realized in this set as it includes more than one variable that is used to triangulate the main variable to improve its equivalence reliability.
The second set of data is collected by interviews (excluding road network data, which relied on archival data). Accordingly, the responses will be affected by the experience and knowledge of each participant, which might affect the stability of the data. However, since the participants will include several experts from different fields in the industry, the data will be representative. Moreover, having more than one measure included in the interviews provided an indication of the equivalence reliability of the data. The validity and full representation of the different variables, that should be considered, was ensured during the interviews because the participants are experts in the field.
3.6- Ethical Consideration
Ethical considerations must be well thought-out in the research project because it is necessary not to cause the participants any physical or emotional harm, which includes stress, embarrassment, privacy loss, discomfort, and pain (Cooper& Schindler, 2008).
The Forestry industry is a major contributor to New Zealand economy; it is the third largest export sector, comprises 3.2% of New Zealand’s GDP and it provided 18,000 jobs in 2014 (NZFOA,
2014). Improving the growth of this sector will be beneficial to the country’s economy. The outcome
of the research helped in providing building bricks for a decision support system that would allow organizations working in the industry to be more responsive to disruptions in their supply chains. Accordingly, this will improve their competitiveness and market share in the global market, which will increase the profitability of this industry. Furthermore, the DSS will also be helpful for port officials to improve the efficiency of their risk mitigation processes, which will be positively reflected in the supply chains performance of the companies using these ports.