Is there a relationship between
fingerprint donation and DNA
shedding?
Ainsley J. Dominick
1Lindsey A. Dixon
1Niamh Nic Daéid
1Stephen M. Bleay
21
Centre for Forensic Science, University of Strathclyde, Glasgow, UK
2
Home Office Scientific Development Branch, Sandridge, UK
For further information, please contact:
Ainsley J. Dominick
Centre for Forensic Science University of Strathclyde
Royal College 204 George Street Glasgow G1 1XW
United Kingdom
ainsley.dominick@strath.ac.uk
Abstract
between comparisons of donors, there is no statistical difference between the left and right hand of our volunteers in terms of fingerprint donation, but there is a statistical difference in terms of DNA shedding with three of our eight donors. Our results also indicate that there is no correlation between fingerprint donation and DNA shedding, meaning that an enhanced fingerprint with full ridge detail will not necessarily give a full DNA profile. In serious crime, these two avenues of evidence must be explored.
Introduction
Finger, palm, and sole areas of the epidermis display a series of friction ridges that take various forms and shapes. Depending on the surface considered, we generally refer to them as fingerprints, palmprints, and soleprints.
DNA is the material that carries genetic information. Each one of the 46 chromosomes within a cell nucleus includes a single piece of double-stranded DNA in which the two strands are wound around each other in a double helix. Every cell in the body has identical DNA, with everyone’s DNA being unique (except for monozygotic twins).
As first proposed by van Oorschot and Jones [1], handling an object associated with a crime may allow sufficient contact to transfer small numbers of cells (trace DNA), which can be successfully profiled. It may also allow potentially identifiable fingerprints to be transferred onto the object. The shedder status of the donor is an important factor as there will be interindividual variations in the amount of DNA left by fingerprints. Also the donation status of the donor will provide interindividual variations in the level of detail present in the fingerprints. The question is, Does a relationship exist between these statuses?
Materials and Methods
Sample Preparation
Eight donors were asked to donate fingerprints and trace DNA for this study. They were assigned numbers to protect their identity.
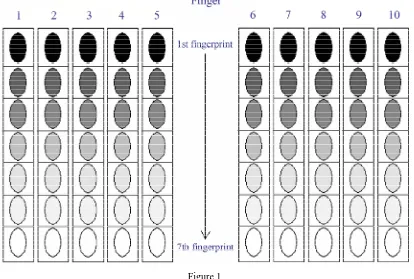
was used down each column, moving systematically down the grid, in consecutive impressions. The amount of material deposited decreased down the grid.
Figure 1
Example of a depletion grid (darker color of fingerprint indicates more fingerprint material deposited).
DNA shedder status was assessed by employing the standard method of holding a tube for 30 seconds, 15 minutes after hands [2]. This was repeated for the left and right hand of the donor. DNA was retrieved from the tubes using a wet and dry combination swabbing technique with cotton swabs (Technical Service Consultants Ltd, Heywood, Lancashire, product code TS6-H). Individuals have a variation in shedding status from day to day [3]. Therefore, the DNA samples were taken on the same day as the depleted fingerprints.
Fingerprint Enhancement
DNA Extraction
Cotton swab tips were placed in 1.5 mL tubes, with the wet and dry swab from each sample placed in the same tube. An unused swab was also placed in a tube as a negative control. Following retrieval, the DNA was extracted using a QIAGEN QIAamp® DNA Micro Kit (QIAGEN, Crawley, West Sussex, cat no. 56304), using the swab extraction protocol [5].
DNA Amplification
Samples were amplified using the AMPFlSTR® SGM Plus® kit (Applied Biosystems, Warrington, Cheshire, cat. no. 4307133) and an ABI 2720 Thermal Cycler (Applied Biosystems, Warrington, Cheshire) using the conditions specified in Cotton et al. [6] The exception to the amplification protocol given was the use of 34 cycles, the recommended number of cycles for LCN DNA [7-8]. The DNA was not quantified and 4.5µL of each extract was amplified. The amplification of each extract was also carried out in triplicate, an extension of the guidelines set out by Gill et al. when dealing with trace levels of DNA [8].
Capillary Electrophoresis and Analysis
The electrophoresis of products was carried out using an ABI 3100-Avant Genetic Analyser (Applied Biosystems, Warrington, Cheshire) according to the manufacturer’s instructions. These results generated through 34-cycle amplification were interpreted with reference to Taberlet et al. [9],Gill et al. [8] and Gill [10].
Results and Discussion
Method Selection
Testing the shedding ability of a donor has been standardized by Lowe et al. [2] and been further investigated by Phipps et al. [3] The most viable way of testing shedding ability of a donor is one experiment on one day, with repeated amplifications of the same DNA extract. This will ensure that the experiment remained controlled [3]. Collecting the fingerprints and the DNA samples on the same day limited the DNA sample collection size. Also, it is not possible to assess DNA shedding using a method similar the fingerprint depletion technique; therefore, the standardized ‘Lowe’ method was employed in this research.
Fingerprint Donation
The quality of the fingerprints must be assessed for the performance of the donor to be compared. The best way of assessing a fingerprint is a matter for debate because of the many variables (e.g. pressure, smearing) that exist with each deposition. Counting visible minutiae is occasionally tried, but can be time consuming and less accurate if not carried out by a fingerprint expert.
[image:5.595.156.439.487.598.2]In this case, the assessment method employed was subjective and estimated the proportion of the developed fingerprint’s clear ridge detail, with a score of 0 to 4 assigned to each fingerprint. This was a much quicker and simpler method for a nonexpert to use rather than counting minutiae. Fingerprints grading is shown in Table 1.
Score Level of Detail
0 No evidence of print 1 0 -1/3 ridge detail 2 1/3 – 2/3 ridge detail 3 2/3 – 1 ridge detail
4 Ridge detail over every point of contact visible
Table 1
Fingerprint scoring system
Finger Score
Donor Thumb Index Middle Ring Little
Left Hand
1 4 3.4 3.7 3.6 2.9 2 4 3.9 3.9 3.9 3.7 3 4 3 3 3.1 3
4 4 4 4 3.9 3.4
5 4 3.4 3 3 2.7 6 3 2.4 2.3 2.9 3
7 3.1 2.6 3 2 3
8 3.6 3 3 3.6 3.4
Right Hand
1 3 3.7 3.6 3 3
2 4 4 3.7 4 3.9 3 3.3 3.3 3.7 3.3 4
4 4 4 3.9 3.4 3.7
5 3.4 3 3.1 4 3.1 6 3 3 3 3 3 7 2.9 3 2.9 3 3 8 4 3.6 3.4 4 3.1
Table 2
Fingerprint score.
The fingerprint scores obtained were inputted into Minitab 15 for statistical analysis to be undertaken. A balanced ANOVA test was conducted that investigated the factors that were varied during the experiment (donor, finger, and hand) to determine their effect on the response variable (fingerprint score). This is measured by the P value, with P < 0.05 indicating the variable had a significant effect on the response, or P > 0.05 indicating no significant effect on the response. The ANOVA test indicated that there was a significant difference (P = 0.000) between the donors. Therefore, an ANOVA test was undertaken for each donor individually. Table 3 shows the ANOVA table generated by Minitab.
ANOVA P Values
Donor Per Finger Per Hand
1 0.297 0.276
2 0.725 0.670
3 0.034 0.058
4 0.858 0.781
5 0.475 0.743
6 0.500 0.141
7 0.592 0.369
[image:6.595.85.514.74.347.2]8 0.950 0.226
Table 3
The ANOVA P values give the following indications:
• There is a slight statistical difference only for donor 3 when comparing all the
fingerprint scores by finger, all other donors show no significant difference. • There is no statistical difference comparing all the fingerprint scores by hand
for each donor.
Therefore there are no observed differences between the scores obtained for each donor per finger or by hand (except marginally by donor 3).
DNA Shedding
In accordance with trace DNA interpretation guidelines [8], Table 4 shows the average percentage of each donors profile that was recovered.
PCR Replicate % DNA Profile
Donor 1st 2nd 3rd
Left Hand
1 4.55 36.36 31.82
2 4.55 27.27 40.91
3 9.09 18.18 18.18
4 9.09 9.09 9.09 5 72.73 45.45 54.55
6 13.64 9.09 9.09
7 27.27 27.27 27.27 8 22.73 13.64 18.18
Right Hand
1 27.27 13.64 13.64 2 9.09 27.27 4.55
3 45.45 45.45 9.09
4 9.09 9.09 9.09 5 9.09 22.73 9.09 6 4.55 9.09 9.09
7 100.00 100.00 100.00
8 0.00 0.00 0.00
Table 4
DNA profiles.
ANOVA P Values
Donor Per PCR Per Hand
1 0.875 0.716
2 0.521 0.499
3 0.618 0.321
4 - -
5 0.824 0.066
6 1.000 0.423
7 - -
8 0.500 0.020
Table 5
ANOVA table for DNA in terms of % DNA profile.
The ANOVA P values give the following indications:
• There is a statistical difference comparing the % DNA profiles by hand for
donor 8 and a slight difference observed with donor 5.
• There is no statistical difference comparing all the % DNA profiles by PCR
only, and comparing the % DNA profiles by hand only of 6 donors. • No results were obtained for donors 4 and 8.
Fingerprint Donation and DNA Shedding
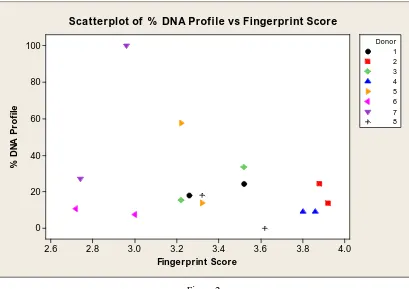
Results of the fingerprint quality assessments and the DNA shedding tests were averaged for each hand, compiled together and plotted in Figure 2, a scatterplot generated by Minitab (the two points indicated on the graph are for left and right hand scores per donor).
4.0 3.8 3.6 3.4 3.2 3.0 2.8 2.6 100 80 60 40 20 0 Fingerprint Score % D N A P ro file 1 2 3 4 5 6 7 8 Donor
[image:9.595.94.503.191.480.2]Scatterplot of % DNA Profile vs Fingerprint Score
Figure 2
Scatterplot of % DNA profile versus fingerprint score.
The graph clearly shows that each donor’s fingerprint scores and % DNA profiles have no relationship. Some of these show a negative slope, some a positive slope, and one no slope at all. This indicates that each donor is an individual, further confirmation on his or her ANOVA P values, and as such, their level of ridge detail present in his or her fingerprint will not necessarily provide a substantial DNA profile. This conclusion suggests that there is no correlation between fingerprint donation and DNA shedding.
The eccrine and sebaceous components of latent fingerprint residue have been very well documented [11-12] but the presence (or absence) of skin cells in a fingerprint is a much more complex issue which needs further investigation. Although, the results of this standardized study indicate that there was no correlation between fingerprint donation and DNA shedding, it does show that the success rate of obtaining a detailed fingerprint and a trace DNA profile is based in the individual donor, but this success may vary with different, uncontrolled scenarios. In forensic terms, a low level of ridge detail in a fingerprint does not necessarily mean that a DNA profile cannot be generated. Therefore, when investigating major crimes, both the fingerprint and the DNA obtained from that print should be analysed.
For further information, please contact:
Ainsley J. Dominick Centre for Forensic Science University of Strathclyde
Royal College 204 George Street
Glasgow G1 1XW
United Kingdom
ainsley.dominick@strath.ac.uk
References
1. van Oorschot, R.A.H. and M.K. Jones, DNA Fingerprints from Fingerprints.
Nature, 1997. 387(19 June 1997): p. 767.
2. Lowe, A., et al., The Propensity of Individuals to Deposit DNA and Secondary Transfer of Low Level DNA from Individuals to Inert Surfaces. Forensic Science International, 2002. 129(1): p. 25-34.
3. Phipps, M. and S. Petricevic, The Tendency of Individuals to Transfer DNA to Handled Items. Forensic Science International, 2007. 168: p. 162-168.
6. Cotton, E.A., et al., Validation of the AMPFlSTR® SGM Plus™ System for use in Forensic Casework. Forensic Science International, 2000. 112(2-3): p. 151-161.
7. Findlay, I., et al., DNA Fingerprinting from Single Cells. Nature, 1997. 389(9th October 1997): p. 555-556.
8. Gill, P., et al., An Investigation of the Rigor of Interpretation Rules for STRs Derived from Less Than 100 pg of DNA. Forensic Science International, 2000. 112(1): p. 17-40.
9. Taberlet, P., et al., Reliable Genotyping of Samples with Very Low DNA Quantities using PCR. Nucleic Acids Research, 1996. 24(16): p. 3189-3194. 10. Gill, P., Application of Low Copy Number DNA Profiling. Croatian Medical
Journal, 2001. 42(3): p. 229-232.
11. Lee, H.C. and R.E. Gaensslen, Advances in Fingerprint Technology. 2nd ed. 2001: CRC Press LLC.
12. Champod, C., et al., Fingerprints and Other Ridge Impressions. 2004: CRC Press LLC.
13. Bandey, H.L. and A.P. Gibson, Fingerprint Development and Imaging Newsletter: The Powders Process, Study 2: Evaluation of Fingerprint
Powders on Smooth Surfaces: February 2006: Publication Number 08/06, Home Office Scientific Development Branch.
14. Wickenheiser, R., Trace DNA: a Review, Discussion of Theory, and Application of the Transfer of Trace Quantities of DNA through Skin Contact