Current Metabolomics, 2014, 2, 000-000 1
2213-235X/14 $58.00+.00 © 2014 Bentham Science Publishers
The Application of Metabolomic Profiling to the Effects of Physical
Activity
Evangelia Daskalaki
1, Chris Easton
2and David G. Watson
1*1Strathclyde Institute of Pharmacy and Biomedical Sciences, University of Strathclyde, Glasgow, United
Kingdom; 2Institute for Clinical Exercise and Health Science, University of the West of Scotland
Abstract: Physical activity and exercise are potent lifestyle interventions for the reduction of several psy-cho-somatic risks, including cardiovascular disease, diabetes and mild-to-moderate depression. The cur-rent review describes the studies which have utilised a metabolomics/ metabolite profiling approach in combination with exercise in the period between 1999-2014 in predominantly healthy subjects (N:64) and in a smaller subset of patient cohorts (N:10) between 2011-2014. A broad range of intervention types were used in both healthy and patient cohorts with varying exercise regimes with or without supplement use. Effects on purine metabolism, which have been known for over 40 years, were by far the most
well-cited and persistent finding. Other reported effects included observations of: glucocorticoid and androgen metabolism, glycolysis and Krebs cycle, gluconeogenesis, fatty acid metabolism, fatty acid oxidation and pantothenic acid, amino acid oxidation, tryptophan metabolism and effects on microbiome metabolites. The discussion section draws observations from the very disparate studies together and links them to the general aspects of human metabolism.
Keywords (6-8): Human, metabolomics, microbiome, physical activity, purine metabolism, training effect.
INTRODUCTION
Physical activity and exercise are potent lifestyle inter-ventions [1] for the reduction of several psycho-somatic risks, including cardiovascular disease (CVD) [2], diabetes [2] and mild-to-moderate depression [1]. According to the most recent reports of the World Health Organisation [3] CVDs were the leading cause of mortality (17.5 million deaths) followed by diabetes (1.5 million deaths). In the UK this translates to more than 200, 000 (37% of total) deaths due to CVD [4]. In fact, the five leading global risks for mor-tality are, to a certain degree, modifiable risk factors includ-ing, high blood pressure (13%), tobacco use (9%), high blood glucose (6%), physical inactivity (6%) and over-weight/obesity (5%) [5]. These risks can be modified by ef-fects elicited by fruit and vegetable consumption (diet modi-fication), moderate alcohol use and physical activity. It has been estimated that the indirect cost of physical inactivity in England is £8.2 billion per annum [6], in developed coun-tries this is 1.5%- 3% of total direct healthcare costs [7], and finally Scotland is one of the least physically active countries in Europe [8]. Regular exercise, a relatively inexpensive treatment [1], can modify but more importantly improve overall quality of life and life expectancy. However, ques-tions remain with regard to adequate duration, frequency and intensity, as well as what type of exercise is optimal for
indi-viduals of different cohorts (i.e. sedentary vs. already active),
and what the molecular mechanisms underlying health
*Address correspondence to this author at the Strathclyde Institute of Phar-macy and Biomedical Sciences, The John Arbuthnott Building, 161 Cathe-dral Street, Glasgow G4 0RE; Tel: (+44) (0) 141 54 82 651; E mail: [email protected]
improvement through exercise are. The answer may depend on various factors such as gender, age, life- style and body mass index (BMI). However, directly investigating the effect of exercise on the human metabolome, via metabolomics-based techniques, can provide new insight into novel pheno-typic responses- giving rise to personalised training regimes that are reflective of the initial metabolic status of each indi-vidual.
investiga-and contributors in energy regulation, trace back as far as the techniques developed in the 1960s that have formed the basis of metabolomics. Starting with human studies, Forrester and Lind (1969) investigated the ATP content from venous efflu-ent of the forearm muscle in response to exercise (i.e. 10% and 20% maximal voluntary contractions), illustrating an increase in ATP post-exercise compared to resting values [11]. Frog and other animal heart (intact and perfused) stud-ies were used, in the 1930s, in order to demonstrate an im-provement in heart beat after injections of nucleic acid de-rivatives [11, 12]. From around 1999 onwards the principal metabolite of interest in a variety of biological fluids for monitoring the effect of exercise is hypoxanthine. Thus a broader consideration of the metabolites affected by exercise is due.
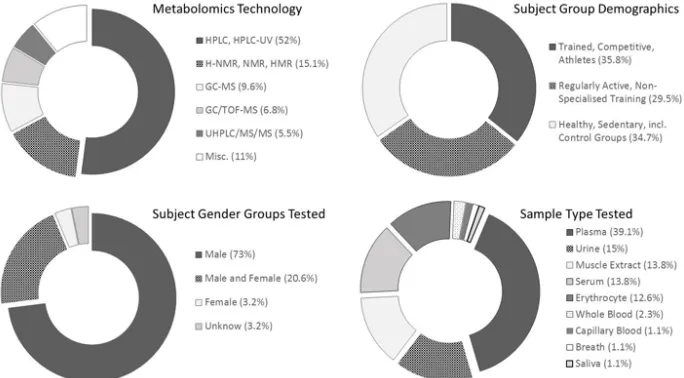
The current review aims to identify the research studies which have utilised a metabolomics/metabolite profiling methodologies to monitor the effects of exercise in predomi-nantly healthy subjects in the period 1999-2014. Based on these criteria 64 papers were selected through the following search engines, Google Scholar (http://scholar.google.co.uk/)
and Pubmed (http://www.ncbi.nlm.nih.gov/pubmed). Fig. (1)
illustrates the main features of the included studies ranging from metabolomics technology, subject group demographics, gender groups as well as sample type tested. A summary
table (Table 1) has been created for each study identified
highlighting the main metabolomics technology used, sub-ject demographics, exercise regime and sampling
time-points. Table 2 contains a summary of the sample type tested
along with main metabolites that were analysed via the me-tabolomics technology accompanied by relative response to exercise where appropriate. The majority of the studies are focused on particular pathways and most of the untargeted metabolomics studies on exercise that have been published within the last four years are in line with the wider
availabil-niques. There is, however, a large variation in the depth of the studies as judged by their success in generating intrigu-ing new hypotheses where there is a sense of the me-tabolome operating in a complex and dynamic fashion in response to a variety of exercise regimes. The discussion in this review will be focused more on the in depth studies, and the ones not included have been placed as supplementary
material in Tables 1 and 2. We have also included a selection
of metabolomics-based studies where exercise was used as a health intervention in the last three years (2011-2014).
STUDIES FOCUSED ON PURINE METABOLISM
Observations on the effects of exercise on purine metabo-lism go back over 40 years. Normally during exercise the energy expenditure is closely related to ATP utilisation. However, during high-intensity exercise the demand for ATP outstrips supply and this causes degradation of total adenine nucleotides [TAN = ATP + ADP (adenosine diphosphate) + AMP] via deamination of AMP (adenosine 5’-monophosphate) to form IMP (inosine 5’-monophosphate) which produces ammonia as a side product [13]. The IMP can then be lost from the muscle cells in the form of hy-poxanthine which accumulates in plasma. Yet, hyhy-poxanthine can be salvaged by hypoxanthine-guanine phosphoribosyl transferase (HGPRT). Several papers have observed that the hypoxanthine salvage process tends to be more efficient in trained individuals and that, along with other purine metabo-lites, its concentrations in blood can provide an indication of the effectiveness of a training regimen- that can also be illus-trated by an improvement in the level of ATP re-synthesis [14]. Following exhaustive exercise muscle urate levels were also shown to increase [15]. Interestingly, the non-enzymatic oxidation of urate results in the formation of allantoin which makes it possible to assess to what extent it is acting as an antioxidant.
Fig. (1). Main features of the research studies selected for the current review excluding patient cohort studies. The most prevalent metabolomics technology utilised is high perform-ance liquid chromatography (HPLC), via plasma of healthy trained/athlete and active male groups.
Abbreviations: HPLC-UV: high performance liquid chromatography- ultraviolet detection; 1
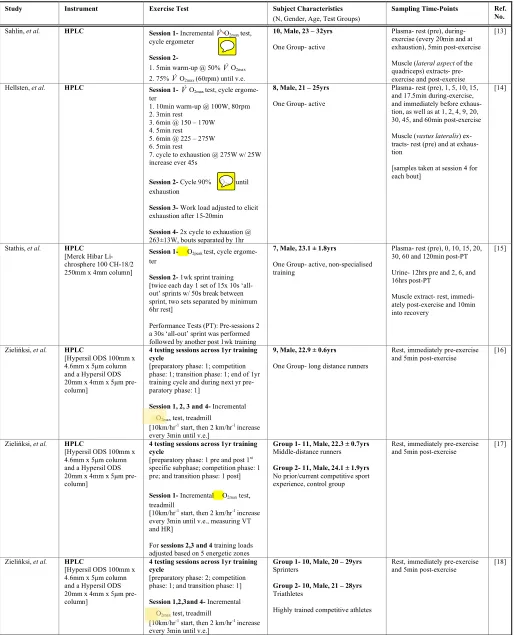
[image:2.612.141.483.477.666.2]Table 1. Detailed Study Features of Metabolomics-based Articles* since 1999 with Main Study Aim to Investigate Effect of Exer-cise on Different Human Bio-fluid Metabolomes.
Study Instrument Exercise Test Subject Characteristics (N, Gender, Age, Test Groups)
Sampling Time-Points Ref. No.
Sahlin, et al. HPLC Session 1- Incremental V!O2max test, cycle ergometer
Session 2-
1. 5min warm-up @ 50% V!O2max
2. 75% V!O2max (60rpm) until v.e.
10, Male, 23 – 32yrs
One Group- active
Plasma-rest (pre), during-exercise (every 20min and at exhaustion), 5min post-exercise
Muscle (lateral aspect of the quadriceps) extracts- pre-exercise and post-pre-exercise
[13]
Hellsten, et al. HPLC Session 1-V!O2max test, cycle ergome-ter
1. 10min warm-up @ 100W, 80rpm 2. 3min rest
3. 6min @ 150 – 170W 4. 5min rest
5. 6min @ 225 – 275W 6. 5min rest
7. cycle to exhaustion @ 275W w/ 25W increase ever 45s
Session 2- Cycle 90% O2max until
exhaustion
Session 3- Work load adjusted to elicit exhaustion after 15-20min
Session 4- 2x cycle to exhaustion @ 263±13W, bouts separated by 1hr
8, Male, 21 – 25yrs
One Group- active
Plasma- rest (pre), 1, 5, 10, 15, and 17.5min during-exercise, and immediately before exhaus-tion, as well as at 1, 2, 4, 9, 20, 30, 45, and 60min post-exercise
Muscle (vastus lateralis) ex-tracts-rest (pre) and at exhaus-tion
[samples taken at session 4 for each bout]
[14]
Stathis, et al. HPLC [Merck Hibar Li-chrosphere 100 CH-18/2 250mm x 4mm column]
Session 1- O2peak test, cycle
ergome-ter
Session 2- 1wk sprint training [twice each day 1 set of 15x 10s ‘all-out’ sprints w/ 50s break between sprint, two sets separated by minimum 6hr rest]
Performance Tests (PT): Pre-sessions 2 a 30s ‘all-out’ sprint was performed followed by another post 1wk training
7, Male, 23.1 ± 1.8yrs
One Group- active, non-specialised training
Plasma-rest (pre), 0, 10, 15, 20, 30, 60 and 120min post-PT
Urine- 12hrs pre and 2, 6, and 16hrs post-PT
Muscle extract- rest, immedi-ately post-exercise and 10min into recovery
[15]
Zielińksi, et al. HPLC
[Hypersil ODS 100mm x 4.6mm x 5µm column and a Hypersil ODS 20mm x 4mm x 5µm pre-column]
4 testing sessions across 1yr training cycle
[preparatory phase: 1; competition phase: 1; transition phase: 1; end of 1yr training cycle and during next yr pre-paratory phase: 1]
Session 1, 2, 3 and 4- Incremental O2max test, treadmill
[10km/hr-1 start, then 2 km/hr-1 increase
every 3min until v.e.]
9, Male, 22.9 ± 0.6yrs
One Group- long distance runners
Rest, immediately pre-exercise and 5min post-exercise [16]
Zielińksi, et al. HPLC
[Hypersil ODS 100mm x 4.6mm x 5µm column and a Hypersil ODS 20mm x 4mm x 5µm pre-column]
4 testing sessions across 1yr training cycle
[preparatory phase: 1 pre and post 1st
specific subphase; competition phase: 1 pre; and transition phase: 1 post]
Session 1- Incremental O2max test,
treadmill
[10km/hr-1 start, then 2 km/hr-1 increase
every 3min until v.e., measuring VT and HR]
For sessions 2,3 and 4 training loads adjusted based on 5 energetic zones
Group 1- 11, Male, 22.3 ± 0.7yrs Middle-distance runners
Group 2- 11, Male, 24.1 ± 1.9yrs No prior/current competitive sport experience, control group
Rest, immediately pre-exercise and 5min post-exercise [17]
Zielińksi, et al. HPLC
[Hypersil ODS 100mm x 4.6mm x 5µm column and a Hypersil ODS 20mm x 4mm x 5µm pre-column]
4 testing sessions across 1yr training cycle
[preparatory phase: 2; competition phase: 1; and transition phase: 1]
Session 1,2,3and 4- Incremental O2max test, treadmill
[10km/hr-1 start, then 2 km/hr-1 increase
every 3min until v.e.]
Group 1- 10, Male, 20 – 29yrs Sprinters
Group 2- 10, Male, 21 – 28yrs Triathletes
Highly trained competitive athletes
[image:3.612.65.579.88.723.2]Study Instrument Exercise Test Subject Characteristics (N, Gender, Age, Test Groups)
Sampling Time-Points Ref. No.
Zielińksi, et al. HPLC
[Hypersil ODS 100mm x 4.6mm x 5µm column and a Hypersil ODS 20mm x 4mm x 5µm pre-column]
1yr training cycleincl. preparatory, competitive and transition phases
Session 1- Incremental V!O2max test
precompetitive phase, treadmill
[start @ 10km/hr-1 w/ 2 km/hr-1 increase
every 3min until v.e.]
71, Male, Healthy and Highly Trained Athletes
Group 1- 28, 19 – 28yrs, triathletes Group 2- 12, 20 – 26yrs, long-distance runners
Group 3- 13, 20 – 26yrs, middle-distance runners
Group 4- 18, 19 – 29yrs sprinters
Pre-exercise and 5min
post-exercise [19]
Zielińksi, et al. HPLC
[Hypersil ODS 100mm x 4.6mm x 5µm column and a Hypersil ODS 20mm x 4mm x 5µm pre-column]
3 testing sessions across 1yr training cycle
[preparatory phase: 1; competition phase: 1; and transition phase: 1] Session 1- Incremental V!O2max test,
treadmill
[start @ 10km/hr-1 w/ 2 km/hr-1 increase
every 3min until v.e.] Training Loads:
Group 1- 7 times a week, total weekly training time of 8–10hrs, number of training session in 1-year cycle was 315 Group 2- 5 times a week, total weekly training time of 5hrs, number of train-ing session in 1-year cycle was 221 Group 3- 3 times a week, total weekly training time of 3hrs, number of train-ing session in 1-year cycle was 123
30, Male, Middle-aged Runners
Group 1- 11, 46 ± 3.8yrs, elite master runners
Group 2- 9, 45.1 ± 4.7yrs, amateur runners
Group 3- 10, 45.9 ± 6.1yrs, recrea-tional runners
Pre-exercise and 5min
post-exercise [20]
Dudzinska, et al. HPLC Session 1- Continuous effort test w/ progressively increasing intensity 1. 5min @ 25W, warm-up 2. Start 70W, cadence 70rpm 3. 20W increase every 3min until max effort reached
22, Male, 21.9 ± 2.33yrs
One Group- healthy
Immediately pre- and post- exercise, and 30min post- exer-cise
[21]
Bianchi, et al. HPLC Group 1- All out 4min aerobic/ an-aerobic exercise
Group 2- Soccer match
Group 3- Marathon
52 athletes
Group 1-8, cycle pursuers, 20-25yrs Group 2- 19, soccer players, 17-20yrs Group 3- 25, marathon runners, 22-34yrs
Pre-exercise and 5min of cessa-tion
[23]
Gerber, et al. HPLC
[Gemini C18, 5 µ (150 ×
4 mm) column]
Session 1-V!O2peak
1. 3x3min submax. workloads @ 50, 100 and 150W
2. 1min workload increments of 25W until v.e.
[rpm btw 80-90]
Session 2- A: CON
1. 30min @ 50% V!O2peak
2. 60min recovery in supine position or B: HIIE
1. 1min blocks of 20s @ 150% V! O2peak separated with 40s passive
recov-ery, 30min total length
2. 60min recovery in supine position
Session 3- A or B
[sessions 2 and 3 separated by 1wk]
8, Male, 18- 35yrs
One Group- healthy untrained
Plasma at rest, during exercise at 1, 3, 5, 10, 15, and 30min and at 5, 10, 20, 30, and 60min post-exercise
Urine collected overnight before trial and following 60min post-exercise.
[24]
Stathis, et al. HPLC Session 1-V!O2peak test, cycle
ergome-ter
[3min at 3 submx work rates followed by > work rate every min until v.e.] Session 2- 5 days of ingestion of placebo (calcium carbonate) OR allopurinol (300mg tablet) followed by 8 x 10s ‘all-out’ sprints w/ 50s break between sprints.
Session 3- 5 days of ingestion of placebo OR allopurinol (reversed) followed by
8 x 10s ‘all-out’ sprints w/ 50s break between sprints.
7, Male, 24.9 ± 3yrs
Active but non-specifically trained
[V!O2peak of 48.1 ± 6.9mL.kg-1.min-1]
Plasma- rest (pre), 0, 10, 15, 20, 30, 60 and 120min post- final sprint
Urine-12hrs pre and 2, 6, and 16hrs post-PT
(Table 1). contd….
Study Instrument Exercise Test Subject Characteristics (N, Gender, Age, Test Groups)
Sampling Time-Points Ref. No.
Subudhi, et al. HPLC 10 Day Summer Training Camp
Day 1-4: dry land training activities at sea level
Day 5: travel and rest
Day 6-10: on snow training btw 2000-2900m
17, Male
U.S. National Alpine Ski Team
Day 1 first thing in the morning, Day 2 post-training, and Day 10 post-training session
[26]
Chevion, et al. HPLC
[Superpher 100RP-18, 5µm column 250 x 4mm, Merck]
Monitored across a two wk period as part of a 6 month training program, with a 5 days/wk training regime
Exercise involved a 50 and 80km fast paced march across unpaved terrain with additional load of 35kg.
31, Male, 19 ± 1yr
Healthy
[ O2max of 65.7 ± 0.6 mL.kg-1.min-1]
Pre-exercise and immediately post the 50 and 80km marches [27]
Ramel, et al. HPLC Session 1-
1. Familiarisation with the 10 exercises of the resistance exercise circuit (i.e.bench press, leg press, latissimus dorsi pull, leg extension, shoulder press, triceps exercise, crunch, vertical row, biceps curl and pull up)
2. one repetition maximum for each exercise evaluated
3. for exercise crunch max number of repetitions evaluated
Session 2-
1. warm- up on a cycle ergometer (15 min, 75W)
2. submax resistance exercise circuit at 75% of 1 repetition maximum. Recov-ery between stations set to 1min.
Group 1- 7, Male, 31.3 ± 10.2yrs, resistance trained
Group 2- 10, Male, 28.2 ± 3.9yrs, non-resistance trained
30min pre- and post- exercise [28]
Kandar, et al. HPLC
[Discovery C18, 150 x 4mm i.d., 5 µm (Supelco) and LiChroCart 125 x 4, Purospher Star RP-18e, 5µm; Merck columns]
10min run @ speed of ~9.6 ± 0.3km.hr-1 on flat ground (4 x 400m
oval track; 1600 ± 50 m)
30, Male and Female
Female (N:15) 22-36yrs Male (N:15) 21-40yrs
Healthy
Pre-exercise, immediately post- and 60min post-exercise. [29]
Gatti, et al. HPLC-UV
[Supelco Discovery DS 18 150mm x4.6mm, i.d. 3µm particles, 120 Ǻ pore diameter]
CE
Competitive mountain bike race of
~102km Group 1- 21, Male, 17.3 ± 0.5yrswell- trained cyclists ,
Group 2- 10, Male, 24.6 ± 3.6yrs, sedentary controls
Group 1- Rest, Pre- race (10-15min), and 10-15min after completion
Group 2- Samples taken at similar time during the day
[31]
Dovio, et al. HPLC-ESI-MS-MS [Phenomenex LUNA C8 2 x 50 mm, 3µm particle size column]
HPLC-UV [C18 reversed-phase column (Lichrocart 250-4, Lichrospher 100 RP-18, 5µm, VWR)
Session 1 – O2max [ergobike] and
Maximal upper limbs strength [incre-mental max single lifting test on hori-zontal bench, with 3min rest btw reps] Session 2- randomly assigned to Group 1: Endurance then strength tests Group 2: Strength then endurance
Session 3-
Group 1: Strength then endurance Group 2: Endurance then strength tests
[Session 2 and 3 separated by 1wk]
Tests- Endurance:
1. 10min warm-up @ 40% O2max
2. 30-40min @ 80% O2max
3. 10min cool down @ 50W plus stretching
Strength: 1. 10min warm-up
2. (x2) warm-up on the bench (1 x 10 reps of the weight-free bar and 1 x 6 reps @ 40% of 1 repetition maximum) 3. 4 max series (3-6 reps until v.e.) @ 80% of 1 repetition maximum 4. 3min rest w/in the series plus stretch-ing
15, Male, 28 ± 1yr
Healthy trained
6hr urine samples btw
Study Instrument Exercise Test Subject Characteristics (N, Gender, Age, Test Groups)
Sampling Time-Points Ref. No.
Giraldo, et al. HPLC Session 1 – O
2max
[ergometer, no specific protocol de-scribed]
Then assigned to:
Group 1 (N:15)- 45min @ 55% O2max
Group 2 (N:15)- 1hr @ 70% O2max
30, Female, 20-24yrs
Healthy sedentary untrained with not involved in exercise program in the previous 24 months pre testing
[Testing occurred during follicular phase of menstrual cycle]
Pre-exercise, immediately post- exercise and 24hr post [33]
Degoutte, et al. HPLC
[C18 column] Session 1- 1. 20min warm-up 2. 10min rest 3. 5min judo match
16, Male, 18.4 ± 1.6yrs
National judoists
[ O2max of 55.7 ± 0.5 mL.kg-1.min-1]
Rest, 3min, 1 and 24hr
post-match [36]
Gangemi, et al. HPLC
[Waters Symmetry C18, 3µm, 2.1 x 150mm col-umn]
Session 1-
Exercise test on cycle ergometer 1. initial load set to 25W for 2min 2. > 25W every 2min until subject theoretical heart rate max reached
9, Male and Female, 29.3 ± 3.5yrs
healthy
Pre-exercise, 3min post- exer-cise, 6 and 24hr into recovery
[37]
Sparling, et al. HPLC/MS
[Hewlett Pckard octade-cyl silica Hypersil colum (100 x 4.6mm i.d., 5µm) reversed-phase]
Group 1 and 2-
Either on treadmill or cycle ergometer 1. 5min warm-up
2. > work rate to elicit heart rate of 70-80% of max
3. sustain for 45min
Group 3- Seated for 50min
24, Males, 23.7 ± 9.4yrs Exercising for 6 months pre-trial (≥30min running/cycling, ≥4/wk)
Assigned to following groups depend-ing on pre-traindepend-ing regime:
Group 1 (N:8)- Running Group 2 (N:8)- Cycling Group 3 (N:8)- Control
Pre- and post- exercise sessions [38]
Dudzinska, et al. HPLC
Continuous effort and progressive cycle test 1. 5min warm-up @ 25W 2. Increase to 70W w/ 70rpm 3. >20W every 3min until v.e. or until unable to maintain 70rpm.
44, Male, 18.5 ± 2.92yrs
One Group- healthy
[ O2max: 50.2 ± 6.26mL.kg-1.min-1]
Pre-exercise, immediately post- and 30min post-exercise. [39]
Lewis, et al. LC/MS/MSa
Group 1-testing [bicycle ergometer, 10-25W/min Cardiopulmonary exercise with > ramp cycle]
Group 2- Exercise treadmill testing [Bruce protocol]
Group 3- Boston Marathon
Group 1- 8, Male and Female, 48 ± 14yrs
Group 2-
(a) 40, Male and Female, 58 ± 13yrs (b) 25 (validation group), Male and Female, 59 ± 12yrs
Group 3- 25, Male and Female, 42 ± 9yrs
Amateur runners
Group 1- Plasma from the superior vena cava and pulmo-nary artery at baseline, peak exercise and 60min post-exercise
Group 2- Plasma at baseline, peak exercise and 60min post-exercise
Group 3- Plasma at pre-exercise and post-exercise
[40]
Pohjanen, et al. GC/TOF-MS Session 1- O
2peak test, cycle
ergome-ter
Session 2- 90min cycle
[each 90min cycle consists of 9 x 10min equal sets]
Sets of 10min each: 1. 2min @ 40% 2. 6min @ 60% 3. 2min @ 85% O2peak
[Session 2 completed in total 4 times, 1wk apart permitted per session]
24, Male, 25.7 ± 2.7yrs
One Group- healthy, regularly trained
O2peak : 59.1 ± 7.3 mL.kg-1.min-1
Pre-exercise and immediately post-exercise [41]
Yan, et al. GC/TOF-MS 2wk Training Program
[11 sessions/wk, 30hrs in total of tech-nical and aerobic exercise]
Male
Group 1- junior trained rowers, 20.2 ± 1.1yrs
Group 2- senior trained rowers, 23.0 ± 2.7yrs
Group 3- sex and age matched con-trols, healthy
Pre-training, at 1wk and post 2wk training
[42]
Pechlivanis, et al.
1H-NMR
[5mm inverse probe] Group A Session- max runs, the two runs separated by 10s 3 sets of 2x 80m rest
Group B Session- 3 sets of 2x 80m max runs, the two runs separated by 1m rest
[20min rest between sets for both groups]
12, Male, Moderately Trained
Group A- 21 ± 2yrs Group B- 20 ± 1yrs
Pre-exercise and 35min
(Table 1) contd….
Study Instrument Exercise Test Subject Characteristics (N, Gender, Age, Test Groups)
Sampling Time-Points Ref. No.
Pechlivanis, et al.
1H-NMR
[5mm inverse detection probe]
8wks training programme with 3 exercise sessions per week. 1. First 4wks = each session incl. 2 sets of 80min max runs
2. Second 4wks = each sessions incl. 3 sets of 80min max runs
14, Male, Healthy and Moderately Trained
Group A- 21 ± 2yrs, each run per session separated by 10s rest Group B- 20 ± 2yrs, each run per session separated by 1min rest
Pre-exercise and 30min post-exercise
[Before and after 8wks of train-ing]
[44]
Mukherjee, et al. 1H-NMR
[5mm broadband probe] Session 1- V!O2peak Session 2-
1. 6min cycling @ ~25W with cadence 80rpm,
2. 45min cycling @ 60% WRpeak,
3. 90% WRpeak until v.e.
17, Male, 50- 60yrs
Group 1- 9 master athletes Group 2- 8 healthy untrained
Pre-exercise, immediately post-exercise and 24hr post-post-exercise [45]
Santone, et al. 1
H-NMR
[5mm triple resonance probe]
Session 1- 1. Warm-up (running)
2. YO-YO Test, 2 x 20m shuttle runs with 10s recovery between bouts, starting speed 10km/hr-1
14, Male, 23 ± 3yrs
One Group- healthy elite soccer players
Pre-exercise and post-exercise [46]
Lustgarten, et al. UHPLC/MS/MS [method for acidic and basic feature identifica-tion]
GC-MS
Session 1-V!O2max test, treadmill
[following Bruce protocol (1971)]
77, Male and Female, 18 – 35yrs
One Group- healthy
Pre-exercise sample [47]
Kujala, et al. 1H-NMR
Longitudinal physical activityured with the Metabolic Equivalent meas-(MET) index.
PART 1:
Finnish Twin Cohort Study 32, male and female same-sex twins, 50 – 74yrs
Group 1- 16 healthy active Group 2- 16 healthy inactive
PART 2:
Pieksämaki Cohort Study 230, male and female, 41-62yrs Group 1- 115 healthy active Group 2- 115 healthy inactive
PART 3: Young Finns Study
600, male and female, 30 – 45yrs Group 1- 300 healthy active Group 2- 300 healthy inactive
PART 4:
Northern Finland Birth Cohort 1966
1244, male and female, 31yrs Group 1- 622 healthy active Group 2- 622 healthy inactive
PART 1: Single sample post 32yrs of follow-up (2007)
PART 2: Single sample post 5yrs of follow up (2003 and 2004)
PART 3: Single sample post 5yrs of follow up (2007)
PART 4: Single sample post 5yrs of follow up (1980 and 1997-1998)
[48]
Netzer, et al. Targeted MS/MSb Session 1- Incremental bicycle
ergome-ter testc
[Increments increase by 25W per step until maximum capacity reached]
30, Male and Female, 38.33 ± 7.16yrs
One Group- active and physically fit
Pre-exercise, at each step until (incl.) max performance
[49]
Lehmann, et al. UPLC-qTOF-MS
HPLC
Session 1-
1. Running velocity @ individual anaerobic threshold, determined with an incremental exercise test, treadmill [6km/h-1, > 2km/h-1 every 3min]
2. O2max, ramp test
[8km/h-1, > 1km/h-1 every 0.5 min until
v.e.] Session 2-
Group 1: 60min continuous run of moderate intensity
93% of the VIAT (~75% of O2max)
Group 2: 120min continuous run 70% of the VIAT (~55% O2max)
Group 1- 13, Male, 32.6 ± 6.1yrs O2max:56.5 ± 1.4mL.kg-1.min-1
Group 2- 8, Male, 30.9 ± 5.8yrs O2max:63.0 ± 2.0mL.kg-1.min-1
[both groups consisted of healthy, lean subjects]
Study Instrument Exercise Test Subject Characteristics (N, Gender, Age, Test Groups)
Sampling Time-Points Ref. No.
Enea, et al. 1H-NMR
[5mm broadband inverse probe]
Session 1-
(a) Progressive incremental V!O2max
test, cycle ergometer 1. 4min warm-up @ 75W 2. Power output increased by 25W every min until v.e.
(b) Four 6s sprints against increasing braking force (1st set 2kg then > by 1kg
per sprint), 5min recovery after each sprint
Session 2-
1. 30s sprint on cycle ergometer @ max speed, individually determined resis-tance
2. 90min rest in recumbent position
Session 3-
1. 4min warm-up, 75W 2. 70% V!O2max until v.e.
3. 5min active recovery 4. 90min rest in recumbent position
22, Female
[on oral contraceptive pills for 6 months]
Group 1- 9, 22.1 ± 0.6yrs, untrained recreational exercisers
Group 2- 12, 21.8 ± 1.0yrs, trained (6: judoists; 6: cy-clists/triathletes)
Pre-exercise and 30min post
each exercise session [51]
Neal, et al. 1
H-NMR
29wk Training Program 1. 2wks general testing
[2x 40km time trial, peak power output test, cycle ergometer]
2. 4wks detraining 3. 1wk general testing 4. 6wks POL or THR, 3days/wk 5. 1wk general testing 6. 4wk detraining 7. 1wk general testing 8. 6wks POL or THR, 3days/wk 9. 1wk general testing
Polarised training model (POL) training intensity: 80% low intensity, 0% mod-erate intensity, 20% high-intensity
Threshold training distribution (THR) training intensity: 57% low intensity, 40% moderate intensity, 0% high-intensity
12, Male, 37 ± 6yrs
One Group Cross Over Design- Trained road cyclists
[during general testing wk] [52]
Peake, et al. HPLC GC-MS
[ZB1701(Zebron) capil-lary column (30m x 250 µm(ID) x 0.15 µm film thickness]
Session 1, 2- O2max
Graded exercise test on cycle ergometer until v.e.
1. 5-10min @ self-selected intensity 2. Test start at 100W and power > by 15W every 30s until v.e.
[cadence kept at ≥60 r.p.m]
Session 3- High-intensity interval training (HIIT) familiarisation 10 x min intervals @ power output corresponding to ~80% O2max within
a 2min recovery @ 50W btw intervals. [Familiarisation conducted 48hr post 2nd
O2max and used to determine duration
required to complete the same work rate on a cycle with continuous power output ~65% O2max which is for the
moderate-intensity continuous exercise (MOD)
Session 4- randomly assigned to HIIT or MODthen reversed
[at least 1wk post familiarisation and 7 day break between MOD or HIIT]
10, Male, 33.2 ± 6.7yrs
Well trained cyclists and triathletes
[ O2max: 4.8 ± 0.3L/min]
Pre-exercise, immediately exercise, 1 and 2hrs post-exercise
(Table 1) contd….
Study Instrument Exercise Test Subject Characteristics (N, Gender, Age, Test Groups)
Sampling Time-Points Ref. No.
Nieman, et al. UHPLC/MS/MS [method for acidic and basic feature identifica-tion]
GC-MS
Session 1- Graded V!O2max test,
tread-mill Session 2-
Day 1: 70% V!O2max for 2.5hr
Day 2: as above
Day 3: as above
15, Male and Female, 19 – 45yrs
One Group- healthy trained competi-tive long distance runners
Pre-exercise, post-exercise on day 3 and 14hr post-exercise after recovery rest
[54]
Neiman, et al. UHPLC/MS/MS [method for acidic and basic feature identifica-tion]
GC-MS
Session 1- Graded exercise test (25W increment every 2min, starting at 150W)
Session 2- 75km cycling on pre-programmed mountainous course with moderate difficulty
19, Male, 27- 49yrs
One Group- healthy competitive road racers
Pre-exercise, immediately post-exercise, 1.5hr post-exercise and 21hr post-exercise
[55]
Chorell, et al. GC/TOF-MS [10m x 0.18mm i.d. fused silica capillary column]
Session 1- V!O2max test
Session 2- Nutritional load (all subject) Blood samples collected in the fasting state (pre) and every fifteen minutes for 90 minutes following a nutritional load. The nutritional load consisted of 1g CHO, 0.2g proteins and 0.1g fat per kg body weight.
Session 3- Exercise with or without nutritional load
65min strenuous ergometer cycling session with a workload related to their own V!O2max
1. 20min @ 55% V!O2max
2. 25min @ 70% V!O2max
3. 10min @ 55% V!O2max
4. 2min all-out 5. 8 min @ 30% V!O2max
6. Given either nutritional load OR water
7. 6h recovery
8. Exercise session (as above) followed by nutritional load (only for subjects that were given nutritional load earlier)
27, Male
Group 1- 7, 28.16 ± 2.7yrs, High
fitness (nutrition) with V!O2max 63.20
± 2.93mL.kg-1.min-1
Group 2- 6, 25.58 ± 1.77yrs, High fitness (water) with V!O2max 63.67 ±
2.8mL.kg-1.min-1
Group 3- 7, 26.30 ± 5.30yrs, Low normal (nutrition) with V!O2max 44.57
± 5.62mL.kg-1.min-1
Group 3- 7, 24.04 ± 1.83yrs, Low normal (water) with V!O2max 42.71 ±
2.87mL.kg-1.min-1
For first exercise session: Pre- exercise, during resting (pre), immediately after nutritional load/water intake as well as every 15min min for the follow-ing 60min.
For second exercise session: Pre- (during resting), immedi-ately post- exercise and every 15min for the following 45min.
[56]
Thysell, et al. GC/TOF-MS Session 1-V!O2peak test, cycle
ergome-ter
Session 2- 90min cycle
[each 90min cycle consists of 9 x 10min equal sets]
Sets of 10min each: 1. 2min @ 40% 2. 6min @ 60% 3. 2min @ 85% V!O2peak
[Session 2 completed in total 4 times, 1wk apart permitted per session]
24, Male, 25 ± 2.7yrs
One Group- healthy, regularly train-ing
Pre-exercise and immediately post-exercise [57]
Morris, et al. GC-MS Session 1- V!O2max test, cycle
ergome-ter
1. 3min warm-up,
2. 4min steady state workloads @ 15%, 35%, 55% and 75% (of estimated max power)
[workloads estimated from theoretical
!
VO2max]
65, Male and Female, 18 – 61yrs
Group 1- healthy high fitness Group2- healthy low fitness
[groups created based on lower and upper quartiles of V!O2max results]
Pre-exercise sample
[58]
Sheedy, et al. 1
H-NMR
[5mm triple resonance cryoprobe]
18 months training program incl. 3 x weekly exercise sessions on non-consecutive days.
Each session should be a combination of multi-component progressive resis-tance training and weight bearing activities
80, Male, Middle-aged, Healthy
Group 1- 20, exercise and calcium + vitamin- D3 fortified milk
Group 2- 20, exercise alone Group 3- 20, calcium + vitamin- D3
fortified milk alone Group 4- Control
[Emphasis made by authors between groups 1,2 vs. control and baseline samples from groups 1,2]
Pre-exercise (baseline) and 18 months post training program
Study Instrument Exercise Test Subject Characteristics (N, Gender, Age, Test Groups)
Sampling Time-Points Ref. No.
Nieman, et al. UHPLC/MS/MS2 [method for acidic and basic feature identifica-tion]
GC-MS
[C18 Sep Pak column]
Session 1- Graded V!O2max test,
tread-mill
Session 2- 2wks of supplementation with either polyphenol soy protein complex or placebo accompanied by normal training.
Session 3- 3 days running bout exercise (2.5h/day on treadmill @ ~70%
!
VO2max) accompanied by supplements.
31, Male and Female, Competitive half and full marathon road racers
Group 1- 16, Male and Female, 33.7 ± 6.8yrs, intervention group Group 2- 15, Male and Female, 35.2 ± 8.7yrs, placebo group
Pre-day 1 exercise, post- day 3 exercise and 14hrs post-exercise at day 4
[60]
Nieman, et al. GC-MS
[C18 Sep Pak column]
Session 1- Graded exercise test (25W > every 2min, starting at 150W)
Session 2- 75km time trial (1wk post session1)
Randomly assigned to bananas OR 6% CHO
Session 3- 75km time trial (3wk post session2)
Reversed supplement conditions.
[Prior to session 2 and 3 subjects in-gested 0.4 g/kg carbohydrate from bananas OR from a standard 6% CHO. During exercise subjects ingested 0.2 g/kg body weight every 15min of bananas or CHO]
14, Male, 18–45yrs
Competitive road cyclists
Pre-exercise and supplementa-tion, immediately post- 75km time trial, and 1hr post-exercise
[61]
Chorell, et al. GC/TOF-MS [10m x 0.18mm i.d. fused silica capillary column]
Session- O2peak
Session 2- 90min of ergometer cycling Each 10min set repeated 9 times with-out rest: 2min @ 40%, 6min @ 60% and 2min @ 85% O2peak
1 of 4 beverages immediately post completion of the 90min cycling, each subject completed all 4 tests in a ran-domized order, ingesting 1 beverage per test. 100 mL of water was ingested as well as at +15, +30, and +60 min post- exercise
Beverage 1- 5 dL water
Beverage 2- low low CHO (1g CHO per kg body weight in water (16% w/v)) Beverage 3- high CHO (1.5g CHO per kg body weight in water (24% w/v)) Beverage 4- low CHO-protein (1g CHO per kg ody weight in water (16% w/v) + 0.5g protein per kg body weight)
24, Male, 25.7 ± 2.7yrs [ O2peak 59.1 ± 7.3mL.kg-1 .min-1]
Pre-exercise, immediately post and at 15, 30, 60 and 90min post-exercise
[62]
Abbreviations:V!O2max: maximal oxygen consumption; CON: constant steady state exercise; HIE: high intermittent exercise; W: Watts; WRpeak: peak work rate; v.e.: volitional
exhaustion; rpm: revolutions per minute; VT: Ventilator threshold; HR: heart rate; TT: time trial.
*
Articles have been presented in order of appearance.
atriple quadrupole mass spectrometer operated in electrospray ionization mode using a turbo ion spray LC-MS interface. bNo details given by authors regarding specific metabolomics-based technology and method.
Table 2. Metabolite Details as Presented from the Exercise Metabolomics Literature and Identified Through a Metabolomics-based Technology.
Study Sample Tested
(Plasma:P; Erythrocytes:E; Urine:U; Serum: S; Muscle Extract:ME; Saliva:Sa, Breath:B; Whole Blood:WB; Capil-lary Blood:CB)
Metabolite Pathways
(↓: reduced post- exercise, ↑: increased post-exercise)
Ref. No.
Sahlin, et al. P and ME Hypoxanthine, ↑ (P)
Xanthine, ↑ (P) Urate,↑ (P) IMP ATP AMP
[13]
Hellsten, et al.
P and ME (Vastus Lateralis) IMP, ↑ (ME) Hypoxanthine, ↑ (P) Urate, ↑ (ME) Allantoin, ↑ (ME)
[14]
Stathis, et al. P, U and ME (Vastus Lateralis) ATP, ↑ (ME) IMP, ↓ (ME)
Inosine, ↓ (P) and ↑ (U) 2 hour post-exercise Hypoxanthine, ↓ (P) and ↑ (U) 2 hour post-exercise Uric acid, ↓ (P) and ↑ (U) 2 hour post-exercise
[15]
Zielińksi, et al.
P and E Hypoxanthine (P)
Xanthine (P) Uric Acid (P) HGPRT (E)
(Significant changes observed for each metabolite across the 1 year training cycle)
[16]
Zielińksi, et al.
P and E Hypoxanthine (P)
Xanthine (P) Uric acid (P) HGPRT (E)
(Higher anaerobic exercise training decreases post-exercise hypoxanthine and uric acid with an increase in HGPT- this relationship is reversed when athlete reaches transition phase)
[17]
Zielińksi, et al.
P and E Hypoxanthine, ↑ (P)levels in group1 vs. group 2 during rest and post-exercise across 1yr training program
Xanthine (P) Uric acid (P)
HGPRT, ↑(E) during rest with ↑exercise training intensity
[18]
Zielińksi, et al.
P and E Hypoxanthine (P),good predictor of fitness Xanthine (P)
Uric acid (P) HGPRT (E)
[19]
Zielińksi, et al.
P and E Hypoxanthine (P), Group1 continuous ↓ across three tests, Group2 ↓ in 1st
and 2nd tests, Group 3 no change
HGPRT (E), Group1 continuous ↑ across three tests, Group2 ↑ in 1st and 2nd
tests, Group 3 no change
[20]
Dudzinska,
et al.
WB and E ADP, ↓ (E) post 30min recovery
AMP, ↓ (E) post 30min recovery
IMP, ↑ (E) immediately post and ↓ (E) post 30min recovery Inosine, ↓ (WB) post 30min recovery
Hypoxanthine, ↑(WB) immediately post, ↑ (WB) post 30min recovery
[21] 01
[image:11.612.67.579.80.711.2]Study Sample Tested
(Plasma:P; Erythrocytes:E; Urine:U; Serum: S; Muscle Extract:ME; Saliva:Sa, Breath:B; Whole Blood:WB; Capil-lary Blood:CB)
Metabolite Pathways
(↓: reduced post- exercise, ↑: increased post-exercise)
Ref. No.
Bianchi, et al.
P Hypoxanthine, ↑ [23]
Gerber, et al. P and U Hypoxanthine, ↑(P) Uric acid, ↑(P&U)
[24]
Stathis, et al. P and U Inosine, ↑ (P)
Hypoxanthine, ↑ (P) greater in allopurinol vs. placebo same in (U) Xanthine, ↑ (U)greater in allopurinol vs. placebo
[25]
Subudhi, et al.
P α- and γ-tocopherol, ↓ over training camp [26]
Chevion, et al.
P Uric Acid, ↑
Ascorbic acid Dehydroascorbate
[27]
Ramel, et al. P α- and γ-tocopherol
β-carotene Lycopene Ascorbic Acid
Malondialdehyde, ↑ in Group1, 2 Linoleic acid
[28]
Kandar, et al.
P and E Allantoin, ↑(P&E)
Uric acid, ↑(P&E) Malondialdehyde,↑(E)
[29]
Gatti, et al. U Cortisol, ↑
Cortisone, ↑
Creatinine
[31]
Dovio, et al. U Total Cortisol
Cortisone
Tetrahydroderivatives
Unconjugated Cortisol and Cortisone
[tetra- hydrocortisol (THF) + alloTHF]/tetrahydrocortisone ratio, ↑
[32]
Giraldo, et al.
P Norepinephrine, ↑ post-exercise vs. pre in Group1, 2 and ↓ post 24 hours recovery in Group1, 2
Epinephrine, ↑ post-exercise vs. pre in Group2 and ↓ post 24 hours recovery in Group2
[33]
Degoutte, et al.
P Xanthine, ↑
Hypoxanthine, ↑
[36]
Gangemi, et al.
U Lipoxin
Tetraene
[37]
Sparling, et al.
P Anandamide, ↑ in runners and cyclists [38]
Dudzinska,
et al.
(Table 2) contd…
Study Sample Tested
(Plasma:P; Erythrocytes:E; Urine:U; Serum: S; Muscle Extract:ME; Saliva:Sa, Breath:B; Whole Blood:WB; Capil-lary Blood:CB)
Metabolite Pathways
(↓: reduced post- exercise, ↑: increased post-exercise)
Ref. No.
Lewis, et al. P Group 1 (pulmonary artery (PA) and superior vena cava (SVC))
steep instantaneous PA-to- SVC gradients at peak exercise:
Purine degradation products Span 2 TCA cycle intermediates
Differentially expressed:
Amino Acids (SVC & PA) Acetoacetate (SVC & PA) Glucose-6-phosphate (SVC & PA) Group 2 (P)
Lactate, ↑
Pyruvate, ↑
Glycerol, ↑
Alanine, ↑
Glucose-6-phosphate, ↑
Acetoacetate, ↓
Pantothenate, ↑ in more fit individuals Methionine,↑ in less fit individuals Glutamine,↑ in less fit individuals Group 3 (P)
Alanine, ↓
Threonine, ↓
Serine, ↓
Proline, ↓
Valine, ↓
Histidine, ↓
Glutamine, ↓
Asparagine, ↓
Glucose-6-phosphate, ↑
Glycerol, ↑
β-hydroxybutyrate, ↑
Allantoin, ↑
Kynurenate, ↑
Quinolinate, ↑
Anthranilate, ↑
Lactate, ↑
Pyruvate, ↑
[40]
Pohjanen, et al.
S 34 changing metabolites [not presented in paper by authors]
Glycerol and Asparagine confirmed only
[41]
Yan, et al. S Alanine, ↓ post 2wks training Group 2
Pyroglutamic acid, ↓ post 2wks training Group 1
β-D-methylglucopyranoside, ↑ post 2wks training Group 2 Valine, ↓ post 2wks training Group 2
Uric acid,↓ post 2wks training Group 2 Glutamine, ↓ post 2wks training Group 2 Glutamic acid, ↓ post 2wks training Group 2 Phenylalanine, ↓ post 2wks training Group 1 Tyrosine, ↓ post 2wks training Group 1 Threonic acid, ↑ post 2wks training Group 2 Ornithine,↓ post 2wks training Group 1
Study Sample Tested
(Plasma:P; Erythrocytes:E; Urine:U; Serum: S; Muscle Extract:ME; Saliva:Sa, Breath:B; Whole Blood:WB; Capil-lary Blood:CB)
Metabolite Pathways
(↓: reduced post- exercise, ↑: increased post-exercise)
Ref. No.
Pechlivanis,
et al.
U 2-Hydroxyisovalerate,↑
2-Hydroxybutyrate,↑
2-Oxoisocaproate,↑
3-Hydroxyisobutyrate,↑
3-Methyl-2-oxovalerate,↑
2-Oxoisovalerate,↑
Lactate,↑
Alanine,↑
Pyruvate,↑
Citrate, ↓
2-Oxoglutarate,↑
Trimethylamine N-oxide, ↓
Glycine,↓
Fumarate,↑
Tryptophan, ↓
Hypoxanthine,↑
Formate, ↓
Histidine
[43]
Pechlivanis,
et al.
S Elevated with training Group A:
1. Methylguanidine 2. Citrate 3. Glucose 4. Taurine
5. Trimethylamine N-oxide 6. Choline-containing compounds 7. Histidines
8. Acetoacetate/acetone
Elevated with training Group B:
1. Acetoacetate/acetone 2. Methylguanidine 3. Valine
4. Choline-containing compounds
Lactate and lipid metabolites lower post training in Group A > Group B
[44]
Mukherjee,
et al.
U
Information based on network analysis showing differentially expressed metabolites between experimental and control groups (by Metacore): Carbohydrate metabolism
1. TCA and tricarboxylic acid [t.] 2. Pyruvate metabolism [p.] 3. Propionate metabolism [p.] D-Glucuronic acid [p.]
Amino acid metabolism 1. L-Alanine [p.t.] 2. Glycine [p.t.] 3. L-Ornithine [p.t.]
4. Alanine, Glycine, Cysteine metabolism [t.]
5. Ala, Ser, Cys, Met, His, Pro, Gly, Glu, Gln metabolism [t.] Glycosphingolipid metabolism
(Table 2) contd….
Study Sample Tested
(Plasma:P; Erythrocytes:E; Urine:U; Serum: S; Muscle Extract:ME; Saliva:Sa, Breath:B; Whole Blood:WB; Capil-lary Blood:CB)
Metabolite Pathways
(↓: reduced post- exercise, ↑: increased post-exercise)
Ref. No.
Santone, et al.
Sa Urea
Glucose Lactate Citrate Acetate Glycerol Glutamate Leucine Alanine Lysine Ornithine Myo-inositol Glutamate Creatine Choline Tyrosine Glutamine Aspartate
[46]
Lustgarten,
et al.
S Metabolites positively associated with V 2max: Pyridoxate
2-oleoylglycerophosphoethanolamine 2-hydroxyisobutyrate
Erythrulose Tryptophan Leucylleucine Glycerate 4-ethylphenylsulfate Pantothenate 4-vinylphenol ulphate Erythronate N-acetylornithine
7α-hydroxy-3-oxo-4-cholestenoate
α-hydroxyisovalerate Ergothioneine Tryptophan betaine Phenyllactate Phenol ulphate Indolelactate
Metabolites negatively associated with V 2max: γ-tocopherol
5α-pregnan-3β,20α-diol disulfate Stearoyl sphingomyelin Pentadecanoate
[47] 02
14/02/2015 Mdl. User
03
Study Sample Tested
(Plasma:P; Erythrocytes:E; Urine:U; Serum: S; Muscle Extract:ME; Saliva:Sa, Breath:B; Whole Blood:WB; Capil-lary Blood:CB)
Metabolite Pathways
(↓: reduced post- exercise, ↑: increased post-exercise)
Ref. No.
Kujala, et al. S Lipoprotein
1. Particle concentration 2. Particle size Apolipoprotein Triglycerides Cholesterol Fatty acids
1. Omega-3 FA, ↑ in active persons Part1 2. Docosahexaenoic acid, ↑ in active persons Part1, 3 3. Omega-6 FA, ↓ in active persons Part3
4. Omega-7,9 and saturated FA, ↓ in active persons Part1, 3, 4 5. Monounsaturated FA, ↓ in active persons Part1, 3, 4 Metabolic substrates
1. Glucose, ↓ in active persons Part1, 2, 3
2. Acetoacetate, ↓ in active persons Part1 and ↑ Part 3 3. 3-hydroxybutyrate, ↓ in active persons Part1 and ↑ Part 4 4. Acetate, ↑ in active persons Part3
5. Citrate, ↑ in active persons Part2, 3, 4 6. Lactate, ↑ in active persons Part4 7. Pyruvate, ↓ in active persons Part3, 4
Amino Acids
1. Isoleucine, ↓ in active persons Part2, 3, 4 2. Valine,↓ in active persons Part1 3. Phenylalanine,↓ in active persons Part4 4. Tyrosine,↓ in active persons Part2, 4
Misc.
1.Creatinine, ↑ in active persons Part3, 4 2.Urea
3.Albumin
4.a1-acid-glycoprotein, ↓ in active persons Part1, 3, 4
[48]
Netzer, et al. CB (earlobe) Increased connectivity in relation to physical activity: 1.Lactate
2.Alanine
3.Acyl-carnitines (C2 and C3) Other relations:
1. Glycine
[49]
Lehmann, et al.
P and ME Hippurate, ↑ (P)
C6:0 carnitine, ↑ (P) C8:0 carnitine, ↑ (P) C10:1 carnitine, ↑ (P) C10:0 carnitine, ↑ (P) C14:2 carnitine, ↑ (P) C12:0 carnitine, ↑ (P) Norepinephrine, ↑ (P)
(Table 2) contd….
Study Sample Tested
(Plasma:P; Erythrocytes:E; Urine:U; Serum: S; Muscle Extract:ME; Saliva:Sa, Breath:B; Whole Blood:WB; Capil-lary Blood:CB)
Metabolite Pathways
(↓: reduced post- exercise, ↑: increased post-exercise)
Ref. No.
Enea, et al. U Lactate, ↑
Alanine, ↑
Acetate, ↑
Pyruvate, ↑
Succinate, ↑
Hypoxanthine, ↑
[51]
Neal, et al. U (first pass) Hippuric acid, ↓ post THR Creatinine, ↑ post THR Dimethylamine, ↑ post THR 3-methylxanthine, ↑ post THR Hypoxanthine, ↓ post THR
[52]
Peake, et al. P Succinic acid, ↑ HIIT
Aconitic acid, ↑ HIIT
4-methyl-2-oxopentanoic acid, ↑ HIIT 3-methyl-2-oxopentanoic, ↑ HIIT Alanine, ↑ HIIT
Glutamate, ↑ HIIT Tyrosine, ↑ HIIT Myristoleic acid, ↑ HIIT Oleic acid, ↑ HIIT Epinephrine, ↑ HIIT Linolenic acid, ↑ MOD Dodecanoic acid, ↑ HIIT & MOD Decanoic acid, ↑ HIIT & MOD Malonic acid, ↑ HIIT & MOD Palmi- toleic acid, ↑ HIIT & MOD Heptadecenoic acid, ↑ HIIT & MOD
[53]
Nieman, et al.
S Positive fold change across 75 metabolites: Lipid and carnitine metabolism
Amino acid and peptide metabolism Haemoglobin and porphyrin metabolism Krebs cycle intermediates
[54]
Nieman, et al.
P 80 Total Metabolites Across:
Lipid metabolism Carnitine metabolism Ketones
Dicarboxylate and long chain fatty acids 2. Linoleate, ↑
3. Linolenate, ↑ 4. Dihomo-linolenate, ↑ 5. Arachidonate, ↑ 6. Adrenate, ↑ 7. Docosapentaenoate, ↑
8. 13- and 9-hydroxy-octadecadienoic acid, ↑
9. (Z)-9,10-dihydroxyoctadec-12-enoic acid and (Z)-12,13-dihydroxyoctadec-9-enoic acid, ↑
Study Sample Tested
(Plasma:P; Erythrocytes:E; Urine:U; Serum: S; Muscle Extract:ME; Saliva:Sa, Breath:B; Whole Blood:WB; Capil-lary Blood:CB)
Metabolite Pathways
(↓: reduced post- exercise, ↑: increased post-exercise)
Ref. No.
Chorell, et al.
P Response to Exercise:
Hypoxanthine, ↑
Taurine, ↑
Ribose, ↑
Beta-D- methylglucopyranoside, ↑
Inositol, ↑
Citric acid, ↑
Beta-alanine, ↑
Malic acid, ↑
Tryptophan, ↓
Threonine, ↓
Threonate, ↓
Valine, ↓
Isoleucine,↓
[56]
Thysell, et al.
S Elevated post-exercise vs. pre:
1. Fatty acids 2. Alanine 3. Inosine
Decrease post-exercise vs. pre: 1. Asparagine
2. Lysine 3. Serine 4. Phenylalanine 5. Methionine 6. Arginine 7. Ornithine 8. Proline 9. Histidine 10. Allothreonine 11. Tryptophan 12. Valine 13. Isoleucine
[57]
Morris, et al. U (second void) and P Significant group and gender interaction (U) with fitness: Cystathionione
L-alanine Glycine Ethanolamine L-methionine L-aspartic acid Homocysteine Creatinine
↓ in high fitness group (P):
Branched chain amino acids (also in urine)
Leucine Isoleucine Valine
(Table 2) contd…
Study Sample Tested
(Plasma:P; Erythrocytes:E; Urine:U; Serum: S; Muscle Extract:ME; Saliva:Sa, Breath:B; Whole Blood:WB; Capil-lary Blood:CB)
Metabolite Pathways
(↓: reduced post- exercise, ↑: increased post-exercise)
Ref. No.
Sheedy, et al.
U (second void) Comparing baseline to 18 month exercise program (↑ post training):
1. Acetate
2. Choline
3. Dimethylamine
4. Guanidinooacetate
5. Hypoxanthine
6. Lactate
7. Malonate
8. Methylamine
9. Methylmalonate
10. N,N-dimethylglycine
11. Trigonelline
12. Trimethylamine
13. Tryptophan
Amino acid excretion
1. Isoleucine
2. Leucine
3. Lysine
4. Methionine
5. Tyrosine
Creatinine, ↓ in exercise group vs. control
[59]
Nieman, et al.
S 12,13-hydroxyoctadec-9(Z)- enoate, ↑ Group1,2
Cortisol, ↑ Group1,2 Hippurate, ↑ Group1
4-methylcatechol sulphate, ↑ Group1 4-hydroxyhippurate, ↑ Group1 Cinnamoylglycine, ↑ Group1 2-hydro- xyhippurate, ↑ Group1 3-hydroxyhippurate, ↑ Group1 Catechol sulphate, ↑ Group1 O-methylcatechol- ulphate, ↑ Group1 Arabinose, ↑ Group1
Caffeine, ↑ Group1
Study Sample Tested
(Plasma:P; Erythrocytes:E; Urine:U; Serum: S; Muscle Extract:ME; Saliva:Sa, Breath:B; Whole Blood:WB; Capil-lary Blood:CB)
Metabolite Pathways
(↓: reduced post- exercise, ↑: increased post-exercise)
Ref. No.
Nieman, et al.
S Dopamine, ↑ post- exercise in banana supplementation group Immediate response to exercise:
Palmitoleic Acid
2,3,4-Trihydroxybutanoic Acid Malic Acid
Succinic Acid Palmitic Acid Oleic Acid Heptadecanoic Acid D-Fructose
2-Hydroxybutyric Acid L-Isoleucine L-Glutamic Acid 2-Aminobutyric Acid L-Methionine Pyruvic Acid L-Proline
[61]
Chorell, et al.
S 3-methylhistidine, ↓ with low CHO + protein
Pseudouridine, ↑ with low CHO + protein 4-deoxyerythronic acid, ↑ with low CHO + protein Glycine, ↓ with low and high CHO
[62]
Abbreviations: [t.]: transport; [p.]: pathway(s); HGPRT: hypoxanthine-guanine phosphoribosyl-transferase; ADP: adenosine 5’ diphosphate; AMP: adenosine monophosphate; IMP: inosine monophosphate; ATP: adenosine 5’ triphosphate; THR: threshold training distribution.
Changes in purine metabolism were monitored in long-distance runners during their yearly training cycle (prepara-tory, competitive and transition phases). It was found as training progressed that the levels of post- exercise xanthine decreased and the levels of the salvage enzyme HGPRT in-creased [16]. Observing the effect of training load and struc-ture this time in middle-distance runners, it was proposed that plasma hypoxanthine concentration during and after exercise was affected by several factors including: the inten-sity of the exercise, the rate of reconversion of hypoxanthine to IMP by HGPRT, conversion of hypoxanthine to IMP by erythrocyte HGPRT, the rate of extraction by the liver and the rate of excretion. The main observation from the study was that training resulted in less excretion of hypoxanthine [17]. The same authors then compared high level sprinters and triathletes and found that hypoxanthine levels were lower in the trained sprinters in comparison with the triath-letes while HGPRT levels were higher in sprinters as com-pared to the triathletes [18]. This suggested a more effective use of anaerobic energy resources resulting from sprint train-ing than from triathlon traintrain-ing. Interesttrain-ingly, in a study comparing triathletes, sprinters, middle- and long-distance runners, low hypoxanthine levels post-exercise correlated with performance to a greater extent than lactate levels and aerobic capacity [19]. Finally, these differences in purine metabolism were observed in not only elite but in amateur and recreational runners over the similar 1 year training cy-cle. The lowest hypoxanthine levels and the highest HGPRT levels were observed in the elite runners, significant changes
in purine metabolism with time were only observed after using high-intensity exercise in their training schedules, there was no significant change following constant low in-tensity exercise [20].
Erythrocytes are unable to synthesise purine nucleotides
de novo. Measurement of adenine, guaninine nucleotides,
inosine and IMP in erythrocytes post-exercise showed that AMP, ADP and IMP were decreased at 30 minutes post-exercise supporting the idea that they are taken up by muscle and used to re-synthesise ATP. Hypoxanthine levels were high in red blood cells (RBC) immediately post-exercise but inosine levels were elevated at 30 minutes post-exercise in-dicating differences between the two metabolites in terms of rate of entry into blood [21-25].
STUDIES FOCUSED ON METABOLITES RELATING TO OXIDATIVE STRESS
Free radical production during exercise may be caused by a variety of mechanisms including a switch from xanthine dehydrogenase, which uses nicotinamide adenine nucleotide
(H+) as a cofactor, to xanthine oxidase, which uses oxygen as
a co-factor, and increased cyclooxygenase activity. Toco-pherols and ascorbic acid protect against oxidative stress as well as compounds produced by the body such as uric acid and glutathione along with protective enzymes [26-28].
stress tocopherols, glutathione (GSH), malondialdehyde (produced from lipid oxidation), lipid peroxides and uric acid were determined. Differences in these compounds pre- and post-training were small [26]. The effects of extreme exercise (monitored over a two week period as part of a 6 month training programme) were assessed with regard to the antioxidant capacity of plasma. The levels of ascorbic acid, total ascorbate, and dehydroascorbate were not changed by the exercise programme but uric acid levels were increased. There was a 10 fold increase in the level of creatine phos-phokinase into the plasma which is a direct indicator of exer-cise severity as well as a 4 fold increase in aspartate transa-minase, a characteristic marker of liver injury. Plasma pro-tein carbonyl content, a marker of propro-tein oxidative damage, decreased significantly during exercise [27]. The levels of anti-oxidants and lipid peroxidation products were measured before and after submaximal exercise in resistance trained
and non-resistance trained males. α-tocopherol, γ-tocopherol,
β-carotene, and lycopene (fat soluble antioxidants)
concen-trations increased after exercise. The concenconcen-trations of the lipid peroxidation products malondialdehyde and conjugated dienes were also elevated after exercise in both groups [28]. Plasma uric acid and allantoin as well as RBC malondialde-hyde were measured in individuals following a short 10 minute run. It was found that uric acid and allantoin were elevated by exercise but there was no effect on plasma malondialdehyde, however, RBC malondialdehyde was ele-vated indicating potential lipid peroxidation at the RBC membrane during a strenuous challenge such as exercise [29].
STUDIES FOCUSED ON STEROID METABOLISM
Hydrocortisone is responsible for maintaining homeosta-sis within the body when it adapts to stress [30] and thus in the short term its levels may become elevated as a result of stress and give an indication of the adaptive response to stress. Cortisone is an inactive form of cortisol present in tissues which may be activated by conversion into cortisol. The levels of cortisol and cortisone were assessed post-race in elite cyclists and were found to be significantly increased post-competition [31]. Exercise was found to increase the ratio of both tetrahydrocortisol to tetrahydrocortisone in urine, indicating increased generation of cortisol from corti-sone at the tissue level which may be part of the adaptive response to exercise [32].
In sedentary women cortisol levels decreased following both moderate and intense exercise and returned to normal 24 hours into recovery, thus the levels determined may de-pend on the duration of exercise as well as when the sample was taken [33]. In addition, in both moderate and intense exercise groups, norepinephrine levels in plasma were in-creased post-exercise whereas epinephrine levels were only increased by intense exercise. Estradiol levels were also shown to be elevated but only by intense exercise [33]. There has also been a long standing interest in levels of plasma androgens because of their influence on the anabolic response in muscle and bone post-exercise [34]. Androgens were observed to increase in response to exercise whereas cortisol only increased after exercise. Endurance-trained subjects showed less pronounced changes in hormone con-centrations in response to exercise than resistance- trained
subjects. It would seem that the endogenous steroid hormone profile of men depends more on exercise mode or intensity than exercise volume as measured by caloric expenditure [35].
Miscellaneous Targeted Studies
The effects of a judo match on levels of selected plasma metabolites were determined at 3 minutes, 60 minutes and 24 hours post-match [36]. The levels of glycerol, triglyc-erides and free fatty acids increased 3 minutes post-exercise although this might have been due to the subjects of the study having a low carbohydrate diet. Cholesterol levels were also elevated post-exercise. Serum creatinine levels rose post-exercise and this was attributed to a reduc-tion in glomerular filtrareduc-tion. There was a rise in ammonia post-exercise which might be attributed to the production of xanthine and hypoxanthine but could also be attributed to protein breakdown. It was noted that levels of uric acid were elevated but not until 60 minutes after the match. At 60 minutes post- exercise the levels of glycerol, triglyc-erides and free fatty acids had decreased but remained higher than the resting values. This suggested that lipolysis was participating in the re-synthesis of muscular glycogen stores. Apart from uric acid and urea, the levels of the re-maining markers had returned to baseline by 24 hours [36]. Furthermore, the effect of physical activity on urinary lipoxins (derived from eicosapentenoic acid) were meas-ured and found to be elevated after an average cycle of 13.3 minutes (± 2.8 min) where subjects reached their theoreti-cal individual heart rate maximum. These compounds are anti-inflammatory and lipoxin production may counterbal-ance inflammatory mediators produced by exercise [37]. The endogenous cannabinoids anandamide and 2-arachindonylglycerol were measured in plasma following exercise and there were marked elevations in these com-pounds in both runners and cyclists post-exercise (45 min cycle at 70- 80 % heart rate maximum) [38]. Finally, uridine levels in blood were measured after exercise and were found to correlate with increased levels of insulin and glucose in the blood. It was proposed that the increased levels of insulin post-exercise could be due to increased secretion of catecholamines. It was found that the insulin resistance of subjects was increased post-exercise (continu-ous effort and progressive cycle test) and it was suggested, on the basis of a number of previous studies, that uridine has a role in insulin resistance [39].
UNTARGETED OR SEMI-TARGETED ME-TABOLOMICS STUDIES
The study by Lewis et al. [40] is by far the most
com-prehensive in the literature and involved around 500 sub-jects, although 302 of the plasma samples were pre-existing and from the Framingham Heart Study. Plasma samples were either spot samples or several blood samples were taken over a short period of time using an in-dwelling catheter. It involved targeted mass spectrometry methods so that any metabolites outside the panel of 200 selected metabolites were not monitored. The metabolites which changed following exercise highlighted the molecular pathways that might modulate the beneficial effects of ex-ercise [40].
04
14/02/2015