Time-resolved spectra of a self-pulsing quantum dot laser
A. Tierno, N. Radwell, T. Ackemann
SUPA and Department of Physics, University of Strathclyde, Glasgow G4 ONG, Scotland, UK
A. Tierno, N. Radwell, T. Ackemann. “Time-resolved spectra of a self-pulsing quantum dot laser.” Semicon-ductor Lasers and Laser Dynamics IV, K. Panajotov, M. Sciamanna, A. A. Valle, R. Michalzik (editors). Proc. SPIE7720, 77202H, 2010.
Copyright 2010 Society of Photo-Optical Instrumentation Engineers. One print or electronic copy may be made for personal use only. Systematic reproduction and distribution, duplication of any material in this paper for a fee or for commercial purposes, or modification of the content of the paper are prohibited.
http://dx.doi.org/10.1117/12.863582
ABSTRACT
Self-sustained pulsations in the output of an InAs quantum dot laser diode in the MHz range are reported for the first time. The characteristics (shape, range and frequency) are presented for the free running laser and when optical feedback in the Littrow configuration is applied. The frequency resolved optical spectra reveal different envelope shifts between the two cases. This might be related to a change of phase-amplitude coupling across the gain maximum in agreement with the expectation for a two level system. The time scale and bifurcation scenario suggest that these are opto-thermal pulsation like those reported in quantum well amplifiers.1
Keywords: quantum dot laser, self-pulsing, opto-thermal pulsations.
1. INTRODUCTION
Quantum dots (QD) lasers and amplifiers are emerging as an attractive light source in the wavelength range between 1.2-1.3μm and it is important to assess their performance and stability (for a recent overview of the field see, e.g., the contributions in the special issues2 and3). One subject of interest are self-pulsing lasers where self-Q-switching due to saturable absorption was observed in many devices.4–7 Pulsations are in the GHz region as can be expected for passive Q-switching with the lifetime of the excited state in the nanosecond range. In VCSELs, self-pulsations observed were at a somewhat lower frequency but still in the several hundreds of MHz range and were related to saturable absorption in lateral unpumped regions of the device.8 Self-pulsations in edge-emitting QD lasers without an intentionally introduced absorber section were also observed and explained in terms of the inhomogeneous nature of the QD gain, the existence of several confined QD states and the resulting saturable absorption by energy states lower than the laser photon energy.9 Nevertheless, these oscillations are still in the GHz range.
We are reporting here on self-pulsations in QD edge-emitting lasers without a saturable absorber section taking place on the MHz scale. The oscillation frequency as well as the square-wave shape hint to a thermal origin of the dynamics. Indeed, opto-thermal pulsations with a very similar phenomenology were studied in quantum well amplifiers1, 10 and are typical for a variety of other nonlinear optical systems.11–14 It was shown in1 that the self-oscillations follow van der Pol-Fitzhugh-Nagumo dynamics,15, 16 a fairly general scenario of relaxation oscillations, which are characterized by the competition of very different time scales (in4, 10 for example carrier dynamics and thermal relaxation).
Interestingly, the self-pulsing dynamics are found to persist if frequency-selective feedback is applied. By the feedback, the operation frequency of the laser can be tuned above, below and around gain maximum and time-resolved optical spectra show characteristic differences, which are argued to give some indication of a difference in phase-amplitude coupling above and below the gain maximum.
2. DEVICES AND EXPERIMENTAL SETUP
The laser is an edge-emitting diode (QDL) from Innolume GmbH with a length of L = 3.5 mm. It contains InAs QD in a GaAs matrix. It is designed to be single spatial mode with a shallow edged waveguide and a stripe width ofw= 5μm. One facet of the QDL diode is AR coated while the other is HR coated. The laser is mounted on a C-mount and the temperature is controlled by a Peltier element. The temperature is kept fixed to 10◦C. The emission wavelength is then centered atλ= 1225 nm.
DG
QDL C
Temp. Cont.
Curr. Driver
L1
L2
L3
L4 L5
OI
OSA
PD
SFP
PD
M
M
M
M
M BS
[image:2.612.180.434.114.293.2]BS
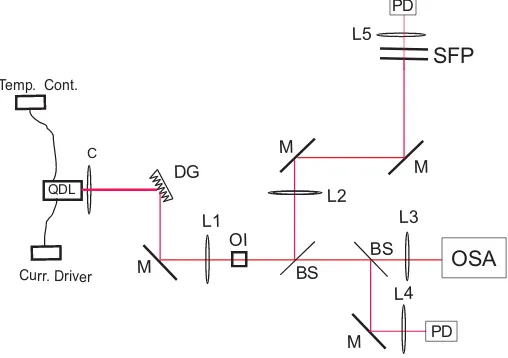
Figure 1. Experimental setup: quantum dot laser (QDL), aspheric collimator (C) (f = 3.1 mm), diffraction grating (DG), mirror (M) , L1 (f = 100 mm), optical isolator (OI), beam splitter (BS), L2 (f = 250 mm), scanning Fabry Perot interferometer (SFP), L3 (f = 35 mm), L4 (f = 50 mm), L5 (f = 50 mm), optical spectrum analyzer (OSA), photo diode (PD).
The experimental setup is illustrated in Fig. 1. The emission in the fast axis is nearly collimated using a spherical lens (C) of 3.1 mm focal length and numerical aperture NA = 0.68. Feedback is provided in a Littrow scheme with a diffraction grating with 1450 lines/mm arranged at an angle Θ = 75◦with respect to the incoming beam. The collimator is positioned in a way to optimize threshold reduction by focusing on the grating (external cavity length 123 mm). After the external cavity, there are two lenses L1, L2 for beam shaping and an optical isolator (OI) to prevent feedback from the detection part. Two InGaAs fast detector (Thorlabs PDA255) with an active area of 1 mm and bandwidth of 50 MHz are used to monitor the dynamics of the total intensity and the spectrally resolved intensity after the scanning Fabry-Perot interferometer (SFP). The optical spectrum is also monitored by a commercial fiber coupled optical spectrum analyzer (Agilent 86140) with a nominal resolution of 0.07 nm. The plane-plane scanning Fabry-Perot interferometer (SFP) has a free spectral range of 1.95 nm (390 GHz) and a finesse of about 500-600. For the characterization of the free running laser we simply replace the grating by a high reflectivity mirror.
The threshold current of the free running laser is I = 760 mA. With feedback at the same wavelength (λ= 1225, gain peak) it is reduced to I = 550 mA, a threshold reduction by 33%.
3. PHENOMENOLOGY OF SELF-PULSING
3.1 Experimental results
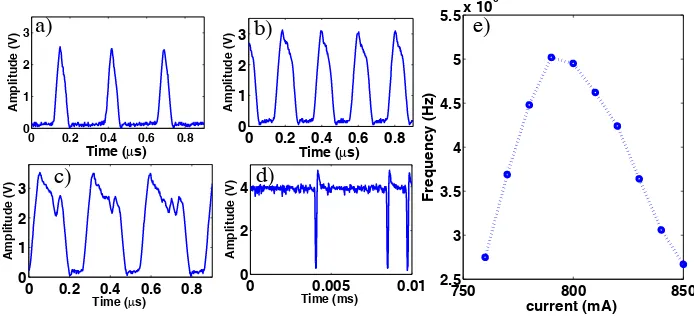
dominates until the pulses are better described as short drop-outs from a high-amplitude state (Fig. 2(d)). The pulsations disappear after I = 850 mA (Fig. 2(d)) and the laser emission is stable afterwards. It is evident from the figures that there is some variation in pulse duration (e.g. Fig. 2(c), (d)), i.e. there is a jitter in the width of the pulse present at all drive currents. Fig. 2(e) gives a quantitative account of the frequency of this pulsations
0 0.2 0.4 0.6 0.8 0 1 2 3 Time (μs) Amplitude (V)
0 0.2 0.4 0.6 0.8 0 1 2 3 Time (μs) Amplitude (V)
0 0.2 0.4 0.6 0.8 0
1 2 3
Time (μs)
Amplitude (V)
0 0.005 0.01
0 2 4
Time (ms)
Amplitude (V)
750 800 850
2.5 3 3.5 4 4.5 5 5.5x 10
[image:3.612.143.490.94.258.2]6 current (mA) Frequency (Hz)
b)
a)
d)
c)
e)
Figure 2. Behavior of the oscillation for the free running laser for increasing current: (a) threshold 760 mA, (b) 790 mA, (c) 830 mA, (d) 850 mA. (e) Frequency behavior of the free running laser for increasing current.
vs. drive current. The frequency of the pulsation starting at a current of 760 mA is about 2.75 MHz, reaches a maximum of 5.1 MHz for 790 mA, and then decreases again to 2.74 MHz at 850 mA.
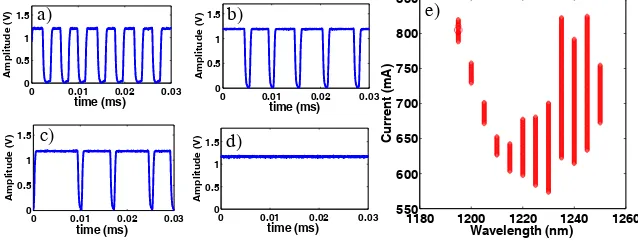
The laser with feedback also shows oscillations as evidenced in Fig. 3. In this case the oscillations are more of a square-shape type. They appear at frequencies somewhat lower than the one in the free running laser and are centered around 1 MHz. Figs. 3(a)-(d) illustrate the development of pulsing in dependence of power. It is taken for lower emission wavelengths (λ= 1195 nm) than the gain maximum but the qualitative behavior does not depend on wavelength and is quite the same as in the free-running laser: Short pulses from an off-state (not shown) evolve towards a 50% duty cycle (Fig. 3(a)). Then the on-phases become longer (Figs. 3(b) and (c)) until the laser is stable at high currents (Fig. 3(d))
Fig. 3(e) shows the range of the oscillation for different wavelengths available by tuning the diffraction grating from 1195 nm to 1250 nm. Between 1195 nm and 1220 nm the range where the oscillation are present is quite small, around 40 mA, then it increases to around 100 mA around the central wavelength to increase again up to 200 mA for some higher wavelength. This range is for both polarizations of the diode. The shape of the pulsation became less square-wave like for increasing wavelength (not shown in the picture).
Increasing the temperature results in the frequency of the oscillations becoming lower and the oscillation appear at higher current due to the shifting of the threshold of the laser with temperature.
3.2 Discussion
0 0.01 0.02 0.03 0
0.5 1 1.5
Amplitude (V)
time (ms) 0 0.01 0.02 0.03
0 0.5 1 1.5
Amplitude (V)
time (ms)
0 0.01 0.02 0.03 0
0.5 1 1.5
Amplitude (V)
time (ms) 0 0.01 0.02 0.03
0 0.5 1 1.5
Amplitude (V)
time (ms) 1180 1200 1220 1240 1260
550 600 650 700 750 800 850
Wavelength (nm)
Current (mA)
e) a)
c) d)
[image:4.612.147.466.39.165.2]b)
Figure 3. Evolution of oscillation for increasing current at: (a)λ= 1195 nm 790 mA (b) 810 mA (c) 820 mA and (d) 830
mA (e) Oscillation range in dependence of wavelength.
then amplification sets in, the slave cools due to the reduction in carrier density due to stimulated emission, its resonance shifts and interaction is lost. Then the carrier density is high again and the laser heats until it is in resonance again and a new pulse can start. The different time scales of thermal heating/cooling and stimulated emission/carrier injection lead then to relaxation oscillation-like pulsations. The same might happen in an experiment with frequency-selective feedback into a single-longitudinal mode vertical-cavity surface-emitting laser (VCSEL) where the role of the injection frequency is played by the center frequency of the grating.17
The difference between our case and the previous cited literature is the fact that in our case these oscillations appear also in the free running lasers. This indicates that the laser itself provides a mechanism able to generate oscillations in the MHz range. Current investigations address differences between the dynamics in device center and beam wings, which might indicate thermal lensing or waveguiding in maintaining the pulsations. This, and the fact that one is interested in a direct proof for a transient temperature shift during the pulse motivates an investigation of the optical spectra, especially time-resolved ones.
4. TIME-RESOLVED SPECTRA
4.1 Experimental results
Fig. 4 shows standard time-averaged spectra (i.e. the sweeping time of the SFP is much longer than the time scale of pulsations) around the gain peak (λ= 1220 nm) for two cases, both with feedback, when the laser is not oscillating, upper part (a), and when the laser exhibits oscillations, lower one (b). In both cases, the laser is strongly multi-mode covering about 1.5 nm. The modal envelope is increasing from lower to higher wavelengths. The line width of an individual longitudinal mode is about 0.6 GHz for stable emission. Instead, when pulsating the average linewidth is larger (Fig. 4b), about 5.6 GHz, which might be due to modes jittering.
Following,18 we then record the time-resolved spectrum for all frequencies inside a free spectral range and superimpose the data recorded for every frequency. This is done by scanning the piezoelectric translators of the SFP by a computer controlled voltage slowly (stepwise) while we record with a fast detector the signal transmitted by the SFP. The diode drive current is kept fixed during the experiment. To maintain a stable signal on the scope we trigger on the pulse read out by the other fast detector. In our case 0.47 V correspond to a free spectral range of 1.95 nm. The scan covers 0.8 V with a resolution of 1 mV steps leading to almost two FSR with a nominal wavelength resolution of 0.0041 nm.
3.5 4 4.5 5 5.5 6 6.5 7 7.5 8 0
0.1 0.2 0.3 0.4 0.5
Wavelength (nm)
Voltage (V)
3.5 4 4.5 5 5.5 6 6.5 7 7.5 8
0 0.1 0.2 0.3 0.4 0.5
Wavelength (nm)
Voltage (V)
[image:5.612.120.493.36.231.2]b)
a)
Figure 4. Time-averaged spectra for two relevant currents: (a) laser stable at I = 584 mA, (b) laser oscillating at I=548 mA. The wavelength scale is only relative, the free spectral range of the analyzing SFP is 1.95 nm, i.e. the repetition of modes is a detection artefact.
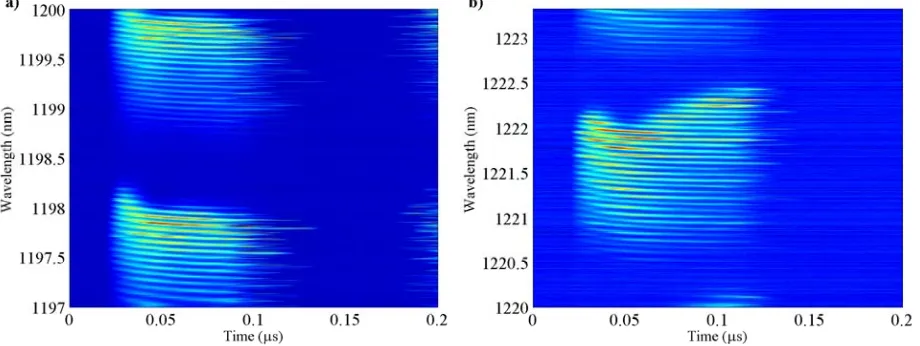
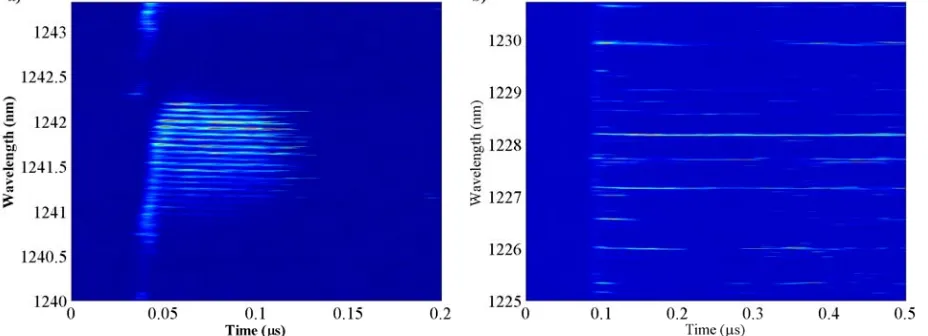
Figure 5. Time-resolved spectrum for (a)λ= 1197 nm, I = 724 mA, (b)λ= 1220 nm, I = 548 mA.
cooling. This would fit the interpretation in the amplifier systems19where it wasn’t demonstrated experimentally explicitly though. In addition, the envelope of lasing also blue-shifts with the most reddish modes dying first.
Fig. 5(b) is for λ= 1220 nm, around the gain peak, at I = 548 mA. Again the envelope blue-shifts in the initial phase but then swings back towards the red. Within each cavity mode there is a blue-shift of 0.11 nm.
Fig. 6(a) is forλ= 1240 nm at I = 600 mA. In this case, the lasing starts at low wavelengths and then the envelope red-shifts. Within each cavity mode there is a blue-shift of 0.06 nm.
[image:5.612.65.525.292.465.2]Figure 6. Time resolved spectrum for (a)λ= 1240 nm at I = 600 mA, (b) free running laser,λ= 1225 nm, I = 831 mA. In b) the FSR of the analyzing SFp was increased to 5.7 nm
4.2 Discussion
Switching between longitudinal modes was discussed in20–23 for quantum well lasers and in24 for quantum dot lasers. An important conclusion was that longitudinal mode switching is not a merely stochastic process but follows a quite deterministic switching sequence influenced by nonlinearities. A preference for a switching sequence from blue to red modes was related to the breaking of the symmetry of four-wave mixing processes by a nonzero alpha-factor. The alpha-factor or linewidth-enhancement factor describes phase-amplitude coupling in semiconductors and is positive for quantum well samples.25 It is related to the fact that the gain spectrum (imaginary part of susceptibility) of quantum wells is asymmetric and as a consequence its Hilbert transform giving the real part (refractive index) contribution is not zero at gain maximum. A positiveα−factorwas found to be consistent with the blue-to-red switching sequence observed.21, 23 The 3D quantum confinement of ideal QD should lead to a ‘quasi-atomic’ behavior with a delta function-like density of states. A symmetric asymmetric gain spectrum should have zero phase-amplitude coupling or linewidth enhancement factor at gain maximum, positive for lower frequencies and negative for higher frequencies. The different shift of the longitudinal modes during the pulses observed is in qualitative agreement with this expectation: On gain maximum, the free-running as well as the laser with feedback do not show much of a shift consistent with a zero or small alpha-factor. The detuned emission under frequency-selective feedback shows the same tendency as the quantum well devices for lower frequencies (positive alpha-factor) and the opposite for higher frequencies (negative alpha-factor). The size and sign of the alpha-factor is very important for feedback and filamentation instabilities. Indeed, a reduced (or even negative)α-factor and a reduced tendency to beam filamentation was observed in many QD samples, at least under some operating conditions.26–31 The real susceptibility of QD are more complicated than the one of a two-level atom due to contributions from the wetting layer, higher QD states and inhomogeneous broadening (e.g.32), though the possibility of a negativeα−factor under gain conditions can survive. The current observation of a qualitative agreement with the two-level expectation seems to be interesting though it should be cautioned that the argument is quite indirect.
Finally, the fact that each longitudinal mode blue-shifts at the beginning of the pulse hints to a detuning-independent effect like a temperature shift. Indeed, it is consistent with radiative cooling, which might trigger the thermal relaxation oscillations.
5. CONCLUSION
behavior except in frequency-resolved optical spectra. Here the different shift of the envelope might be related to a change of phase-amplitude coupling across the gain maximum in qualitative agreement with the expectation for a general two level system. The time scale and the bifurcation scenario suggest that these are opto-thermal pulsations like the ones reported in quantum well amplifiers1but there is no obvious mechanism of a competition between resonance conditions. Instead, we are currently investigating the hypothesis of a dynamical change of thermal waveguiding properties.
Acknowledgements
This work was supported by EPSRC project EP/E025021. We are grateful for useful discussions with Daniil Livshits from Innolume GmbH.
REFERENCES
[1] Barland, S., Piro, O., Giudici, M., Tredicce, J. R., and Balle, S., “Experimental evidence of van der Pol -Fitzhugh -Nagumo dynamics in semiconductor optical amplifiers,”Phys. Rev. E68, 036209 (2003). [2] Bhattacharya, P., Bimberg, D., and Arakawa, Y., “Special issue on optoelectronic devices based on quantum
dots,”Proc. IEEE 95, 1718–1722 (2007).
[3] Sugawara, M. and Usami, M., “Quantum dot devices: Handling the heat,”Nature Phot.3, 30–32 (2009). [4] Qasaimeh, O., Zhou, W.-D., Phillips, J., Krishna, S., Bhattacharyaa, P., and Dutta, M., “Bistability and
self-pulsation in quantum-dot lasers with intracavity quantum-dot saturable absorbers,”Appl.Phys. Lett.74, 1654–1657 (1999).
[5] Summers, H. D., Matthews, D. R., Smowton, P. M., Rees, P., and Hopkinson, M., “Laser dynamics in self-pulsating quantum dot systems,”J. Appl. Phys.95, 1036–1042 (2004).
[6] Viktorov, E. A., Cataluna, M. A., OFaolain, L., Krauss, T. F., Sibbett, W., Rafailov, E. U., and Mandela, P., “Dynamics of a two-state quantum dot laser with saturable absorber,” Appl. Phys. Lett. 90, 121113 (2007).
[7] Liu, H., Smowton, P., Summers, H., Edwards, G., and Drexler, W., “Self-pulsing 1050 nm quantum dot edge emitting laser diodes,” Appl. Phys. Lett.95, 101111 (2009).
[8] Kuzmenkov, A. G., Ustinov, V. M., Sokolovskii, G. S., Maleev, N. A., Blokhin, S. A., Deryagin, A. G., Chumak, S. V., Shulenkov, A. S., Mikhrin, S. S., Kovsh, A. R., McRobbie, A. D., Sibbett, W., Cataluna, M. A., and Rafailov, E. U., “Self-sustained pulsation in the oxide-confined vertical-cavity surface-emitting lasers based on submonolayer InGaAs quantum dots,”Appl. Phys. Lett.91, 121106 (2007).
[9] Mokkapati, S., Tan, H. H., Jagadish, C., and Buda, M., “Self-sustained output power pulsations in InGaAs quantum dot ridge-waveguide lasers,”Appl. Phys. Lett.92, 021104 (2008).
[10] Marino, F., Catal´an, G., S´anchez, P., Balle, S., and Piro, O., “Thermo-optical canard orbits and excitable limit cycles,”Phys. Rev. Lett.92, 073901 (2004).
[11] Wegener, M. and Klingshirn, C., “Self-oscillations of an induced absorber (CdS) in a hybrid ring resonator,”
Phys. Rev. A35, 1740–1752 (1987).
[12] Rzhanov, Y. A., Richardson, H., Hagberg, A. A., and Moloney, J. V., “Spatiotemporal oscillations in a semiconductor etalon,” Phys. Rev. A47, 1480–1491 (1993).
[13] Lu, W., Yu, D., and Harrison, R. G., “Excitibility in a nonlinear optical cavity,” Phys. Rev. A58, R809– R811 (1998).
[14] Suret, P., Derozier, D., Lefranc, M., Zemmouri, J., and Bielawski, S., “Self-pulsing instabilities in an optical parametric oscillator: Experimental observation and modeling of the mechanism,”Phys. Rev. A61, 021805(R) (2000).
[15] FitzHugh, R., “Impulses and physiological states in theoretical models of nerve membrane,”Biophys. J.1, 445–466 (1961).
[16] Nagumo, J. S., Arimoto, S., and Yoshizawa, S., “An active pulse transmission line simulating nerve axon,”
Proc. IRE50, 2061–2070 (1962).
[18] Huyet, G., Balle, S., Giudici, M., Green, C., Giacomelli, G., and Tredicce, J. R., “Low frequency fluctuations and multimode operation of a semiconductor laser with optical feedback,” Opt. Commun. 149, 341–347 (1998).
[19] Barland, S., Tredicce, J. R., Brambilla, M., Lugiato, L. A., Balle, S., Giudici, M., Maggipinto, T., Spinelli, L., Tissoni, G., Kn¨odel, T., Miller, M., and J¨ager, R., “Cavity solitons as pixels in semiconductors,”Nature419, 699–702 (2002).
[20] Ahmed, M. and Yamada, M., “Influence of instantaneous mode competition on the dynamics of semicon-ductor lasers,”IEEE J. Quantum Electron.38(6), 682–693 (2002).
[21] Yamada, M., Ishimori, W., Sakaguchi, H., and Ahmed, M., “Time-dependent measurement of the mode-competition phenomena among longitudinal modes in long-wavelength lasers,” IEEE J. Quantum
Elec-tron.39, 1548–1555 (2003).
[22] Furfaro, L., Pedaci, F., Giudici, M., Hachair, X., Tredicce, J., and Balle, S., “Mode-switching in semicon-ductor lasers,”IEEE J. Quantum Electron.40, 1365 (2004).
[23] Yacomotti, A. M., Furfaro, L., Hachair, X., Pedaci, F., Giudici, M., Tredicce, J. R., Javaloyes, J., Balle, S., Viktorov, E. A., and Mandel, P., “Dynamics of multimode semiconductor lasers,”Phys. Rev. A 69, 053816 (2004).
[24] Tanguy, Y., Houlihan, J., Huyet, G., Viktorov, E. A., and Mandel, P., “Synchronization and clustering in a multimode quantum dot laser,”Phys. Rev. Lett.96, 053902 (2006).
[25] Henry, C. H., “Theory of the linewidth of semiconductor lasers,”IEEE J. Quantum Electron.18, 259–264 (1982).
[26] Bimberg, D. and Ledentsov, N. N., “Quantum dots: lasers and amplifiers,”J. Phys.: Condens. Matter15, R1063–R1076 (2003).
[27] Smowton, P. M., Pearce, E. J., Schneider, H. C., Chow, W. W., and Hopkinson, M., “Filamentation and linewidth enhancement factor in InGaAs quantum dot lasers,”Appl. Phys. Lett.81, 3251–3253 (2002). [28] Xu, Z., Birkedal, D., Juhl, M., and Hvam, J. M., “Submonolayer InGaAs/GaAs quantum-dot lasers with
high modal gain and zero-linewidth enhancement factor,”Appl. Phys. Lett.85, 3259–3261 (2004).
[29] Ribbat, C., Selin, R. L., Kaiander, I., Hopfer, F., Ledentsov, N. N., Bimberg, D., Kovsh, A. R., Ustinov, V. M., Zhukov, A. E., and Maximov, M. V., “Complete suppression of filamentation and superior beam quality in quantum-dot lasers,”Appl. Phys. Lett.82, 952–954 (2003).
[30] Schneider, S., Borri, P., Langbein, W., Woggon, U., Sellin, R. L., Ouyang, D., and Bimberg, D., “Linewidth Enhancement Factor in InGaAs Quantum-Dot Amplifiers,” IEEE J. Quantum Electron. 40, 1423–1429 (2004).
[31] Hegarty, S. P., Corbett, B., McInerney, J. G., and Huyet, G., “Free-carrier effect on index change in 1.3μm quantum-dot lasers,”Electron. Lett. 41, 416–418 (2005).