coating using pulsed DC CFUBMS
P. Mandal*
1, B. D. Beake
2and S. Paul
3This paper aims to investigate the parametric effect of deposition and target frequency on the
mechanical properties and machining performance of the TiAlN coatings deposited in a dual
cathode pulsed dc CFUBMS system. Coating composition is not directly dependent on
deposition temperature or target frequency individually but increase in both the parameters
has led to Al rich coating. The coating thickness is influenced by target frequency only. The
fatigue fracture resistance of the TiAlN coating has been evaluated by the nanoimpact test and it
has been found to be at least as good as commercial Ti
0?5Al
0?5N coating deposited on cemented
carbide. In dry machining SAE 1037 steel, it has been observed that the resistance to crater wear
is influenced by target frequency. Simultaneous increase in the deposition temperature and target
frequency has provided improved resistance to crater wear due to their favourable influence on
the coating thickness and Al percentage.
Keywords:TiAlN, CFUBMS, Pulsed DC, Coating, Machining
Introduction
<
PVD coated tools are preferred to CVD coated tools dueto lower deposition temperature, better compositional control of coating and minimisation of the thermal residual stress. The deposition of PVD TiN coatings on cutting tools has been widely used since the mid 1970s as it provides benefit in terms of machining performance as
well as tool life in comparison with uncoated tools.1
However, in actual machining, as the cutting speed increases the temperature at tool workpiece interface is so high (.700uC) that TiN layer gets oxidised (at 550uC)
and forms a poor adherent and brittle TiO2layer on the
top of TiN layer. Therefore, compressive stresses are developed in the oxide layers and spallation takes place. As a result, protecting ability of the TiN coating is lost
as has been reported by Munz.2 Since the mid 1980s,
TiAlN coatings had been successfully developed as a promising alternative to TiN coated cutting and forming
tools. Munz2developed TiAlN coating using sputter ion
plating process and reported the performance of TiAlN coated drills to be two times better than that of TiN coated ones. He also reported the advantages of TiAlN coated tools such as improved resistance to oxidation
(oxidation occurs at 800uC), high hardness, high
corrosion resistance and lower thermal conductivity. TiAlN coatings have been successfully deposited by different PVD processes like ion plating, cathodic arc deposition as well as closed field unbalanced magnetron
sputtering (CFUBMS) and recently pulsed DC
CFUBMS. The use of pulsed DC CFUBMS successfully
addresses the issues of low deposition rate and target
poisoning observed by Kelly et al.3 The effect of
different deposition parameters on mechanical and tribological properties of TiAlN coating deposited by DC-CFUBMS had been thoroughly investigated. Kim et al.4 have studied the effect of N2partial pressure on
deposition rate and hardness of TiAlN coating and
found that low N2 partial pressure resulted in high
deposition rate but low hardness.
Some studies have also been reported on character-isation of TiAlN film deposited via pulsed DC
CFUBMS. Shumet al.5discussed the effect of Al target
current on deposition rate, film thickness, film structure, hardness, adhesive strength, and friction coefficient. They reported that the deposition rate, film thickness,
hardness and friction coefficient (0?55–0?65) increased
with increase in Al target current (027 A) while scratch
adhesion (around 90 N) remained more or less same and
columnar film structure was obtained. Astrand et al.6
discussed the effect of N2partial pressure on growth rate
of film and they observed that highest growth rate
(23 nm min21) was obtained for lowest N2 partial
pressure (0?375 mtorr/0?05 Pa). Zywitzki et al.7
show-ed the effect of substrate bias voltage on hardness, residual stress, film structure, and elastic modulus. They observed that with increase in negative substrate bias
voltage (0280 V), microstructure became denser, and
hardness, residual stress and elastic modulus increased proportionally. Barshiliaet al.8also studied the effect of substrate bias voltage on hardness and ion current. The hardness and ion current both increased with increase in bias voltage (230 to275 V) and after that no significant improvement was noted.
Although the influence of some of the deposition
parameters (Al target current, partial pressure of N2and
Department of Mechanical Engineering, Indian Institute of Technology, Kharagpur, Kharagpur, West Bengal 721 302, India
*Corresponding author, email [email protected]
substrate bias voltage) on coating properties has been well established a full parametric study has yet to be undertaken. The effect of deposition temperature, target frequency, bias frequency on the properties of TiAlN coatings deposited via pulsed DC CFUBMS has not been reported and importantly, their influence on machining performance has also not been addressed. Moreover, deposition of TiAlN is undertaken by several researchers with alloyed targets.4,9–12Alloyed targets are costly and once an alloyed target is chosen, the chemistry of the coating (Ti/Al ratio) cannot be altered. Therefore, in the present study, pure Ti and Al targets have been used that directly affects economics of coating. The objective of this paper is to investigate the parametric effect of deposition temperature and target frequency on mechanical properties as well as machining performance of the TiAlN coating deposited using pure targets in dry turning of SAE 1037 steel.
Experimental
Deposition
TiAlN coatings were deposited in a dual cathode pulsed DC closed field unbalanced magnetron system (VTC – 01A, manufactured by Milman Thin Film systems Pvt. Ltd, India). Ti and Al targets with purity better than
99?99% and dimensions of 2546127 mm and thickness
of 12 mm were used during the deposition. Coatings were deposited on three different types of substrates
namely HSS block of M2 grade (10610620 mm), low
carbon steel (SAE 1010) disc shaped coupons (w
25610 mm) and uncoated tungsten carbide inserts of
grade K10 (94%WCz6%Co) and nominal geometry of
SNMA 120408. Before deposition, all substrates except the inserts were polished to a roughness ofRa50?05mm
and ultrasonically cleaned using acetone, isopropyl alcohol and trichloroethylene. Before transferring the samples to the deposition chambers, they were dried using hot air. The substrate stage had a two-fold
rota-tion facility and rotated at 4 rev min21 during
deposi-tion. Bipolar pulsed DC power supplies (advanced energy pinnacle plus) were used. Cathodes were ener-gised in current mode and the substrate was enerener-gised in
voltage mode. A base pressure of better than 261023Pa
was achieved before initiating deposition, which was very similar to the base pressure reported by Musil and
Hruby9and Zhouet al.13The deposition cycle consisted
of sputter cleaning of the targets with shutters in closed position, followed by ion etching. Ion etching was
conducted for 15 min at a bias voltage of2500 V with a
pulsed frequency of 250 kHz at Ar pressure of 0?16 Pa
with titanium target current set to 1 A. Then, a titanium interlayer of around 200 nm thickness was deposited which was followed by TiN interlayer. The relevant deposition conditions for all the coatings are sum-marised in Table 1.
Characterisation tests
The surface morphology and fractography of the coated HSS samples were observed under a scanning electron microscope (Carl Zeiss EVO 60) fitted with an EDX analyser (INCA FET 3X). The surface roughness of the coated samples was measured on coated HSS samples at ten different locations using contact type surface
profilometer (Taylor – Hobson Surtronic 3z) with a
cutoff length of 0?8 mm. The composite Vickers
micro-hardness of the coating was also measured on coated HSS samples using a load of 1 N with a dwell time of 15 s in a LECO LM-700 microhardness measurement system. For each coated HSS sample, ten measurements were undertaken and their average has been reported.
Sample no. S6, deposited on HSS, was selected for further nanomechanical characterisation. A NanoTest system (Micro Materials Ltd, Wrexham, UK) was used for nanoindentation and nanoimpact testing. In the nanoindentation tests, a Berkovich indenter was used. Two types of test were performed: first, 40 repeat conventional load–unload tests to a peak load of 25 mN and second, load–partial unload multicycle indentation to 100 mN maximum load for depth profiling of hardness and modulus. For the nanoimpact testing, a solenoid connected to a timed relay was used to produce the repetitive probe impacts on the surface. A cube corner diamond indenter test probe was accelerated
from a distance of 15mm from the surface to produce
each impact at applied loads of 25, 50 and 100 mN for rapid fracture. Five repeat tests were performed for 25 mN load and three repeat tests were performed for 50 and 100 mN loads at different locations on the sample. The adhesion of the coatings to the substrate was measured by TR-101 M5 DUCOM Scratch Tester with
a Rockwell C diamond indenter of tip radius 0?2 mm.
All the above tests were performed on coated HSS M2 samples. The indenter was drawn across the coating
at a speed of 6 mm min21 over a scratch length of
[image:2.595.58.534.614.769.2]15 mm. The normal load during scratching was varied from 10 to 120 N. During scratching, the tangential force was continuously monitored. The scratch adhesion
Table 1 Deposition conditions for TiAlN coatings
Sample no.
Deposition conditions
Variable parameters
Fixed parameters Deposition
temperature/uC
Target frequency/kHz
N2flowrate/
sccm PAr/Pa PN2/Pa
S2 270 100 12 0.16 0.04 Ar flowrate: 15 sccm;
Ti target current: 3 A; Al target current: 4 A; substrate bias voltage:
250 V; duty cycle: 80%
S3 300 100 12 0.16 0.04
S4 350 100 12 0.16 0.04
S5 250 250 10 0.20 0.07
S6 300 250 10 0.20 0.07
S7 350 250 10 0.20 0.07
S8 300 200 10 0.20 0.07
is quantified by the normal load at which the coating fails (critical load or LC). In the present work, the critical load has been determined by the sudden increase in the ratio of the tangential or traction force to the normal force during scratching. This typically coincides
with LC3 type of failure, which indicates initiation of
removal of the coating as described by Heet al.14
To study the tribological performance of the coatings ball-on-disc tests were performed with a tribometer (TR-201 M3 DUCOM). The tests were undertaken on disc shaped low carbon steel coupons at a normal load 10 N using 5 mm diameter cemented carbide balls (94%WC
and 6%Co) with a sliding speed of 200 mm s21 under
ambient conditions (25uC and 50% relative humidity).
The normal and tangential forces were continuously monitored during the test enabling the coefficient of friction to be determined from Amontons law. The depth of the wear track was measured at five different locations using a contact type surface profilometer
(Taylor Hobson Surtronic 3z).
Machining test: turning of medium carbon steel
The machining performance of the TiAlN coated tungsten carbide inserts was evaluated by dry turning of medium carbon steel (SAE 1037) bars at a cutting speed of 160 m min21, feed of 0
?2 mm rev21and a depth of cut
of 2 mm. The cutting tool had an inclination angle of
26u, an orthogonal rake angle of26uand a nose radius
of 0?8 mm. Machining was interrupted at regular
inter-vals and the rake and flank faces of the cutting tool were inspected under a stereo zoom microscope (Olympus model SZ 1145TR PT zoom stereo microscope) fitted with a digital photo micrograph system (Olympus C-5060 wide zoom). The cutting tools were ultrasonically cleaned in acidic solution before such inspection to remove any work material built-up on the rake face. The average and the maximum flank wears were determined from the photo micrographs. Cutting forces were monitored dur-ing machindur-ing by employdur-ing piezoelectric dynamometer (Kistler Instruments AG, Switzerland; type: 9257B) with matching charge amplifier (model: 5015A1000) to deter-mine the apparent coefficient of friction at the chip tool interface during machining.
Results and discussion
Coating composition, microstructure, thickness
and surface roughness
The chemical composition of as deposited TiAlN coatings obtained by bulk EDX analysis is shown in Table 2. The atomic percentage of Ti/Al is close to 1 : 1 for these
coatings. For some coatings, the Al percentage was slightly greater (to 57%), so they could be considered as
Al rich AlTiNxcoatings. Sample S2–S4 are some of the
thinnest samples having highest Fe percentage. Fe is detected in the analysis due to low coating thickness of the samples. It seems that variations in individual parameters, such as deposition temperature and target frequency, have almost no effect on chemical composition of the deposited coating. Increasing target frequency and temperature simultaneously (for samples S7, S8 and S9)
produced Al rich AlTiNxcoatings.
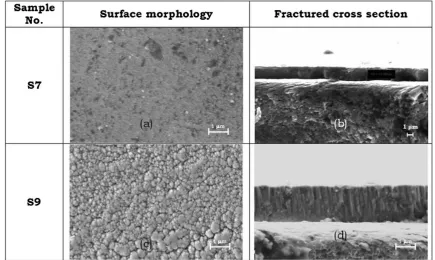
The surface morphology and the fractograph of two selected coatings (S7 and S9) are shown in Fig. 1. All the coatings show compact coating structure with submicro-metre agglomerated grain size as observed under SEM
(Fig. 1aandcfor S7 and S9 respectively). Some samples
such as S8 and S9 (Fig. 1dfor S9) show very compact
bottom layer structure followed by dense columnar top layer. The thickness of all the coatings was in the range of
1?2–2?2mm (e.g. S9 is y2?06mm thick as shown in
Fig. 1d) as listed in Table 3. The samples S5–S9
deposit-ed at higher target frequency (200–300 kHz), have higher
thickness (around 1?7–2?2mm) compared to the
sam-ples (S2–S4), deposited at a lower target frequency of 100 kHz. This may be attributed to reduction in target poisoning with increase in target frequency thus
provid-ing higher deposition rate as reported by Kelly et al.3
It cannot be concluded from Table 3 that increase in target frequency directly results in higher thickness.
The flowrate and partial pressure of N2 may also play
an important role in the deposition, as has been reported
for pulsed DC CFUBMS system by Astrand et al.6
Moreover, it seems that variation in deposition tempera-ture has almost no effect on coating thickness. Variation in surface roughness of all TiAlN coated samples is listed
in Table 3. All the samples have roughness around 0?08–
0?13mm except S3 having a roughness of y0?2mm.
Within the range studied, varying the deposition tem-perature or target frequency has no clear effect on surface
roughness. Kimet al.4 similarly observed no significant
variation in surface roughness of the coating when N2
partial pressure was varied between 0?3–0?5 mTorr
(0?039–0?067 Pa).
Micro- and nanomechanical properties
The composite microhardness of all deposited coatings is found to be in the range of 20–25 GPa under 1 N test load, as listed in Table 3. No systematic parametric effect of deposition temperature and target frequency could be discerned. Table 3 indicates that the first five samples (S2–S6) have slightly higher composite micro-hardness than last three (S7–S9). This may be due to the presence of high Al percentage in the film. The first five samples (S2–S6) have Al percentage less than 53% whereas last three samples (S7–S9) have Al percentage more than 56%. Higher Al percentage means presence of more amount of soft hcp AlN phase as reported by
PalDey and Deevi15 as well as Santana et al.16in the
film, which may have provided reduced hardness. Sample 6 was selected for further nanomechanical characterisation by nanoindentation and nanoimpact testing because it showed the highest critical load
(86?4 N) in scratch testing. Analysis of unloading curves
provides hardness of (21?9¡6?0) GPa and reduced
elastic modulus of (250¡36) GPa. Assuming a Poisson
ratio of 0?2 for the coating, this converts to a Young’s
Table 2 Chemical composition of deposited TiAlN coatings
Sample no.
Atomic percentage of elements
Al TizAl
Ti Al N Fe
S2 30.40 33.84 33.45 2.31 52.68
S3 27.25 26.31 43.35 3.09 49.12
S4 28.42 27.46 42.36 1.66 49.23
S5 26.83 29.37 42.99 0.81 52.26
S6 29.65 29.52 40.83 0.00 49.90
S7 22.08 28.50 48.63 0.79 56.35
S8 22.14 29.02 48.20 0.63 56.72
(elastic) modulus of 307 GPa. The indentation beha-viour was compared with a TiN sample for benchmark-ing. Discrete steps due to fracture are clearly visible in TiN coating, which are absent for sample S6, suggesting improved toughness of sample S6 over TiN coating, as shown in Fig. 2. Depth profiling by nanoindentation was performed to confirm that the hardness varies little with depth at under 1/10 coating thickness and to investigate whether the elastic modulus determined from the 25 mN could be considered as a coating-only value. The recent ISO standard for depth sensing indentation (ISO 14577-4) notes that since the elastic stress field extends further than the plastic stress field a better strategy for coating-only modulus is to extrapolate to zero depth rather than rely on the 10% rule that is not correct for modulus. Extrapolation suggests a value of reduced indentation modulus around 268 GPa (i.e. a little higher than the value from the 25 mN tests, which have a contribution from the less stiff HSS substrate) and so a better value for the true elastic modulus of the
coating is y336 GPa, using Poisson ratio of 0?2.
Figure 3 shows the hardness was y23 GPa (i.e.
consistent with the 25 mN tests) up to y300 nm,
decreasing with depth beyond that due to the plastic field extending into the softer substrate. The large error bars are due to the high surface roughness, which is a significant fraction of the indentation depth.
The plasticity index (PI, plastic work done in indentation/total work done) has been used to predict the tribological behaviour of coated tools under cutting
condition. Beake et al.10noted that high PI is a critical
factor for interrupted cutting applications like milling but in case of continuous cutting applications like turning, the requirement for high PI is less critical and high hardness is a more dominant factor governing tool life. They also reported that in turning, tool life of cemented carbide (WC–Co) insert is longer when PI is relatively low (e.g. for TiAlN, or annealed AlTiN) than
for higher PI coatings (e.g. 0?50 for TiAlCrN). For
sample S6, the PI wasy0?47, which is very close to the
other TiAlN coatings reported in the literature. The fatigue fracture resistance of the sample S6 has been assessed by the nanoimpact test. The background to this test is provided in Refs. 17 and 18. It has proved highly effective in determining the fracture resistance of
hard coatings under repetitive impact.18 Each test
corresponds to 75 impacts. Figure 4 shows illustrative test results at 25, 50 and 100 mN. When the accelerating load was 25 mN no fracture was obtained in any of the five repeat tests. When the accelerating load was increased coating fracture could be observed in some of the tests. Figure 4 shows coating fracture at 100 mN
aftery45 impacts. The behaviour of the coating under
[image:4.595.75.511.51.311.2]repetitive nanoimpact can be compared to results
Table 3 Coating thickness, surface roughness and composite microhardness of deposited TiAlN coatings
Sample no. Coating thickness/mm Surface roughnessRa/mm Composite microhardness/GPa
S2 1.78 0.096 23.6
S3 1.23 0.194 24.9
S4 1.47 0.084 24.6
S5 2.03 0.076 24.6
S6 1.76 0.125 23.1
S7 2.18 0.094 22.6
S8 1.87 0.069 22.1
S9 2.06 0.085 21.7
1 Surface morphology and fractograph of two selected samples2S7 and S9
ONLINE
COLOUR
[image:4.595.57.529.665.766.2]reported previously (Fox-Rabinovich et al.19) for commercial Ti0?5Al0?5N coated cemented carbide inserts.
Using the same nanoimpact test with a slightly sharper indenter, they observed that the commercial TiAlN coated insert fractured almost immediately at only
15 mN accelerating load (Fig. 3aat page 5741 of
Fox-Rabinovich et al.19). Although sample 6 showed higher
fracture resistance than this commercial coating it has been deposited on HSS, a substrate with greater ductility than WC–Co, which may have influenced the strain accumulation under load and its propensity for cracking on repetitive impact.
Scratch adhesion
The failure of the coating has been identified by the sudden change in coefficient of friction. Table 4 lists the variation in critical load, in the range of 50–85 N for all the deposited coatings. It indicates an increase in scratch adhesion of the coating with increase in deposition temperature especially at low target frequency (100 kHz). The same trend is not followed when depositions are done at higher target frequency (200–300 kHz). The highest critical load has been found for sample S6, deposited at
3 Nanohardness profile within coated sample S6 over depth of.400 nm
2 Loading unloading curve forasample S6 andbTiN sample (for bench marking) during nanoindentation
4 Variation in depth of indentation with number of impacts in nanoimpact test at 25, 50 and 100 mN accel-erating force for 100 impacts
ONLINE
COLOUR
ONLY
ONLINE
COLOUR
300uC and 250 kHz target frequency, possibly as the increase in target frequency leads to increase in ion current density and consequently enhanced adhesion.
Coefficient of friction at chip tool interface and
wear coefficient
The coefficient of friction of a coated sample is commonly evaluated using the ball-on-disc test though the test conditions differ considerably from those in actual machining. There is no direct way to measure coefficient of friction during actual machining. Therefore, tangential cutting force and feed force have been measured during machining and coefficient of friction has been calculated
using Merchant’s circle diagram.20 Table 4 lists the
coefficient of friction of all the coated inserts (S2–S9) along with an uncoated insert (S1) after 1 min machining
of SAE 1037 steel with a cutting speed of 160 m min21,
feed of 0?2 mm rev21and depth of cut of 2 mm. All the
coated inserts show lower friction coefficient than the uncoated insert. Deposition temperature and target frequency have little clear effect on coefficient of friction. The highest friction coefficient was found for sample S3, which is thinner and has the highest surface roughness. In the ball-on-disc experiment the performance of a wear resistant coating is evaluated by the wear coefficient, defined as volume of material removed to a product of normal load and sliding distance as explained by Bull et al.21 Table 4 lists the dimensional wear coefficients,
which were found to be in the range of 5?62
9?561026mm3N21m21. These values compare
favour-ably with previous reports on TiAlN coatings,
1061026mm3N21m21as reported by Moet al.22and 2061026to 8061026mm3N21m21by Liet al.23With
increased deposition temperature, the wear coefficient decreases, particularly for samples S5, S6 and S7, deposited at high target frequency (250 kHz). However, the trend is not followed by samples S2, S3 and S4, deposited at low target frequency (100 kHz). No clear effect of target frequency has been observed. The wear coefficient is lowest (for sample S7) when deposition was
done simultaneously at high temperature (350uC) and
high target frequency (250 kHz).
The most used wear model is Archer’s wear equation
and the dimensionless wear coefficient K can be
calculated using that equation
V s ~K
W H
where V is the volume of worn away material, s is
the sliding distance,Wis the applied normal load,His
the hardness of the coating material and K is the
dimensionless wear coefficient. From the above equation
Kcan be calculated as
K~ V
sW|H
where V/sW actually indicates the dimensional wear
coefficient. Therefore, K is the product of dimensional
wear coefficient (mm3/N-m) and the hardness (GPa) of
the film. The dimensionless wear coefficient has been calculated and listed in Table 4. For all the samples, trends of both the dimensionless and dimensional wear coefficient are found to be very similar. No clear effect of target frequency was observed. Both the dimension-less and dimensional wear coefficient is found to be lowest (for sample S7) when deposition was done
simultaneously at high temperature (350uC) and high
target frequency (250 kHz).
The critical load characterises scratch adhesion
whereas the wear coefficient in a ball-on-disk experiment provides resistance to wear. Both of them are dependent on parameters like coating thickness and substrate bias voltage. There is experimental evidence for an inverse correlation commonly existing between them for many
coating systems. Takadoum and Bennani24
experimen-tally showed that with increasing thickness of ion plated TiN coatings on steel substrate, the adhesion decreased along with an increase in wear coefficient and for ion plated TiN coatings on stainless steel substrate, Bull et al.25 reported that with an increase in the substrate
bias voltage, the critical load decreases again with increase in wear rate. In the present work, all the coatings have been deposited at same substrate bias voltage and the coating thickness has been varied. The tight compositional range provides a useful sample set to investigate the correlation between scratch critical load and wear coefficient. By comparing samples S5–S9,
deposited at higher target frequency (2002300 kHz), the
same trend for critical load with increasing coating
thickness noted by Takadoum and Bennani24 was
observed. Similarly for samples S2–S4, deposited at low target frequency (100 kHz), the wear coefficient values follow the trend listed in Table 4. The present results indicate that if the deposition parameters are fixed, then the wear coefficient will vary inversely with critical load in agreement with these reports. The same is true for samples S2–S4 deposited at low target frequency (100 kHz) as well as for samples S5, S6, S8 and S9
deposited at higher target frequency (2002300 kHz).
[image:6.595.57.531.648.768.2]Sample S7 is the only exception where the wear coefficient
Table 4 Critical load, coefficient of friction and wear coefficient (dimensional and dimensionless) of deposited TiAlN coatings
Sample no.
Critical loadLC/N
Coefficient of friction as evaluated from machining
Wear coefficient (61026
mm3N21
m21
) as measured in ball-on-disc experiment
S2 55.0 0.54 8.72
S3 61.5 0.60 7.23
S4 77.0 0.53 7.99
S5 78.2 0.50 7.83
S6 86.4 0.50 7.35
S7 60.0 0.53 5.63
S8 77.5 0.53 8.69
S9 70.0 0.50 9.52
is found to be lowest though it shows comparatively lower critical load.
Machining performance
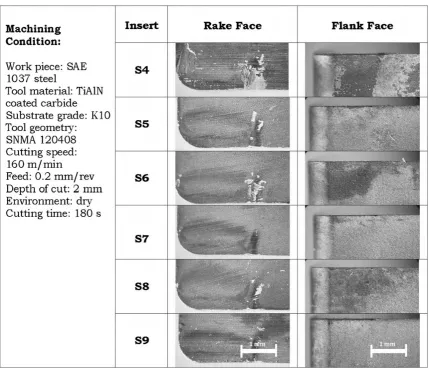
[image:7.595.87.517.46.419.2]The machining performance of the coated inserts has been assessed using the tool wear criterion. For first 90 s of machining, flank wear for all the inserts has been found to be negligible. Even after 3 min of machining, none of the inserts show any significant flank wear as shown in Fig. 5. The maximum and average flank wear of all inserts was in the range of 48–118 and 20–60mm respectively, as listed in Table 5. The maximum as well as average flank wear is highest for samples S3 and S4, which have lowest coating
thickness among all the samples. The result is found to be
similar as discussed by Bouzakiset al.26They
experimen-tally showed that in milling, the average flank wear of cemented carbide inserts reduced with increase in coating thickness. Additionally, S3 and S4 have lowest Al% among all the coatings. In dry turning, significant heat is generated at the tool workpiece interface due to high friction. As a result, oxidation occurs and a thin Al rich oxide layer is
generated that protects the tool from further oxidation.2
For these two inserts as the amount of Al rich oxide is less, the machining performance is consistent yielding greater crater and flank wear than other inserts. It can be inferred that when depositions are undertaken at higher target frequency (200–300 kHz), the maximum and average flank wear becomes less compared to inserts deposited at low target frequency (100 kHz). This would be attributed to enhanced wear resistance of the coating due to higher ionisation at higher target frequency. Variation in deposi-tion temperature has no significant effect on flank wear.
Strikingly, it is noticeable that there is almost no correlation between wear coefficients of inserts with their machining performance in terms of flank wear. This may be attributed to the wide difference between wear test and machining test conditions. Machining test conditions result in high chip tool interface pressure and temperature, which are relatively less in ball-on-disc wear test. Further, in wear test, the linear speed of WC–
[image:7.595.64.291.647.769.2]Co ball is 12 m min21, whereas in machining, the
Table 5 Maximum and average flank wear of TiAlN coated inserts during machining of SAE 1037 steel
Cutting time/s
Sample no.
Max. flank wear/mm
Avg. flank wear/mm
20–90 S2–S9 Wear is negligible
180 S2 60 37
S3 78 39
S4 117 59
S5 60 36
S6 60 28
S7 59 33
S8 48 23
S9 52 30
5 Nature of crater and flank wear of selected inserts after dry turning of SAE 1037 steel at cutting velocity of 160 m min21, feed of 0?2 mm rev21and depth of cut of 2 mm
ONLINE
COLOUR
cutting speed is 160 m min21. The speed in machining is
.10 times higher and that results in a very high cutting
temperature (typically 500uC) at the cutting zone.27As
an illustration of this, the contact pressure has been estimated for one of the samples (S9) in both tests. In the
wear test, normal loadN510 N and area of scar on the
WC ball A50?305 mm2. Therefore, contact pressure
Pwear5N/A532?77 N mm22 (0?03 GPa). In machining
test, normal load N51021?94 N and area of contact
A51?3976 mm2. Therefore, contact pressure
Pmachining5N/A5731?21 N mm22(0?73 GPa). The
con-tact pressure in the machining test isy25 times higher
than that in wear test so it is not that surprising that there is no clear correlation between cutting tool performance and the wear coefficients as obtained via ball-on-disc test.
Unlike flank surface of the inserts, the rake surface has undergone significant wear during machining. Samples deposited at lower target frequency (100 kHz) such as S2, S3 and S4 have significant amount of crater wear only after 3 min of machining. Sample S2 shows considerable removal of the coating from rake face whereas sample S3 shows complete removal of coating. Nature of crater wear of sample S4 is less than these two, possibly indicating advantage of depositing at higher
temperature (350uC). However, the scenario is different
for samples deposited at higher target frequency (200– 300 kHz). Those samples (S5 to S9) show almost no removal of coating from rake surface. However, inserts S5, S6 and S8 show signs of grooving wear at the rake face whereas inserts S7 and S9 do not show any grooving wear. After 3 min of machining, the average flank wears
for these two inserts (S7 and S9) are only 33 and 30mm
respectively. This clearly indicates the advantage of
depositing at a higher temperature (.300uC) and higher
target frequency (.250 kHz). High deposition
tempera-ture and high target frequency improves ionisation during deposition providing better machining performance. Figure 6 provides a clear idea of the nature of crater
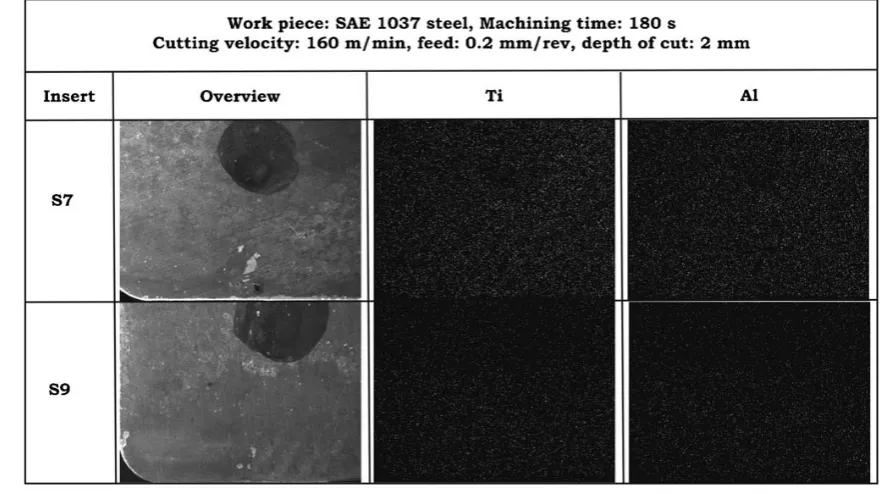
[image:8.595.68.513.53.300.2]and flank wear for inserts S4 to S9 after 3 min of machining. From Fig. 5, it is clear that insert S7 and S9 perform the best among all inserts as tool wear is negligible for them. Therefore, elemental area mapping of these two inserts (S7 and S9) have been carried out after 3 min of dry turning of SAE 1037 steel, as shown in Fig. 6. It is clearly visible that both Ti and Al are equally present all over the rake face revealing no crater wear or grooving wear upon machining.
Conclusions
TiAlN coating could be realised using pure Ti and Al targets in dual cathode machine with acceptable compo-site hardness (21–25 GPa), scratch adhesion (55–86 N) and wear coefficient (521061026mm3N21m21). The
coating composition was not directly dependent on deposition temperature or target frequency individually; but increasing both the parameters increased the Al percentage in the coating, thus Al rich coatings were produced. The fatigue fracture resistance of the as deposited TiAlN coating was found to be better than a
commercial TiAlN coating of similar Ti/Al 51 : 1 ratio
deposited on cemented carbide. The wear coefficient was improved with increase in deposition temperature when depositions were done at high target frequency (250 kHz) but the similar trend was not followed at lower target frequency (100 kHz). The wear coefficient was found to be lowest (5?661026mm3N21m21), when deposition
was done simultaneously at high temperature (350uC) and
high target frequency (250 kHz).
There was almost no correlation between wear coefficients of the coated inserts and their machining performance in terms of flank wear due to the wide difference between wear test and machining test condi-tions. The flank wear remained low for all the inserts after 3 minutes of dry turning of SAE 1037 steel (cutting
velocity of 160 m min21, feed of 0?2 mm rev21 and
depth of cut of 2 mm). The crater wear was significant for the samples deposited at low target frequency
6 Elemental area mapping using EDX on inserts S7 and S9 after 180 s of dry turning of SAE 1037 steel at cutting speed of 160 m min21, feed of 0?2 mm rev21and depth of cut of 2 mm
ONLINE
COLOUR
(100 kHz) whereas the samples deposited at high target frequency (200–300 kHz) did not reveal any coating removal from rake face. Moreover, coatings deposited at
higher temperature (.300uC) and at higher target
frequency (.250 kHz) were free from both crater wear
and grooving wear after 3 min of machining. Thus the mechanical properties and machining performance of TiAlN coatings deposited by dual cathode pulsed dc CFUBMS were favourably influenced by a simultaneous increase in target frequency and deposition temperature.
Acknowledgement
P. Mandal and S. Paul gratefully acknowledge the funding support that they received from Department of Science and Technology, Government of India, under FIST Programme (Sanction No. SR/FST/ET-II-003/ 2000 dated 20?5?2002).
References
1. J. R. Peterson:J. Vac. Sci. Technol., 1974,11, (4), 715. 2. W. D. Munz:J. Vac. Sci. Technol. A, 1986,4A, 2717. 3. P. J. Kelly and R. D. Arnell:Vacuum, 2000,56, 159.
4. G. S. Kim, S. Y. Lee and J. H. Hahn:Surf. Coat. Technol., 2005,
193, 213.
5. P. W. Shum, K. Y. Li, Z. F. Zhou and Y. G. Shen:Wear, 2004,
257, 1030.
6. M. Astrand, T. I. Selinder and M. E. Sjostrand: Surf. Coat. Technol., 2005,200, 625.
7. O. Zywitzki, H. Klostermann, F. Fietzke and T. Modes:Surf. Coat. Technol., 2006,200, 6522.
8. H. C. Barshilia, K. Yogesh and K. S. Rajam:Vacuum, 2008,83, 427. 9. J. Musiland and H. Hruby:Thin Solid Films, 2000,365, 104.
10. B. D. Beake, G. S. Fox-Rabinovich, S. C. Veldhuis and S. R. Goodes:Surf. Coat. Technol., 2009,203, 1919.
11. V. H. Derflinger, A. Schutze and M. Ante:Surf. Coat. Technol., 2006,200, (16–17), 4693.
12. G. S. Fox-Rabinovich, A. I. Kovalev, M. H. Aguirre, B. D. Beake, K. Yamamoto, S. C. Veldhuis, J. L. Endrino, D. L. Wainstein and A. Y. Rashkovskiy:Surf. Coat. Technol., 2009,204, 489. 13. T. Zhou, P. Nie, X. Cai and P. K. Chu:Vacuum, 2009,83, 1057. 14. Y. He, I. Apachitei, J. Zhou, T. Walstock and J. Duszczyk:Surf.
Coat. Technol., 2006,201, 2534.
15. S. PalDey and S. C. Deevi: Mater. Sci. Eng. A, 2003, A342, 58.
16. A. E. Santana, A. Karimi, V. H. Derflinger and A. Schutze:Tribol. Lett., 2004,17, (4), 689.
17. B. D. Beake, S. R. Goodes and J. F. Smith:Surf. Eng., 2001,17, 187. 18. B. D. Beake, G. A. Bell, S. R. Goodes, N. J. Pickford and J. F.
Smith:Surf. Eng., 2010,26, 37.
19. G. S. Fox-Rabinovich, B. D. Beake, J. L. Endrino, S. C. Veldhuis, R. Parkinson, L. S. Shuster and M. S. Migranov: Surf. Coat. Technol., 2006,200, 5738.
20. G. Boothroyd: Fundamentals of metal machining and machine tools’; 1975, McGraw Hill.
21. S. J. Bull, R. Kingswell and K. T. Scott:Surf. Coat. Technol., 1996,
82, 218.
22. J. L. Mo, M. H. Zhu, B. Lei, Y. X. Leng and N. Huang:Wear, 2007,263, 1423.
23. X. Li, C. Li, Y. Zhang, H. Tang, G. Li and C. Mo:Appl. Surf. Sci., 2010,256, 4272.
24. J. Takadoum and H. H. Bennani:Surf. Coat. Technol., 1997,96, 272.
25. S. J. Bull, D. S. Rickerby, T. Robertson and A. Hendry:Surf. Coat. Technol., 1988,36, 743.
26. K. D. Bouzakis, S. Hadjiyiannisa, G. Skordarisa, I. Mirisidisa, N. Michailidisa, K. Efstathioua, E. Pavlidoub, G. Erkensc, R. Cremerc, S. Rambadtc and I. Wirth: Surf. Coat. Technol., 2004,177–178, 657.
Paper:1265
Title:Effect of deposition parameters on TiAlN coating using pulsed DC CFUBMS
Dear Author
During the preparation of your manuscript for publication, the questions listed below have arisen. Please attend to these matters and return this form with your proof. Many thanks for your assistance
Query Reference
Query Remarks