EUSA Review Fall 2010 1
Inside the Fall 2010 EUSA Review:
EUSA Review Forum: Post-crisis Europe: Economic, Fiscal and Financial Prospects
The Response to the Evolving Financial Crisis in the EU David G Mayes 2
Lisbon Agenda Performance: OECD Measures David L. Cleeton 5
Commentary on the SGP Reform Proposals Andrew Hughes Hallett 10
EUSA EU Political Economy Interest Section
Fiscal Discipline is Not Enough to Stabilize the Euro Erik Jones 11
EUSA Teaching the EU Interest Section
Teaching tools in EU studies and Social Networking Stefania Baroncelli
and Roberto Farneti 17
EUSA EU Law Interest Section
The Legal Response to the Financial Crisis in Europe Chiara Zilioli 20
Book Reviews 24
Martin Heipertz and Amy Verdun Ruling Europe: the Politics of the Stability and Growth Pact reviewed by David G Mayes
Paul Taylor The End of European Integration. Anti-Europeanism Examined reviewed by Tristan Vellinga
Volume 23, No. 3
Fall 2010
Mark your Calendar!
The 2011 EUSA Biennial Conference
will take place at the Hyatt Regency Boston
March 3-5, 2011
2 Fall 2010 EUSA Review
bility Facility) funds earmarked to cover any inability to borrow on open markets (approximately 0.25trillion euro in AAA instruments and approaching 0.5trillion euro altogether) represent a very firm response and declaration that the euro area will not be allowed to collapse under the strain.
We can now also see much of the regulatory response, both directly within the EU and orchestrat-ed through the G20 and the Basel Committee, which will be implemented over the coming years to try to avoid a similar crisis in the future. The Basel Com-mittee through ‘Basel III’ has addressed most of the more obvious problems for the prudential regulation of individual institutions. It has recognized that banks need both capital and liquidity buffers.1 Furthermore it has realized that if capital buffers are to be used to keep a bank going then the main buffer has to be ordinary equity, otherwise a bank has to be put into insolvency. Other buffers merely protect the senior creditors from loss, they do not protect the bank as a going concern.
Secondly, the EU has recognized that dealing with individual institutions is not enough and that risks in the system as a whole need to be assessed. The European Systemic Risk Board (ESRB) that has re-cently been set up should help assess such risks at both the country and EU-wide level.
Finally the EU has also recognized that there are very real problems in having national regulatory authorities and international financial institutions. Al -though three new agencies have been created out of the ‘level 3’ committees for banking, securities mar-kets and insurance, the EU has not taken the opportu-nity to introduce EU-level bank regulation and supervi-sion.
The new system is therefore likely to have a number of important drawbacks, which will hamper its effectiveness in the future. We address just one of these here:
• the lack of agreement on an EU-level for bank regulation, deposit insurance and most im-portantly resolution of problem banks.
The drawback is particularly important as it re-flects an inability to handle large (mainly cross-border) institutions. Since these institutions lie at the heart of the European financial system, this is a serious defi -ciency.
We end by considering some of the problems of transition from a crisis regime to normal arrange-ments over the course of the coming years and the lack of tools for macro-prudential regulation.
Post-crisis Europe: Economic, Fiscal and Financial Prospects
Guest Editor Patrick Crowley
Patrick M. Crowley is an international macro-economist and Professor of economics at Texas A&M University in Corpus Christi, Texas, USA. He special-izes in studies of regional integration, with particular emphasis on the European Union, and in frequency domain methods as applied to macroeconomic phe-nomena. He has published widely in journals such as the Journal of Common Market Studies, the Journal of Economic Integration, the International Trade Journal, International Finance, and the Journal of Economic Surveys and has been the editor for several edited volumes on Europe, probably most notably the Rout-ledge volume entitled Before and Beyond EMU which was published in 2002 and the Ashgate volume Cross-ing the Atlantic which was published in 2004. Crowley is currently co-chair of the economics interest sec-tion of the European Union Studies Associasec-tion of the US (along with David Mayes), and is also a Fellow of the Euro Area Business Cycle Network (EABCN). In 2004-2005 Crowley was a Visiting Research Scholar at the Bank of Finland (Suomen Pankki) in Helsinki, Finland, and has made return visits during the sum-mers of 2006, 2007, 2008 and 2010
The Response to the Evolving Financial Crisis in the EU
David G Mayes
A year after the collapse of Lehman Broth-ers and the high point of the global financial crisis it looked as if Europe was likely to come through the crisis relatively well. Iceland, Ireland, Latvia and the UK among others had been hard hit but for most countries the losses had been manageable. As 2010 has developed, however, the euro area has started to encounter problems with Greece, Ireland, Spain and Portugal facing serious difficulty in raising funding on financial markets as the world economy seemed to be slowing down again and debt levels continued to rise rapidly. Hence, taking stock two years after Lehman, the prospect does not look quite so favorable, even though the size of the EFSF (European Financial
EUSA Review Fall 2010 3
The Handling of Large (Cross-Border) Institutions.
The crisis has taught national authorities how smaller institutions need to be handled if their problems are to be resolved swiftly at minimum loss. The Bank-ing Act 2009 in the UK is a clear example, as the UK needed to restructure its arrangements fundamentally following the deficiencies encountered when Northern Rock got into difficulty in September 2007 and could only be resolved by nationalization and hence a sub-stantial commitment of taxpayers’ money.
The authorities need to step in early before the problems mount, taking over from the shareholders, whose claims are written down against the losses fol-lowing an immediate assessment of the value of the bank. While a small bank can be simply placed in sol-vency and insured depositors paid out immediately, it is normally a lower cost option to transfer the insured deposits and other viable parts of the business to one or more other providers according to who makes the best bid and leave the remainder in the ‘residual bank’ which is then wound up through normal insolvency. If there is not enough time to do this then all or part of the bank can be placed temporarily in a “bridge” bank run by the authorities until it can be resolved through transfer to other providers. The UK retained national-ization as a last resort. Unless nationalnational-ization is used then this should be of no cost to the taxpayer as the deposit insurance fund would be financed by the in -dustry (i.e. all depositors). It is only if the fund is insuf-ficient and needs to borrow from the taxpayer in the short run or if the nationalized bank cannot be sold at a profit after reorganization that there should be tax -payer costs. Many European countries did not have these powers, particularly to take over a bank prior to insolvency, and hence major changes have been necessary. Not all countries have acted and the result is likely to be considerable variation from one country to the next.
While the majority of bank failures may have been in small institutions it is the difficulties in large institutions and their bailing out by the authorities that have created the pressures on national budgets and the build up of moral hazard for the future. In the main these bailouts have occurred not because this was the preferred policy but because there seemed to be no viable alternatives. There were two elements to the problem. The first was that the vital functions of the bank have to be kept running without interruption or there would be a serious disruption to the financial system and loss of confidence and the second that it is impossible to work out what needs to be done in a complex organization fast enough for it to be
imple-mented. Thus rather than simply the traditional epithet that these organizations were ‘too big to fail’, the prob-lem was that they were too interconnected to fail or too complex to sort out. Thus a route has to be found which offers swift resolution at least partly as a going concern, without simply bailing out the existing share-holders, although the amount of new equity required to return to adequate capitalization may in any event dilute the existing holdings to small proportions.
The EU has only partly addressed this problem even at the national level. There is no clear agreement on whether there should be limits to the size and com-plexity of institutions. The concept of ‘living wills’ has been promoted particularly in the UK. Under such a ‘living will’ a bank has to explain how its vital functions can be kept running by the authorities, without the use of public money in the event that the organization fails to maintain adequate capital. This requires not just adequate simplification of structure that the different activities can be separated out and resolved but that there is adequate preparation so that these activities could be run in the new structure without a break in operation. Secondly, capital buffers need to be effec-tive enough that they can absorb the shock. This can be achieved most readily, not simply by increasing their size, but by ensuring the most junior debt can be turned into equity, either if existing equity falls be-low regulatory limits or if there is an economy wide crisis and markets are unlikely to be able to refinance the bank through a new capital injection. These con-tingent contracts (CoCos) have already been used by the Lloyds Banking Group. There the trigger is falling below a 5% equity ratio.
Thirdly, cushions need to be expanded in good times so that there is the scope to use them when the problem comes without immediately running down regulatory capital to the point that it does not meet the authorities’ minimum requirements. A counter-cyclical pressure against asset prices and credit growth was one of the strongest lessons from the crisis. The EU has not decided how to handle this yet.
-4 Fall 2010 EUSA Review
ity. Some form of weighting of needs will be required. This is yet to be addressed. What has been addressed is burden sharing – having a priori agreements about how the cost to the taxpayer is to be shared out among the participant countries. This clearly adds moral haz-ard.
There is some hope of a move towards ad-dressing the pan-EU spillover effects as the Com-mission has proposed that each country should cre-ate ‘resolution funds’ financed by the banking system that would handle to costs of resolution in addition to those encountered by the deposit insurance fund. It has been proposed to explore whether this could be applied at the EU level in 2014. However, the idea that there should be EU-level regulation for cross-border banks, EU-level supervision, EU-level resolution to get over the lack of powers across regimes or EU-lev-el insurance has not been taken up. Analogously, the US had recognized this need in 1935 as a result of the Great Depression. The EU apparently is hoping that having supervisory colleges, soft law agreements and the ability of the new European Banking Agency to ar-bitrate in the case of disagreement, will be sufficient.
The Return to ‘Normality’
When the crisis struck in earnest after the fall of Lehman Brothers most EU countries introduced sweeping guarantees for depositors and other credi-tors. Despite harsh criticism of Ireland which took the first step, deposit insurance was raised to €50,000 and is set to move to €100,000 at the beginning of 2011, thus enshrining a crisis measure and making the running of the normal system much more expen-sive. Clearly there is a collective action problem and all countries will need to move back to normality in an organized way. Nevertheless there is no indication that previously financial stability was threatened by the failure to reimburse depositors beyond the rather low but variable limits that applied before the crisis.
Timing of changes will be everything as the recovery itself has slowed down. One of the likely causes of the present crisis was the prolonged very low interest rates that followed the dotcom collapse and the 9/11 disruption. Holding off the return to nor-mality too long could lead to another sharp cycle but returning too rapidly could push the EU back into re-cession. The EU will probably not be the first mover in this regard internationally and at the time of writing there is a worry that there will be competitive attempts to push exchange rates down that will merely exacer-bate the interest rate and imbalance problems.
The Lack of Tools for Macro-prudential Regulation
Over the last five years there have been enor -mous advances in the understanding of how connect-ed the parts of the financial system are and the extent to which risks may be being concentrated rather than spread. However, analysis and action are not one and the same. Central banks typically have responsibility for macro-prudential stability but they cannot exercise that responsibility if they only have the tools of mone-tary policy. Sometimes the needs of price stability and financial stability may point in the same direction but they need not. Using interest rates to restrain financial growth may not be appropriate if there is no general inflationary pressure. Tools are required that impinge on lending activity and asset prices, either automati-cally or on a discretionary basis. Loan to value ratios are a commonly cited possibility. If asset prices start rising then new loans should represent a decreasing portion of that rise.
As it is, the new ESRB will have good resourc-es for analysis but it can only warn and recommend action by the national authorities. The idea is that if an authority does not carry out the recommendations it would have to explain and that this process would give moral pressure for action. There are two dangers to this process. The first is that it is very easy to pro -duce a long set of risks and to caution people against them. This can readily devalue the message. The ECB has produced annual assessments of public finances among the member states, with matching cautions and calls for action. The impact of these became very limited. The second is that without the responsibility to act itself it will be rather easier for any of the par-ties to defer action. The ESRB will not wish to have its authority challenged which might occur if it tries to push for more action than the states concerned feel is merited.
Concluding Remark
EUSA Review Fall 2010 5 past. However, it was this perseverance with a
sys-tem that was not plausible that led to the problems in Iceland and the practical difficulties over coordination that led to the dispute over Fortis. It was only where the home country firmly tackled the problems without recourse to partner countries as with RBS and Lloyds that the system ‘worked’ but there the taxpayer – thus far - has paid. There is a reasonable chance that, as in the Nordic crisis, the taxpayer losses may fall and in some countries the taxpayer may come out ahead in simple fiscal sense. Nevertheless this is an opportu -nity missed and a worry for the future. If a problem on this scale does not prompt a comprehensive EU level solution one might wonder what will.
David G Mayes, University of Auckland
Notes
1 The Basel Committee recognized that an agreement on
liquidity buffers was needed even when it was negotiating
the first accord in the 1980s but it proved too difficult to get
agreement and unfortunately as a consequence the whole topic was seriously neglected.
How to Support the European Union
Studies Association!
Library Membership
* To build the EU-related library collection. $150 / year
Sustaining Membership
* Free conference access for up to 4 gradu-ate students.
* One free 1-page advertisement/an-nouncement in the Review per year. $1,000 / year
Contributing Membership
* 25% conference fee reduction for up to 4 graduate students.
* 50% reduction on one 1/2-page advertise-ment in the Review per year. $500 / year
Your gifts are tax-deductible to the extent allowable by U.S. tax law. Include a contribu-tion with your membership renewal, or contact the EUSA Office to make a contribution. Call 412.648.7635 or email EUSA.
Lisbon Agenda Performance: OECD Measures
David L. Cleeton
The Organization for Economic Cooperation and Development (OECD) is comprised of 33 member countries including 21 of the EU 27 member states.1 For over four decades the reliability of OECD data for comparative economic and social analysis has been unrivaled and the recent compendium of OECD statis-tics in the OECD Factbook 2010 and its accompany-ing database2 has been chosen as the source for an exercise in assessing the relative performance of EU member states vis-à-vis the economic performance standards exemplified by the United States and Ja -pan.
Growth Rates in Labor Productivity
The single measure most often used to evalu-ate the dynamic efficiency of an economy is the growth rate of labor productivity and most often GDP per hour worked is the chosen empirical measure of labor pro-ductivity. The growth rate of GDP per capita worked is then typically broken down into two components: changes in labor productivity itself, the rate of increase in GDP per hour worked, and changes in the utilization of labor, that is hours worked per capita. For compar-ative purposes the OECD data has been converted to constant US dollars using Purchasing Power Parities indices with the year 2000 as the base. On the follow-ing page Chart 1 gives a summary of the comparative data for the period 2001-08.
The bottom panel of the chart shows the growth rate in GDP per capita. The bars represent the average annual growth rate over the period 2001-07 and the triangles show the beginning of the recessionary pe-riod of 2007-08. In general the 2007-08 performance was below the longer-term trend established earlier in the decade, e.g. Estonia and Ireland stand out in lead-ing the recessionary decline. In the ranklead-ings the top overall growth performances were established by the strong continued performance of EU accession coun-tries. Estonia, the Slovak and Czech Republics, Po-land, Slovenia, and Hungary posted respectively the highest average growth rates. In fact only the Franco-German core and their surrounding smaller neighbors and the laggard southern economies of Italy and Por-tugal failed to exceed the growth rate performance of the United States.
6 Fall 2010 EUSA Review
EUSA Review Fall 2010 7 in both the US and Japan: a decline of 4/10ths of 1
percent per year in hours worked per capita. The only country with a comparable rate of decline was France with 3/10ths of 1 percent per year. Portugal suffered a larger downward rate of labor utilization posting a decline of 9/10ths of 1 percent per year. At the other extreme Estonia, the Slovak Republic, Poland, Hun-gary and Greece all saw annual growth rates in hours worked per capita in excess of 1 and ¼ percent per year over the 2001-07 period.
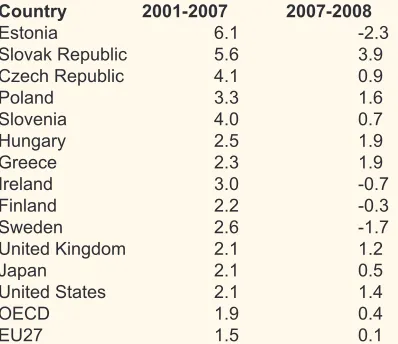
[image:7.612.37.236.279.451.2]After adjusting for changes in hours worked per capita the growth of labor productivity in 11 EU countries exceed the average annual growth rate of 2.1 percent set by both the US and Japanese econo-mies. The high relative performances are tabled be-low.
Table 1: Growth Rates in GDP per Hour Worked
Country 2001-2007 2007-2008
Estonia 6.1 -2.3
Slovak Republic 5.6 3.9
Czech Republic 4.1 0.9
Poland 3.3 1.6
Slovenia 4.0 0.7
Hungary 2.5 1.9
Greece 2.3 1.9
Ireland 3.0 -0.7
Finland 2.2 -0.3
Sweden 2.6 -1.7
United Kingdom 2.1 1.2
Japan 2.1 0.5
United States 2.1 1.4
OECD 1.9 0.4
EU27 1.5 0.1
This relative performance record for the most part is consistent with economic convergence in the process of integrating new EU member states. It is not however what one would have expected to see through the fulfilment of the goals established under the Lisbon Agenda and summarized below.3
a new strategic goal for the next decade: to become the most competitive and dynamic knowledge-based economy in the world capable of sustainable econom-ic growth with more and better jobs and greater social cohesion. Achieving this goal requires an overall strat-egy aimed at:
preparing the transition to a knowledge-based economy and society by better policies for the infor-mation society and R&D, as well as by stepping up the process of structural reform for competitiveness and innovation and by completing the internal mar-ket;
modernising the European social model, in
-vesting in people and combating social exclusion; sustaining the healthy economic outlook and favourable growth prospects by applying an appro-priate macro-economic policy mix.
Contributions to GDP Growth
A different measurement approach which fo-cuses on the emphasis placed on the innovative pro-cesses tied to the knowledge-based economy and the information society is offered in the analysis conducted by the OECD on the topic of productivity and growth accounting. In growth accounting, GDP growth is fur-ther decomposed into the contributions of labor and capital inputs and multifactor productivity, or how the production knowledge base and inter-factor productiv-ity improves over time. More recently there has been an effort undertaken to breakout alternative forms of capital investment. Information and Communications Technology (ICT) capital includes the categories of in-vestment in computer hardware and software as well as communications equipment. Under the OECD clas-sification scheme, non-ITC capital is comprised pri -marily of categories spanning investments in transport equipment and non residential construction; products of agriculture, metal products and machinery other than computer hardware and communications equip-ment; and other products of non residential gross fixed capital formation.
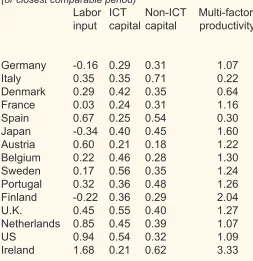
Using these categories, the OECD has es-timated the contributions to GDP growth associated with changes in the labor input, ICT capital, non-ITC capital, and the residual multi-factor productivity com-ponent. The time period used by this recent OECD study is longer term than the period under the Lisbon Agenda, covering nearly a quarter of a century. This prevents the inclusion of Baltic and Central and East-ern European countries which have only relatively re-cently joined the OECD.
The results are summarized in Table 2 and in Chart 2 on the following pages. The examination of the contributions of ICT capital to GDP growth shows two cluster groups in comparison to the reference tar-gets set by the US and Japan. Japan’s 4/10ths of 1 percent (0.40) annual growth rate contribution from ICT capital is beaten by a total of five EU countries but three, Denmark (0.42), the Netherlands (0.45) and Belgium (0.46) underperform vis-à-vis the US (0.54). Both the United Kingdom (0.55) and Sweden (0.56) marginally outperform the US in terms of ICT capital contributions.
produc-8 Fall 2010 EUSA Review
tivity. However their overall GDP growth performances still fell short of the US’s record because of the signifi -cantly larger contribution of labor.
[image:8.612.314.567.69.330.2]Denmark, the Netherlands, and Belgium all fell behind Japan in the measured contributions to GDP growth from non-ITC capital and multi-factor produc-tivity. Japan was the only country in the study to see a decline in the labor input over the comparison period while Denmark and Belgium showed weak labor input growth and the Netherlands demonstrated strong la-bor input growth comparable to the highest level dem-onstrated by the growth of the US labor input. Over-all the combined effects were that Japan was able to produce significantly better overall GDP growth than Denmark and slightly inferior growth than Belgium. The Netherlands on the other hand came in with the strongest EU member state performance with an an-nual overall GDP growth rate of 2.77 compared to 2.89 posted by the US.
Table 2: Contributions to GDP Growth
Average annual growth in percentage, 1985-2008 (or closest comparable period)
Labor ICT Non-ICT Multi-factor input capital capital productivity
Germany -0.16 0.29 0.31 1.07 Italy 0.35 0.35 0.71 0.22
Denmark 0.29 0.42 0.35 0.64
France 0.03 0.24 0.31 1.16
Spain 0.67 0.25 0.54 0.30
Japan -0.34 0.40 0.45 1.60
Austria 0.60 0.21 0.18 1.22
Belgium 0.22 0.46 0.28 1.30
Sweden 0.17 0.56 0.35 1.24
Portugal 0.32 0.36 0.48 1.26
Finland -0.22 0.36 0.29 2.04
U.K. 0.45 0.55 0.40 1.27
Netherlands 0.85 0.45 0.39 1.07
US 0.94 0.54 0.32 1.09
Ireland 1.68 0.21 0.62 3.33
EUSA Review Fall 2010 9
Unit Labor Costs
Our third measure looks at the overall competi-tiveness of a country through the examination of unit labor costs. Unit labor costs are codetermined by the dynamics of labor compensation and labor productiv-ity and serve as the primary determinant of cost pres-sures on producer prices. Typically unit labor costs are defined as the average labor cost per unit of ag -gregate output or the ratio of total labor costs to total output on either a per worker or per worker hours ba-sis.
Using data over the decade of 1998-2008, the OECD reports average annual growth rates in unit la-bor costs and productivity as summarized in Chart 3 and Table 3. Japan clearly sets the standard over the decade for labor cost driven competitiveness. While GDP growth was negatively affected by a large de-cline in labor utilization in the Japanese economy this does not impact in the same way on unit labor costs. In fact with labor productivity growth in the mid to low range of the group of most developed economies, it is the decade-long strong wage restraint seen in the Japanese economy that is the primary driver of the significant downturn in unit labor costs. The only other economy with sufficient wage restraint matching pro -ductivity growth over the decade is Germany which manages to hold growth in unit labor costs to nearly zero.
Over this decade, among the candidate and later accession countries of EU, most economies saw strong gains in labor productivity. Poland, the Czech and Slovak Republics, Slovenia, Estonia, and Hunga-ry along with Ireland all saw average annual produc-tivity gains in excess of 2.5 percent while Japan and the United States respectively recorded 1.43 and 1.74 percent growth rates. Due to even higher growth rates in labor compensation, unit labor costs rose by more than in the United States in all these countries, with the exception of Poland.
Conclusion
In the comparative OECD data we have ex-amined on labor productivity, growth accounting, and labor costs there is no strong support for the achieve-ment of the primary Lisbon Agenda goal of “becoming the most competitive and dynamic knowledge-based economy in the world capable of sustainable econom-ic growth”. The driving force of ITC capita investment shows up primarily in maintaining the relative perfor-mance vis-à-vis Japan and the US of a small set of mid-sized economies located around the Franco-Ger-man core. In terms of economic growth convergence in matching the performances of the Japanese and US economies, the data shows this to be localized
re-gionally in the combination of labor productivity gains and increased labor utilization rates across recent EU accession countries.
David L. Cleeton, Christopher Newport University
Notes
1 Countries which share OECD and EU membership are:
Austria, Belgium, Czech Republic, Denmark, Estonia, Finland, France, Germany, Greece, Hungary, Ireland, Italy, Luxembourg, Netherlands, Poland, Portugal, Slovak Re-public, Slovenia, Spain, Sweden, and the United Kingdom.
2 The OECD Factbook 2010: Economic,
Environmen-tal and Social Statistics (May 2010) can be accessed online at: http://www.oecd-ilibrary.org/economics/oecd-factbook_18147364. The website access allows the downloading of Adobe Acrobat versions of the chapters
and subsections of the publication along with Excel files
containing the data used to produce the publication’s tables, charts, and graphs.
3 From the Lisbon European Council 23-24 March 2000
10 Fall 2010 EUSA Review
EUSA Review Fall 2010 11
Commentary on the SGP Reform Proposals
Andrew Hughes Hallett
Prior to the financial crisis in September 2008, public finances in the European Union (EU), including countries in the euro area, appeared to be in reason-able shape. In fact, the average budget deficit-to-GDP ratio was close to 3%, and the average government debt-to-GDP ratio was around 60%. In other words, for the EU taken as a whole, fiscal policy had been conducted more or less in line with the limits of the Stability and Growth Pact (SGP).
However, over the last couple of years, the stance of fiscal policy has deteriorated. Public finances (across the globe) are now in worse shape than ever during peace time, and fiscal policy is on an unsus -tainable path nearly everywhere. The budgetary crisis in Europe has received most attention, not least due to the desperate situation in Greece, but it is notewor-thy that public finances in Europe overall are stronger than in the UK, USA and Japan (Buiter, 2010).
Behind the average figures for the European Union - a public debt ratio of more than 80% and a def-icit ratio of nearly 7% - significant differences can be found between the member states. For example, Fin-land has relatively strong public finances; whereas the so-called PIIGS group (Portugal, Italy, Ireland, Greece and Spain) have very high debt and deficit ratios. And in between are Germany and the Netherlands, al-though with public finances not yet strong enough to satisfy the Maastricht criteria.
There are several reasons for this dramatic worsening of public finances in recent years. One is clearly the direct increase in public expenditures as-sociated with various rescue packages for banks and other financial institutions following the financial crisis. Another reason is the indirect rise in expenditures and fall in revenues due to the operation of automatic sta-bilisers following the economic downturn that came in the wake of the financial crisis. And most obviously, public revenues have fallen as a result of the slimming down of the housing and financial sectors, and the consequent loss of output and employment that fol-lowed over the last two years.
The fiscal misery may have serious economic consequences. First, high deficit and debt ratios may lead to dramatically increasing risk premia on interest rates, reflecting the risk of sovereign default, which in turn may not only reinforce the fiscal troubles but also would be harmful to private investment etc. Second, there is growing evidence that debt ratios above 90% may adversely affect economic growth (Reinhart and Rogoff, 2009, Checherita and Rother, 2010). In fact, recent projections made by the IMF (2010) forecast
even US and UK debt-to-GDP ratios to exceed 90% by 2011.
Against that background, it is understandable that there should be concerns about explosive debt developments. While simple in principle, it seems dif-ficult for the euro area members to implement the fis -cal pain needed to bring their public finances in or -der: governments hesitate to raise taxes and/or cut expenditures. This reflects a populist attitude of “won’t pay” rather than “can’t pay” which might, in a longer term perspective, pose a threat to the survival of the euro. So, there seems to be a need for a new policy framework which (a) allows for short-term stabilisation and consolidation policies to be undertaken, (b) allows policy-makers to choose a size of the public sector as they want and (c) constrains the behaviour of fiscal authorities so as to avoid unsustainable fiscal policies in the future.
The research we have done is concerned with a framework for setting fiscal and monetary policies in Europe, but we take on board the need for, and the difficulties caused by how those policies interact with, policies for structural reform. We treat the policy mak-ing framework in general, rather than the detail of how different policies might be devised to suit particular circumstances. We use that framework to show how different policy institutions may be allowed to retain different priorities, and hence individual policies that fit together, while also maintaining a degree of flexibility that allows them to deal with problems as they arise. At the same time, policymakers need to remain inde-pendent of external influences (and political pressures in particular) so that their policies will remain consis-tent in the pursuit of the goals that they or society have set for them.
com-12 Fall 2010 EUSA Review
position of expenditures and revenues. Specifically, we suggest public debt targets as a practical way to achieve this and enhance fiscal-monetary co-ordina -tion at the same time without having to compromise the independence of monetary policy. An excessive debt protocol is proposed to give concrete form to this targeting arrangement, and a mechanism is devised to identify the region of stabilisability within which that debt target must be set (and hence the critical limits beyond which debt may not go without precipitating a crisis).
Making these factors explicit components of the new fiscal framework, together with an independent monitoring body, would do a lot to improve the cred-ibility of the Euro area’s fiscal policies, and to reduce risk premia in borrowing costs. Stabilising the stock of debt by fiscal means alone is not always possible however. We therefore also examine the role of “inter-nal devaluations”, or structural reforms, as a means of circumventing those barriers to fiscal stability. This framework provides the analytic support needed to underpin many of the innovations currently under dis-cussion in Brussels.
Andrew Hughes Hallett, George Mason University
Fiscal Discipline is Not Enough to Stabilize the Euro1
Erik Jones
By the time you read this essay, the Task Force headed by European Council President Herman Van Rompuy will have already delivered its recommenda-tions for the reform of European macroeconomic gov-ernance. Most likely, those recommendations will in-clude a mixture of tougher sanctions on countries that run ‘excessive deficits’ on their government balances and flanking measures to keep an eye on national competitiveness as well. The Germans will express disappointment that the regime is not more rigorous; a few of the smaller countries will worry that the sanc-tions will only apply to them; the European Commis-sion will complain that its advice is not given sufficient prominence; and the European Central Bank (ECB) will make known its disappointment that the proce-dures (and sanctions) are not more automatic.
This focus on fiscal discipline is understand -able given what has happened in Greece. The idea that the Germans (and the Slovaks) should have to bail out a Greek government that cannot keep its own house in order is hard to sell to the tabloid press. The prospect that Greece is only one of many governments in need of fiscal support is even worse. Public opinion across the eurozone demands reassurance that this is a once-in-a-lifetime experience and that those respon-sible for this mess will never be able to repeat their mistakes. Contrition on the part of those countries at the heart of the crisis is not enough to satisfy and an-gry electorate; something more must be done.
If the European Council (or the Council of the European Union) chooses to implement the Van Rompuy Task Force’s recommendations, that will rep-resent an improvement over the Stability and Growth Pact. Member States will pay more attention to the im-portance of adhering to fiscal targets (using accepted government accounting standards) and they will have cause to reinvigorate the wider process of multilateral surveillance as well. Nevertheless, if the goal of the reforms is to prevent another crisis like the one we have witnessed over the last year or so, then they will fail. Fiscal discipline is not enough to prevent the emergence and implosion of destabilizing asset bub-bles and the loss of competitiveness in the peripheral countries of the eurozone is only a symptom, not a cause. The Van Rompuy Task Force is well aware of the underlying mechanisms and yet chosen not to
EUSA Review Fall 2010 13 dress them. The stability of the eurozone is likely to
remain much weaker than it should be as a result.
Interest Rate Convergence and Macroeconomic Imbalances
To understand this critique of the likely trajec-tory for European macroeconomic governance reform, it is necessary to start with the phenomenon of inter-est rate convergence that took place just before the creation of Europe’s economic and monetary union (and well before the introduction of the euro). At some point in the mid-to-late 1990s, bond traders in Eu-rope awoke to the realization that there would be only one interest rate prevailing across the eurozone as a whole. The situation prior to EMU was markedly differ-ent. Some countries had relatively high interest rates (Portugal, Greece, Spain, Italy, etc.) while other coun-tries benefited from interest rates that were relatively low (Germany, Austria, Belgium, Netherlands, etc.). Expressed in terms of bond prices the situation was reversed: prices were high where interest rates were low and the other way around. Hence these bond trad-ers saw an opportunity for profit from selling high and buying low – trading some of their holdings of German, Dutch, Austrian or Belgian bonds for cheaper assets in Greece, Portugal, Italy, Spain, and so forth.
Once bond traders began to develop strategies based on this insight, their prophecy of interest-rate convergence was self-fulfilling. As demand increased for the higher interest-rate bonds, the price of these bonds rose from their initially low levels. The reverse was also true, and bond prices fell where interest rates were low (albeit only marginally given the relative size of the different bond markets). A convergence in bond yields or effective interest rates across the two differ-ent countries was the result. This interest rate con-vergence was not a wholly psychological proposition. There had to be some justification to be found in the economic fundamentals for the relative price move-ments to take place. The actions of the bond traders only succeeded in speeding up matters. Once they became convinced about what would happen in the future, their actions created those conditions in the present. The speed of this convergence is evident in one of the data lines presented Figure 1 – the dashed line that shows the standard deviation across ten-year government bond yields in those countries that would constitute to the eurozone (including Greece but ex-cluding Luxembourg). As that standard deviation de-creases, the separate national interest rates come to-gether.
0.00 1.00 2.00 3.00 4.00 5.00 6.00 7.00 8.00 9.00
1991199219931994199519961997199819992000200120022003200420052006200720082009
Stan
dar
d
D
ev
iation
(Per
ce
nt)
[image:13.612.68.534.425.668.2]Year
Figure 1: Interest Rate Convergence and Macroeconomic Imbalances
AMECO Database
Long-term Interest Rates
14 Fall 2010 EUSA Review
The process of interest rate convergence prior to the start of Europe’s economic and monetary union (EMU) is well known. What is less appreciated is what this interest-rate convergence entailed in terms of in-ternational capital flows. As money moved from high price to low price bonds, it crossed international bor-ders as well. Governments that once struggled to meet their borrowing requirements at a reasonable cost benefited from a release of pressure; local banks and industries that saw their activities crowded out – or, better, priced out – by government borrowing, experi-enced a release of pressure as well. This private sec-tor impact came not only from the activity in the bond market but also from the liberalization of international capital markets that ran alongside the creation of the monetary union. Hence the movement of money in the bond market was shadowed by cross-border depos-its and interbank lending in search of a higher yield. All things being equal, the use of credit expanded in those countries where the cost of borrowing fell.
Where money flows, goods follow. The coun -tries that borrowed saw an increase in both consump-tion and investment that drew in imports beyond the pace of any export growth. Hence even where coun-tries continued to hold onto market share in the out-side world, their current account balances plunged into deficit. The experience of lending countries was exactly the opposite. The capital (bond holdings, bank deposits, etc.) that left the typically low interest rate countries like Germany, Austria, Belgium and the Netherlands, put upward pressure on their current ac-counts. With more money being saved than invested in these countries, the relative balance between do-mestic output and dodo-mestic absorption had to be posi-tive. These effects can be seen in Figure 1 as well. The relevant (solid) data line shows the standard de-viation across national current accounts expressed as a percent of gross domestic product (GDP). As this measure increases, national current account positions diverge and the macroeconomic relationship between savings and investment within and across countries moves further out of balance.
Competitiveness
The emergence of increasing macroeconomic imbalances fuelled a heated debate on competitive-ness in Europe. In that debate – which is still very much ongoing – those countries that run surpluses are lauded for their low cost structures; those that run deficits are criticized for their high costs. The point to note, however, is that it was the divergence in current account performance that preceded the debate on competitiveness and not the other way around. Rela-tive cost structures did not cause the convergence
of nominal interest rates in Europe. On the contrary, nominal interest rate convergence took place despite differences in relative cost structures and price infla -tion rates. In turn, it was the capital flows that attended nominal interest rate convergence that caused cur-rent account performance to diverge across countries. Contrary to the rule of thumb used in international eco-nomics, goods markets accommodated; capital mar-kets cleared first.
This is not to say, however, that the competi-tiveness debate is unfounded. Relative cost structures have moved during course of Europe’s economic and monetary union and their movement has reinforced – or, perhaps better, locked in – the wide divergences in current account balances. Countries on the southern periphery of EMU may not have run deficits because of their unfavorable cost structures, but they will find it difficult to close those deficits with the relative cost disadvantages they have developed alongside the de-terioration on their current accounts. The expansion of credit that coincided with the process of nominal interest rate convergence put upward pressure on prices as well as imports. With more governments, firms and individuals borrowing for consumption and investment, the growth in domestic demand necessar-ily outpaced the growth in output (or supply). The in-fluence of this pressure was restrained by the policies of the monetary union. Compared to their own histori-cal performance, inflation in the peripheral countries of the eurozone actually slowed down. Nevertheless, their price inflation was higher than elsewhere – both because capital imports drove prices up on the periph-ery and because net capital exports in Germany and elsewhere drove prices there down.
The distinction I am trying to make here is subtle rather than self-evident and it depends in many ways upon how competitiveness is measured. Econo-mists believe the best measure of competitiveness is found in relative nominal unit labor costs expressed in common currency. If we can assume that the ‘units’ are roughly equivalent from one place to the next, then the cost of labor required to make those units should give us a good indication of where production is likely to be expensive and where it is not. Even if the units are not exactly fungible, the relative movement in cost structures over time should give us a clear indication of which countries are losing competitiveness and which countries are gaining.
The problem is that relative movements in nominal unit labor costs are not directly observable. Instead, they have to be calculated using three differ-ent elemdiffer-ents:
la-EUSA Review Fall 2010 15 bor costs to total output, which is called ‘real’ unit labor
costs because the price movements common to both parts of the ratio cancel out;
* the relative movements in the price deflators for gross domestic product (GDP) so that the ‘units’ of output can be held constant; and,
* the movements in nominal effective exchange rates so that the influence of currency movements can be taken into account.
Each of these observable variables sheds light on a different aspect of the competitiveness story. Movements in real unit labor costs tell us about the relative changes in the distribution of income between capital and labor; movements in GDP price deflators tell us about relative price changes across the econ-omy as a whole; and movements in nominal effective exchange rates tell us about relative currency move-ments across the range of trading partners. By look-ing at these different elements separately, rather than aggregating them altogether into one composite mea-sure of competitiveness, it is easier to get a sense of which aspect is behind any movement in the final ag -gregate and what should be done about it.
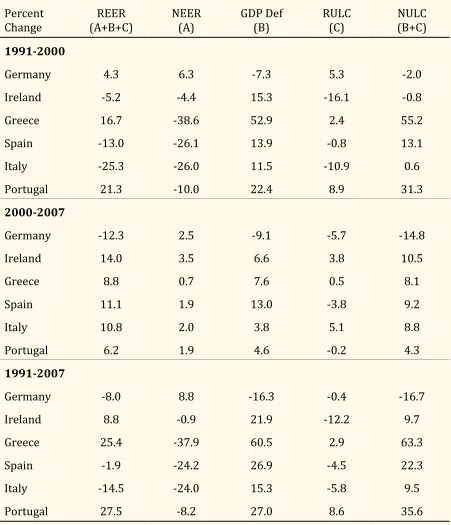
Table 1 illustrates the statistical decomposition of national competitiveness, using data that compares in-country developments with the other first fifteen European Union (EU) member states (EU-15) but excluding tiny Luxembourg. The product of all three observable variables is called the ‘real effective ex-change rate’; ‘nominal unit labor costs’ are calculating by multiplying relative real unit labor costs and relative GDP price deflators. Because the table reproduces log changes over different period, the rates of change are additive rather than multiplicative across the dif-ferent component variables. The periods run from the negotiation of the Maastricht Treaty (1991) to the start of EMU (I use 2000 to split the difference between Greece and everyone else); from the start of EMU to the onset of the global financial crisis (2007); and from the negotiation of the Maastricht Treaty to the onset of the global financial crisis. Again, because the data re -port log differences, the long period is simply the sum of the two shorter ones.
Looking at the first (pre-single currency) pe -riod, Germany, Greece and Portugal lost competi-tiveness through a real appreciation of the real effec-tive exchange rate while Ireland, Spain, and Italy all saw competitiveness improve as their real effective exchange rates appreciated. The point to note, how-ever, is that these movements took place for differ-ent reasons. Germany lost competitiveness primarily because of the rise in real unit labor costs insofar as the appreciation of the nominal effective exchange
rate is more than offset by the relatively slow growth in the GDP price deflator. Greece and Portugal lost competitiveness because relative price inflation more than offset the depreciation of the nominal effective exchange rate; by comparison, relative movements in real unit labor costs only added insult to injury. Among those countries that witnessed competitiveness gains, Ireland is the mirror image of Germany in that move-ments in relative real unit labor costs more than made up for a relative high rate of GDP price inflation. Spain’s competitiveness gains were due wholly to relative movement in nominal effective exchange rates. Italy’s gains where due to a combination of relative nominal depreciation and relative reductions in real unit labor costs.
With the introduction of the single currency, relative movements in the nominal effective exchange rate flatten out and appreciate marginally for those countries within the single currency against those countries that chose to remain outside. Hence any changes in the real effective exchange rate are the result of changes in relative nominal unit labor costs – which is to say either relative GDP price deflators or relative real unit labor costs. For Germany, both vari-ables move in the same direction as price changes slow down relative to everywhere else and as relative wage costs decrease as a proportion of total output. Where German relative real unit labor costs return to their pre-Maastricht position, relative GDP price infla -tion drops even further in the second period than in the first. The other countries all experience an increase in relative nominal unit labor costs due primarily to rela-tively high rates of GDP price inflation – which are con -siderably lower than during the first period (except in Spain) and yet which are still higher than in Germany. Relative real unit labor costs only rise in the two coun-tries where they fell dramatically prior to monetary union (Ireland and Italy) and then only enough partly to offset the competitiveness gains made in the previ-ous period. In Spain, relative real unit labor costs fall in the second period to offset the country’s relatively high rate of inflation.
16 Fall 2010 EUSA Review
1
[image:16.612.78.529.101.626.2]EUSA REVIEW – Fall 2010
Table 1: Competitiveness in the Eurozone
Percent
Change
(A+B+C)
REER
NEER
(A)
GDP Def
(B)
RULC
(C)
NULC
(B+C)
1991-2000
Germany
4.3
6.3
-7.3
5.3
-2.0
Ireland
-5.2
-4.4
15.3
-16.1
-0.8
Greece
16.7
-38.6
52.9
2.4
55.2
Spain
-13.0
-26.1
13.9
-0.8
13.1
Italy
-25.3
-26.0
11.5
-10.9
0.6
Portugal
21.3
-10.0
22.4
8.9
31.3
2000-2007
Germany
-12.3
2.5
-9.1
-5.7
-14.8
Ireland
14.0
3.5
6.6
3.8
10.5
Greece
8.8
0.7
7.6
0.5
8.1
Spain
11.1
1.9
13.0
-3.8
9.2
Italy
10.8
2.0
3.8
5.1
8.8
Portugal
6.2
1.9
4.6
-0.2
4.3
1991-2007
Germany
-8.0
8.8
-16.3
-0.4
-16.7
Ireland
8.8
-0.9
21.9
-12.2
9.7
Greece
25.4
-37.9
60.5
2.9
63.3
Spain
-1.9
-24.2
26.9
-4.5
22.3
Italy
-14.5
-24.0
15.3
-5.8
9.5
Portugal
27.5
-8.2
27.0
8.6
35.6
EUSA Review Fall 2010 17 going to increase and the competitiveness problem
in countries like Ireland, Italy, Greece, Portugal and Spain is only going to get worse. The point to note, however, is that changes in competitiveness are only the symptom of the problem; the capital flows in re -sponse to anticipated interest rate convergence are the cause.
Conclusion
Greater fiscal coordination and reinforced dis -cipline will not stop the capital from flowing across national borders. Even if the governments of the tra-ditional high interest-rate countries like Ireland, Italy, Greece, Portugal, and Spain do not borrow the mon-ey, the banks and businesses in their societies will. This is the lesson from Ireland, Spain and Portugal. Greece is the exception that proves the rule. These other countries suffered from the sovereign debt cri-sis because their private – and not public – borrowers were so heavily exposed. As these borrowers got cut out of international markets, the national governments had to step in to act as domestic lenders of last resort. What started as private indebtedness rapidly became a public concern. One need only look to Ireland to see that a history of fiscal austerity provides insufficient preparation to reconcile the dilemma posed by capital inflows from abroad.
For all that the Van Rompuy Task Force is failing to shore up the single currency, a break up of the monetary union followed by national currency de-preciations would not be the answer either. Without heroic efforts to constrain relative movements in real unit labor costs (like that witnessed in Ireland and Italy during the run-up to monetary union), price inflation would most likely overshoot any improvements in the nominal effective exchange rate (as happened in Por-tugal and Greece) and competitiveness would con-tinue to deteriorate – perhaps even at a faster pace. Meanwhile, the current accounts of the depreciating countries would only return to balance once traders in the bond markets factored in the cost of depreciation on their investments and lost faith in the eventual con-vergence of national interest rates on German norms. In such a situation, current accounts would adjust as capital markets went into a rout. Of course this pros-pect raises the hope that the resulting depreciation would overshoot the subsequent rise in inflation rates – and so trigger relative competitiveness gains – but the pace of adjustment would be brutal and the do-mestic costs profound.
A strong eurozone is still better than the alter-native. The problem with the Van Rompuy Task Force’s proposals is that the euro could be made stronger still. If traditionally export-led growth countries could be
convinced to invest and consume more at home, their banks and other financial institutions would have less interest in sending money in search of higher yields abroad. The cost would be felt in terms of marginally higher rates of inflation but the result would be a more balanced pattern of growth. Greater fiscal discipline would be useful as a flanking policy for such mea -sures. But austerity in the periphery will have little ef-fect operating on its own. This is the lesson from the recent sovereign debt crisis in Europe – but it is admit-tedly a hard lesson to sell to a public opinion that has been shaped by tales of profligate governments and lazy public sector workers. Hence, the more powerful lesson from history appears to be that history is con-demned to repeat itself, if not precisely, then at least enough to rhyme.
Erik Jones, SAIS Bologna Center of the Johns Hopkins University
Notes
1. This assessment is based on a wide range of source
material that I do not cite in this essay due to space con-straints. That should not be taken to mean a lack of intellec-tual indebtedness. On the contrary, my views of have been shaped by a number of prominent writers – Martin Wolf, Vitor Gaspar and Pierre-Olivier Gourinchas chief among them. I have been developing these views over the past two years through a series of articles, book chapters, brief-ing notes and other publications. Rather than provide an extensive bibliography in this essay – which is essentially a long opinion piece – I would refer you to those other works, which can be accessed from my personal website at http:// www.jhubc.it/facultypages/ejones. Please note that all of the data used in this essay is taken from the AMECO database published by the European Commission. The list of relevant data codes and revision dates can be made available upon request.
EUSA members interested in reviewing re-cent EU-related books, please contact the reviews editor:
Dr. Amie Kreppel
Center for European Studies 3324 Turlington Hall PO 117342 University of Florida
Gainesville Florida 32611-7342, USA [email protected]
18 Fall 2010 EUSA Review
EUSA Teaching the EU
Interest Section
Teaching tools in EU studies and Social Networking
Stefania Baroncelli and Roberto Farneti
The emergence of the EU as a new actor in international politics has challenged treasured as-sumptions and frameworks in both academia and policymaking. The EU was considered an entirely new and unique political system. Plus, it did not seem to fit the existing frameworks of either political theory or policy analysis. Institutional ambiguity was consid-ered its most noticeable featured, that made the EU scarcely suitable to the analytical instruments of both canonical political science and other cognate disci-plines such as Law, Economics, and History. Accord-ing to Sergio Fabbrini the EU is a supranational polity with a necessary degree of institutional ambiguity […] Practitioners as well as specialists of the EU ended up considering the EU as a polity without precedent, for the modalities of both its formation and function-ing, in the history of the democratic world” (Fabbrini, p. 203).
Within academia, scholars from different disci-plines have tried hard to create a new space in which the rather distinctive pattern of governance, the politi-cal process, and the institutional actors involved in the EU could be possibly articulated into a coherent dis-course. The challenge consisted in finding a suitable analytical discourse that could help make sense of an allegedly unique political system. EU studies (ES) thrived within this new space, thanks to the coopera-tion among different disciplines. ES straddle boundar-ies and constitute a novel area of interest in which a new, and possibly unique, object could eventually be framed. The novelty and uniqueness of the object, though, challenged not only the cohesion of the disci-plines involved in addressing the academic discourse about the EU but also, and primarily, the teaching of ES.
This article wants to outline briefly the results of a major research project on the current status and actual developments in teaching EU studies. It will offer insights into the major orientations in design-ing teachdesign-ing tools and methods and will survey, very much in outline, the current state of ES across disci-plines. We will first detail the accomplishments of this project, then we will narrow the focus of our atten-tion to our research, a group of teachers and students from the University of Bolzano. We will conclude on a
brief description of case-study, namely, the application of social networks for classroom purposes.
The SENT Network
The “Network of European Studies” (SENT) brought together 66 partners from EU member states, candidate countries, and a number of associate ones. It was an ambitious, far reaching project that aimed to assess the current state of EU studies and review the general perception of EU institutions across Europe.1 The challenge faced by EU educational institutions is how to track and harmonize different curricula, how to facilitate inter-institutional cooperation and mobility schemes, and how to create integrated programs of study, training, and research. The SENT network was designed to meet these challenges and provide EU educators with a workable means of cooperation.
The SENT network was created after the so-called “Bologna Declaration,” a soft-law instrument that enabled policy-makers and national politicians in charge of higher education to harmonize the structure of the different educational systems within the EU, and set up new strategies of cooperation. The network was designed to meet the need of EU educational insti-tutions to track and harmonize different curricula, to facilitate inter-institutional cooperation and mobility schemes, and to create integrated programs of study, training, and research.
The network covered all possible areas in the formats, techniques and methodologies of teaching and learning EU studies, but particular emphasis was laid on innovative teaching tools, notably the use of technology in the classroom, simulations, and social networks.
Another important concern in the mind of the educators involved in teaching ES—a concern that needs to be taken in close consideration in designing new teaching tools—was multilingualism. It has been part of Community policy from the time of the Trea-ties of Rome, and following the Maastricht Treaty in 1992, the promotion of language learning became a corner stone of the EU’s educational policy. Now it is of special importance for the Lisbon Agenda. In 2006, the EU Parliament decided to pursue a comprehen-sive “Framework Strategy for multilingualism“ with suggestions made by a group of experts for language learning and teaching and bi- and multilingual univer-sities in Europe are experiencing a constant growth and strengthening. Such a reconfiguration of the Eu -ropean educational scenario opens up a whole area of investigation as regards language pedagogy issues and the relationship between which discipline is taught and what languages are used.
EUSA Review Fall 2010 19 vocation of the European Union in eliminating
physi-cal and intellectual barriers among countries, would strengthen the assumption that EU studies distin-guish themselves for being based on multilingualism, intercultural and interdisciplinary approaches. Such hypothesis would be consonant with the new learn-ing concepts, which are based, inter alia, on informal skills. If this assumption were true EU studies could be considered as an entirely new paradigm for teaching in European higher Education.
In the following we shall present first, very much in outline, the main orientations and trends in in-novative teaching tools in ES and introduce the activi-ties and achievements of one particular group within the SENT network, the “Bolzano group.”
The Bolzano group
SENT’s double mission was to survey and evaluate existing methods and practices in teaching and learning ES and to envision new methods and tools for teaching EU institutions. So, the project had a descriptive component (surveying the state of the art) and a normative one, tightly related with one another. The goal of the SENT was not so much to design new teaching pattern but rather pick out and highlight valu-able experiences across countries and disciplines that could be disseminated and made accessible in other academic contexts. Simulation games, project teach-ing, virtual teaching units, distance based learning and the use of social networks have been used spasmodi-cally within the composite field of ES. Furthermore, having ES developed across countries with distinct and specific educational systems and mores, the SENT offered a valuable opportunity to explore the ad-vantages and the main challenges posed by distance learning compared to traditional teaching methods. Problem-Based Learning (PBL) is a student-centered approach in which students collaboratively solve prob-lems in small groups with the help of a tutor. The use of simulations, especially in political science curricula has proved to be particularly effective, and a project named the Trans-Atlantic Consortium for European Union Studies & Simulations (TACEUSS) is support-ing developments in teachsupport-ing patterns that foster the use of simulations.
Within the broader framework of the SENT net-work, the “Bolzano group” has aimed to identify the most significant and innovative teaching tools (at the University level) and to pin down the “special status” of EU studies compared with other subjects.2 The Bolzano group has mapped and reviewed EU studies across a number of disciplines (e.g. Economics, Law, Political Science, History and Social & Cultural Stud-ies) by means of an on-line questionnaire sent to more
than 2000 University professors committed to teach-ing ES all over Europe taken from the various disci-plines (political science and international relations, law, economics, history, and cultural studies), we tried to ascertain whether this assumption were true.3 Re-spondents (professors of EU studies across the dis-ciplines) were asked to provide general information about the course and give specific answers concerning the methods and approaches in EU studies. In order to verify how the different teaching methods followed different patterns in different countries we developed several hypotheses which helped us analyse data and disclose regional biases. The objective was to deter-mine (among other things) which teaching methods were most popular with respect to discipline and coun-try; whether there is a correlation between the use of language and the discipline, and whether (and to what extent) the syllabi cut across different disciplines.
Admittedly, the elements of novelty and inno-vation were critical to the project of finding for ES a specific domain and rationale. It is, again, the novelty and uniqueness of the institution addressed by ES that demands a new approach in the classroom. The simple re-use of tested teaching tools in new contexts would hardly generate fresh knowledge on EU insti-tutions. What is at stake is indeed the creation of a discourse, within negotiable disciplinary boundaries, that could assist the teacher in framing the EU. In a way, the objective of the Bolzano group, and the SENT network as a whole, was to avoid, or possibly redress, biases produced by the use of frameworks and cat-egories that were foreign to the facts to which they were brought to bear. It was, in other words, the use of American handbooks of Political Science that gener-ated biases and distortions that often reverbergener-ated in the classroom.
Using Facebook in class
One of the accomplishments of the Bolzano group was the bringing of social networks (such as Face-book or Twitter) to bear on the teaching. Our interest in this kind of tools picks up on the experience with discussion forums illustrated in Robert H. Trudeau, “Get Them to Read, Get Them to Talk: Using Discus-sion Forums to Enhance Student Learning” Journal of Political Science Education 1 (2005).