Int. J. Electrochem. Sci., 13 (2018) 265 – 274, doi: 10.20964/2018.01.34
International Journal of
ELECTROCHEMICAL
SCIENCE
www.electrochemsci.orgShort Communication
Enhanced Performance of TiO
2/
α
-Fe
2O
3Nanostructure as
Anode Material for Lithium-ion Batteries
Qi Cheng1, Cheng Liu1, Kun Meng1*, XiaohuaYu1*, YannanZhang1, Jianxiong Liu1, Xin Jin 2, Liying Jin 3
1
National Engineering Research Center for solid waste, Kunming University of Science and Technology, Kunming 650093;
2
Shanxi Enginerring Vocational College, Taiyuan 030009;
3
Shandong Institute of Physical Education and Sports, Jinan 250102
*
E-mail: mengkun010@163.com; xiaohua_y@163.com;
Received: 22 August 2017 / Accepted: 26 October 2017 / Online Published: 1 December 2017
A novel lithium-ion anode material α-Fe2O3/TiO2 is prepared by two-step hydrothermal method with
pure titanium sheet, NaOH, and FeCl3 solution. The nanocomposite material has been fully
characterized by SEM, TEM EDX and XRD. The electrochemical performance of α-Fe2O3/TiO2
nanocomposite as anode material in lithium ion batteries (LIB) are measured by battery test system and electrochemical workstation. The results demonstrate that the α-Fe2O3/TiO2 nanocomposite is
consisted of TiO2 sheets and Fe2O3 particles on the surface. The electrode exhibits excellent
electrochemical performance with capacity retention of 638 mAh/g after 30 cycles at 33.5 mA/g.
Keywords: Lithium ion batteries; TiO2 nano sheets; hydrothermal method; α-Fe2O3;
1. INTRODUCTION
Due to its high energy density and long cycle life, rechargeable lithium-ion batteries (LIBs) have attracted more attention in the past few decades and widely used in automobiles, electric vehicles and energy storage [1,2]. However, with the rapid development of other emerging industries, the capacity and cycle performance of lithium-ion batteries can not meet the actual needs [3,4]. The research shows that the lithium-ion anode material restricts the specific capacity and cycle performance. It is one of the hottest topics in lithium-batteries research [5,6].
Metal oxide has many virtues such as high specific capacity, non-toxic, easy to synthesis and low processing cost. It is considered as an ideal anode material for new generation lithium ion batteries[7,8]. On the one hand, it is generally accepted that TiO2 based anode materials have low
foreground is attractive [9]. On the other hand, the theoretical capacity of transition metal oxide Fe2O3
as high as 1005 mAh/g. Gao et al [10] conducted the research on α-Fe2O3 anode material and found
that the specific capacity remained at about 710 mAh/g. However, with cycle number increase, micro structure is prone to damage during working process, which lead to sharp capacity degradation [11,12]. Hence, we put forward a strategy of novel lithium-ion batteries anode materials with high specific capacity and good cycle stability. In this work, surface modification of TiO2 materials with
α-Fe2O3 was proposed. Because the surface area of TiO2 material has a significant influence on the
intercalation and removal of lithium ion, hydrothermal method was used to prepare TiO2 nano
precursor with high surface area. The surface morphology and composition of the sample were analyzed by scanning electron microscopy (SEM), energy dispersive spectroscopy (EDS) and transmission electron microscopy (TEM). The phase composition of the sample was studied by X ray diffraction (XRD). The electrochemical impedance performance and electrode performance of lithium batteries of the sample were investigated using a battery test system and an electrochemical workstation.
2. MATERIALS AND METHODS
2.1 Material preparations
The pure titanium sheet (Sumitomo Group, Japan, chemical composition shown in Table 1) was cut into size 30 mm × 80 mm×1 mm and then placed in acetone, absolute ethanol and distilled water for 15 min each with ultrasonic vibration. The titanium sheet was chemically polished to remove the oxide film in the mixed solution of HF, HNO3 and H2O (volume ratio 1:1:8), then washed by
distilled water and put in a dry oven.
Table 1. The chemical composition of pure titanium (mass percent %)
O N C H Fe Si Ti
0.15 0.05 0.05 <0.015 <0.30 <0.15 other
The titanium sheet and NaOH solutions (1 mol/L, 80 ml) were placed in a teflon-lined autoclave (100 ml) and treated at 180oC for 12 h to obtain a TiO2 nanostructure. That is the first
hydrothermal reaction. The resultant precipitation at the bottom was added to a mixture of FeCl3 (0.15
mol/L, 20 ml) and NaNO3 (1 mol/L, 20 ml). Then the mixture was carried on the second hydrothermal
reaction in teflon-lined autoclave at 100oC for 2.5 h. The products were collected by centrifugation, washed with deionized water for 3 times and then dried in vacuum oven at 80oC for 24 h. Finally, the as-collected products were annealed in a tube furnace at 400oC at a rate of 3oC/ min.
2.2 Material characterizations
20 S-TWIN). The phase composition of the sample was analyzed by X ray diffraction (XRD, D8 ADVANCE) with Cu Kα 1486.6 eV, λ = 0.15406 nm, operating voltage was 30 kV and the current is 30 mA. XRD peaks were collected from 20o to 80o with a step size of 0.5o.
2.3 Electrochemical characterization
CR2025 coin-type cells were assembled in an argon-filled glove box (America, Innovative Technology, O2 <1 ppm, H2O<1 ppm). The anode electrode was prepared by mixing the Li4Ti5O12
powder, carbon black and polyvinylidenefluoride with a weight ratio of 8:1:1 in N-methyl pyrrolidinone. The mixture was pasted on pure Cu foil and dried under vacuum at 60oC for 12 h. A piece offlesh lithium metal was used as the counter electrode. Celgard 2400 membrane was used as the separator and 1 M LiPF6 solution in DMC/EC/DEC (1:1:1 in volume) was used as the electrolyte. The electrochemical characterization was carried out by galvanostatic cycling under 33.5 mA/g current densities between 0 and 3 V using a battery testing system (CT-3008 5V 10 mA, Neware). The cyclic voltammetry and electrochemical impedance spectrum (EIS) was conducted using a CHI 760E(China, Shanghai Chenhua ltd.) electrochemical workstation at room temperature.
3. RESULTS AND DISCUSSION
3.1 Morphology analysis
The microstructure of anode materials is directly related to the intercalation and deintercalation of lithium ions, which has a great influence on the electrical properties of lithium-ion batteries. Many scholars believe that with the increase of the anode materials surface area, the electrode performance in lithium batteries becomes better [13-16]. Fig. 1a presents the image of SEM and TEM of sample after one step hydrothermal reaction. Fig.1b shows SEM of sample after two-step hydrothermal reaction. As can be seen from these figures, the micromorphology of anode materials has also changed greatly with different hydrothermal times.
In Fig.1a, The product is in layered shape. Each layer is about 5 μm in size and about 20 nm in thickness. As can be seen from the local magnification, there are nanowires near the layer. Further amplification observation shows that nanowire (possibly TiO2 nanotube) has a width of 2-3 nm and a
length of 150 nm. To summarize, the layer is formed by interweaving of substantial nanowires in three-dimensional space. It can also induce a bird's nest shape nanostructure with the aid of mechanical external force [17-20]. The nanostructured material has a large specific surface area, because each nanotube is exposed [21-24].
In Fig. 1b, there are small particles with large fluctuations, and the particles are spherical, uniform in size and well distributed. The pores in the product are still a lot. As measured by a ruler, the size of each spherical particle is within the range of 30-130 nm. The specific surface area of nanosheet was increased by surface modification of α-Fe2O3. Similar morphology was also noted in Wang’s
Figure 1. The image of SEM and TEM (a) one step hydrothermal reaction, (b) two-step hydrothermal reaction
Fig. 2 is the EDS micro elemental analysis diagram at the marked points in Fig. 1b. The main elements in the diagram are Fe, Ti, and O elements. Therefore, it can be preliminarily concluded that the α-Fe2O3 nanocomposite with TiO2 matrix is formed.
0 1 2 3 4 5 6 7 8 9 10
Elements O Ti Fe At% 49.99 42.38 7.63
O
Inte
n
sity /
a.u
.
Energy / keV Ti
O Fe
Ti
Ti Fe
[image:4.596.174.423.366.558.2]Fe
Figure 2. Micro component of sample after two-step hydrothermal reaction
3.2 phase composition analysis
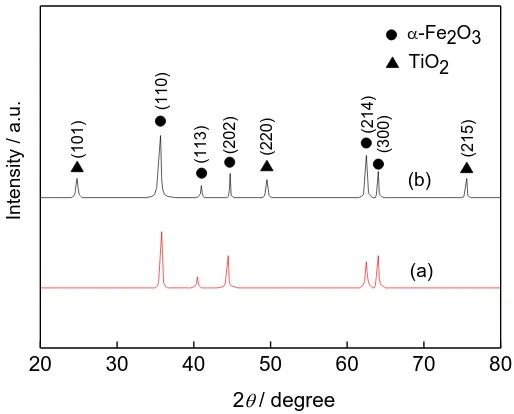
X-ray diffraction (XRD) measurements were conducted to determine the crystal structures of the nanostructures, which had been synthesized. The XRD spectra of supernatant (a) and precipitate (b) of the two-step hydrothermal products after annealing are given in Fig. 3. The XRD pattern of the pristine Fe2O3 nanorods exhibited four peaks at 2θ=36°, 43.5°, 62.4°and 63.9° assigned to the (110),
(202), (214), and (300) reflections, respectively, of α-Fe2O3 with lattice constants: a=0.504 nm and
reflection peaks at 2θ=48.1° and 75.2° assigned to (200) and (215) reflections, respectively, of body-centered tetragonal-structured anatase TiO2 with lattice constants: a=0.3777 nm and c=0.9501 nm
(JCPDS no.89-4921). All of the reflection peaks were indexed to the planes of α-Fe2O3 and TiO2,
suggesting that the synthesized nanoparticles are highly pure nanocomposite of them.
20 30 40 50 60 70 80
Int ens it y / a. u.
2/ degree
(b) (a) (1 0 1 ) (1 1 0 ) (1 1 3 ) (2 0 2 )
-Fe2O3
[image:5.596.169.426.142.349.2]TiO2 (2 2 0 ) (2 1 4 ) (3 0 0 ) (2 1 5 )
Figure 3. XRD patterns of samples after two-step hydrothermal reaction 3.3 Electrochemical performance
0 50 100 150 200
0.0 0.5 1.0 1.5 2.0 2.5 3.0 5th 2nd 2nd 1st 5th V ol tag e / V
Capacity / mAh.g-1
1st (a)
0 200 400 600 800 1000
0.0 0.5 1.0 1.5 2.0 2.5 3.0
5th 2nd 1st 5th 2nd
Volt
age
/
V
[image:5.596.86.514.421.578.2]Capacity / mAh.g-1 1st (b)
Figure 4. The discharge-charge curves at 0.1 C current density (a) TiO2 (b) α-Fe2O3/TiO2
Fig. 4 shows the charge and discharge curves for the first five times of the TiO2 nanostructure
and the α-Fe2O3/TiO2 nanocomposite with a voltage range of 0~3 V. Due to the presence of iron
oxides, the α-Fe2O3/TiO2 sample exhibits high initial discharge and charge capacities of 881 mAh/g;
whereas the bare TiO2 nanostructure can only deliver nearly one-third of the values (Fig. 4a). The
of α-Fe2O3/TiO2 nanocomposite has been greatly improved. In addition, the discharge process of
α-Fe2O3/TiO2 nanocomposite is gentler than that of TiO2 nanostructure. There are two discharge
platforms in the discharge curve, which means that the surface modification of TiO2 nanostructure can
effectively improve the electrical properties.
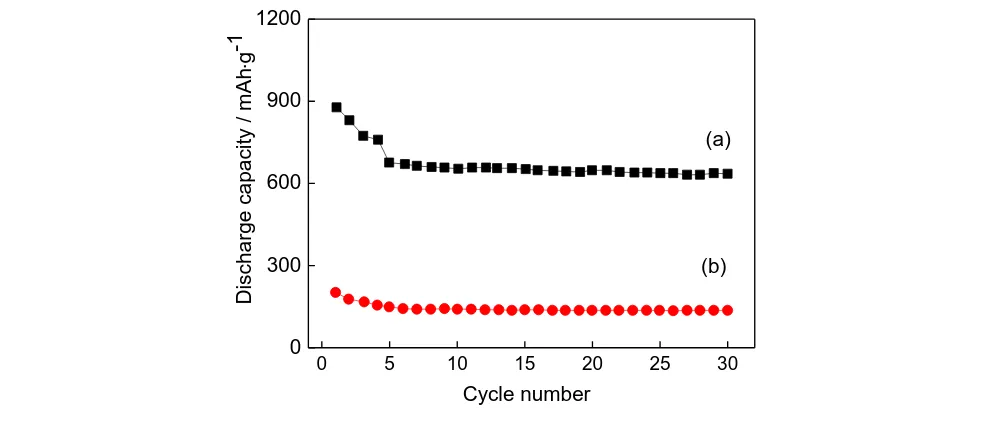
Fig. 5 shows the 30 times discharge cycling performance test curves of the pure TiO2
nanostructure and the α-Fe2O3/TiO2 nanocomposite at 0.1C. The residual capacity of the pure TiO2
nanostructure is 136 mAh/g, and irreversible capacity loss is 31%. While the residual capacity of the α-Fe2O3/TiO2 nanocomposite is 638 mAh/g, and the irreversible capacity loss is 27%. That is, the cyclic
stability of the α-Fe2O3/TiO2 nanocomposite is higher than the cyclic stability of the pure TiO2
nanostructure. In consideration of large volume change of metallic oxide during charge and discharge, this result is superior to most reported TiO2-based 3D electrodes[27,28].
0 5 10 15 20 25 30
0 300 600 900 1200
(b)
Discharge ca
pacity / mAh
. g
-1
Cycle number
(a)
Figure 5. The cycle performance test curve (a) TiO2, (b) α-Fe2O3/TiO2
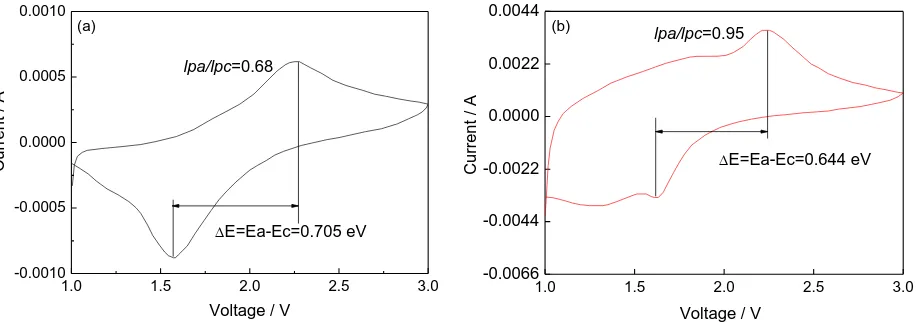
Generally , excellent electrode materials has a reversible oxidation reduction reaction in lithium batteries [29,30]. In our present work, the degree and reversibility of redox reaction on the electrode surface were measured by cyclic voltammetry, and the electrochemical performance of the electrode was characterized. Fig. 6 shows the cyclic voltammetry curves for TiO2 nanostructure and
α-Fe2O3/TiO2 nanocomposite. The two samples have similar redox peaks, and this process also
corresponds to the intercalation and deintercalation process of lithium ions.
Table 2 summarizes some recent studies of TiO2/metal oxide hybrids as anodes for lithium-ion
batteries. The specific capacity of our α-Fe2O3/TiO2 is higher than those reported values for
TiO2@metal oxide hybrids at similar current densities. Besides, our TiO2/Fe2O3 hybrid also exhibit
small particle size and good cycling stability. The α-Fe2O3/TiO2 electrode exhibits large reversible
capacity as well as good cycling stability and rate performance, which can be attributed to its unique hierarchical architecture and synergistic effects between the constituents of the composite. First, TiO2
nanosheet can build up a stable 3D scaffold for the growth of Fe2O3 which can deliver large capacity
[image:6.596.50.550.267.483.2]
most previous studies of anatase TiO2, second only to TiO2-B nanowire@α-Fe2O3. As TiO2-B has a
more open structure than anatase TiO2, TiO2-B nanowire@α-Fe2O3 shown in ref [1] delivers large
capacity up to 709 mAh/g. Second, the smallest particle in our design could facilitate the electrolyte penetration by providing a large reaction surface area and more active sites for electrochemical reactions, which facilitates fast charge transport at high current densities. Last, the small dimensions and the hollow interiors of the Fe2O3 not only provide short Li+ ion diffusion paths, but also improve
[image:7.596.42.552.251.458.2]sufficient structural stability to withstand the large volume change associated with Li insertion/extraction.
Table 2. List of recent studies of TiO2/metal oxides as anodes for lithium ion batteries
morphology crystallite size current rate (mA g−1)
cycles number
reversible capacity (mA·hg−1)
ref TiO2-B nanowire
@α-Fe2O3 100 -200 nm 100 50 709 [15]
sandwich-like Co3O4/TiO2
20-40 μm 100 120 660 [31]
TiO2@Fe2O3
Core-Shell around 100 nm 100 100 520 [32]
TiO2@MnO2 around 81 nm 335 100 350 [33]
TiO2@Fe2O3
nanotube about 100 nm 100 100 617 [34]
TiO2/α-Fe2O3 30-130 nm 33.5 30 638
This work
In Fig. 6a, the highest point is about 2.27 V, and the peak value generated by oxidation is corresponding to the prolapse process of lithium ions (the charging process), while the lowest point is about 1.57 V, which corresponds to the intercalation process of lithium ions (the discharge process). The peak value of the oxidation peak is basically symmetrical with the peak value of the reduction peak, and the integral area is approximately equal, indicating that the oxidation and reduction are basically consistent during charging and discharging. In Fig. 6b, the highest point is about 2.25 V, the lowest point is about 1.61 V, and the peak values of both are essentially symmetrical.
In addition, the oxidation peak current value (Ipa) and the reduction peak current value (Ipc) are
often compared to reflect the reversibility of lithium-ion batteries. If the ratio of them is more closer to one, the reversibility of the material in charging and discharging is better[35]. According to the curve, the Ipa/Ipc=0.68 of pure TiO2 nanostructure and the Ipa/Ipc =0.98 of α-Fe2O3/TiO2 nanocomposite are
calculated, which shows that the coating modification is helpful to the improvement of the cycle performance. Moreover, the difference between the oxidation peak and the reduction peak of pure TiO2 nanostructure is 0.705 V, which is slightly higher than that of α-Fe2O3/TiO2 nanocomposite. This
also shows that the α-Fe2O3/TiO2 nanocomposite has less polarization effect on the electrolyte, and the
1.0 1.5 2.0 2.5 3.0
-0.0010 -0.0005 0.0000 0.0005 0.0010
Current / A
Voltage / V
lpa/lpc=0.68
E=Ea-Ec=0.705 eV
(a)
1.0 1.5 2.0 2.5 3.0
-0.0066 -0.0044 -0.0022 0.0000 0.0022 0.0044
E=Ea-Ec=0.644 eV
C
ur
rent
/
A
Voltage / V
lpa/lpc=0.95
(b)
Figure 6. Cyclic voltammetry curves of samples after two-step hydrothermal reaction. (a) pure TiO2
(b) α-Fe2O3/TiO2
Electrochemical impedance measurement (EIS) is one of the important methods to characterize the charge diffusion and propagation resistance of a battery. It can effectively reflect the magnitude of the resistance of the battery. Electrochemical impedance diagram can be divided into two parts. The first part is the high frequency region, the shape of which is basically semicircle. The second part is low frequency area, and its shape is basically a diagonal shape[36]. The high frequency region mainly represents the resistance of the electrode surface charge transfer, and the low frequency region mainly represents the Warburg resistance of lithium ions in the electrode. The smaller the radius of the high frequency zone, the smaller the resistance, and the smaller the slope of the low frequency region is, the smaller the resistance[37].
0 100 200 300 400 500
0 100 200 300 400 500
(b) pure TiO2
a-Fe2O3/TiO2
-Z'
' / Ohm
Z' / Ohm
[image:8.596.71.529.78.239.2](a)
Figure 7. Electrochemical impedance curves of samples after two step hydrothermal reaction (a) pure TiO2 (b) α-Fe2O3/TiO2
Fig. 7 shows the electrochemical impedance curves of pure TiO2 nanostructure and
[image:8.596.167.437.466.665.2]
TiO2 nanostructure in the high frequency region is less than the radius of α-Fe2O3/TiO2
nanocomposite; 2) the slope of line in low-frequency region of pure TiO2 nanostructure is also smaller
than that of α-Fe2O3/TiO2 nanocomposite in the low frequency region. That means α-Fe2O3/TiO2
nanocomposite exhibits larger Li-ion diffusion rate than pure TiO2 nanostructure[38-39].
4. CONCLUSIONS
1) TiO2 nanostructure and α-Fe2O3/TiO2 nanocomposite were successfully prepared by the
two-step hydrothermal reaction. TiO2 nanostructure is formed by interweaving a large number of nanowires
in three-dimensional space, and there are a lot of small particles on α-Fe2O3/TiO2 nanocomposite. The
specific surface area increased.
2) the α-Fe2O3/TiO2 sample exhibits favarable initial discharge and charge capacities of 881
mAh/g; whereas the bare TiO2 nanostructure can only deliver nearly one-third of the values.
3) In comparison with the TiO2 nanostructure sample, The difference between the oxidation
peak and the reduction peak of theα-Fe2O3/TiO2 nanocomposite is smaller, and the impedance of the
modified material in the high frequency region and the low frequency region are both decreased. ACKNOWLEDGEMENTS
This work was supported financially by the National Nature Science Foundation of China (grant Nos. 51665022 and 51601081).
References
1. J.M. Liu, Y.J. Zhang, P. Dong, X. Li and S.B. Xia, J. Chin. Ceram. Soc., 7 (2016) 4.
2. G.F. Ortiz, I. Hanzu, P. Lavela, P. Knauth, J.L. Tirado and T. Djenizian, Chem. Mater., 22 (2010) 1926.
3. J. Chen, L. Xu, W. Li and X. Gou, Adv. Mater., 17 (2005) 582.
4. M. D. Ye, X.K. Xin, C.J. Lin and Z.Q. Lin, Nano Lett., 11 (2011) 3214.
5. I.A.J. Gordon, S. Grugeon, H. Takenouti, B.Tribollet, M. Armand, C. Davoisne, A. Débart and S. Laruelle, Electrochim. Acta., 223 (2017) 63.
6. J.Y. Li, Q. Xu, G. Li, Y.X. Yin, L.J. Wan and Y.G. Guo, Mater. Chem. Front., 1 (2017) 1691. 7. T.C. Jiang, F.X. Bu, X.X. Feng, I. Shakir, G.L Hao and Y.X. Xu, Acs. Nano., 11 (2017) 5140. 8. A.A. Abdelhamid, Y. Yu, J. Yang and J.Y. Ying, Adv. Mater., 29 (2017) 1701427.
9. M.X. Jing, J.Q. Li, C. Han, S.S. Yao, J. Zhang, H.A. Zhai, L.L. Chen, X.Q. Shen and K.S. Xiao, Roy. Soc. Open. Sci., 4 (2017) 170323.
10. L. Zhang, G. Zhang, H.B. Wu, L. Yu and X.W. Lou, Adv. Mater., 25 (2013) 2589. 11. J. Chen, L. Xu, W. Li and X. Gou, Adv. Mater., 17 (2005) 582.
12. C.Z. Wu, P. Yin, X. Zhu, C.Z. Ouyang and Y. Xie, J. Phys. Chem. B, 110 (2006) 17806. 13. X.H. Yu and Z. L. Zhan, Nanoscale Res. Lett. 9 (2015) 516.
14. J. Wei, J.X. Liu, Z.Y. Wu, Z.L. Zhan, J. Shi and K. Xu, J. Nanosci. Nanotechnol., 15 (2015) 5013. 15. X. Wang, J. Rong, Y. M. Song, X. H. Yu, Z. L. Zhan, J. S. Deng, Physics Letters A, 381 (2017)
2845.
16. X.H. Yu, J. Rong, Z.L. Zhan, Z. Liu, J.X. Liu, Mater. Design. 83 (2015) 159. 17. J. Jannik and J. Maier, Cheminform, 5 (2003) 5215.
19. C. Liu, J. Rong, Y.N. Zhang, X.H. Yu, J.X. Liu and Z.L. Zhan, Int. J. Electrochem. Sci., 12 (2017) 9914.
20. T. Song, J.L. Xia, J.H. Lee, D.H. Lee, M.S. Kwon, J.M. Choi, J. Wu, S.K. Doo, H. Chang, W.I. Park, D.S. Zang, H.S. Kim, Y.G. Huang, K.C. Hwang, J.A. Rogers and U. Paik, Nano Lett., 10 (2010) 1710.
21. P. Poizot, S. Laruelle, S. Grugeon, L. Dupont and J.M. Tarascon, Nature, 407 (2000) 496. 22. T. Ohzuku, S. Takeda and M. Iwanaga, J. Power Sources, 81 (1999) 90.
23. S.Y. Huang, L. Kavan, I. Exnar and M. Grätzel, J. Electrochem. Soc., 142 (1995) L142. 24. W.S. Zhi, W.Y. Li, J.J. Cha, G.Y. Zheng, Y. Yang, M.T. Mcdowell, P.C. Hsu and Y. Cui, Nat
Commun., 4 (2013) 1331.
25. H.G. Wang, D.L. Ma, X.L. Huang, Y. Huang and X.B. Zhang, Sci Rep-Uk., 2 (2012) 701. 26. L. Yu, Z.Y. Wang, L. Zhang, H.B. Wu and X.W. Lou, J. Mater. Chem. A, 1 (2013) 122.
27. J.S. Luo, X.H. Xia, Y.S. Luo, C. Guan, J.L. Liu, X.Y. Qi, C.F. Ng, T. Yu, H. Zhang and H.J. Fan, Adv. Energy Mater., 3 (2013) 737.
28. Y. Piao, J. Kim, H. Bin Na, D. Kim, J.S. Baek, M.K. Ko, J.H. Lee, M. Shokouhimehr and T. Hyeon, Nat. Mater., 7 (2008) 242.
29. G.F. Ortiz, I. Hanzu, T. Djenizian, P. Lavela, J.L. Tirado and P. Knauth, Chem. Mater., 21 (2009) 63.
30. L.G. Xue, Z. Wei, R.S. Li, J.L. Liu, T. Huang and A.S. Yu, J. Mater. Chem., 21 (2011) 3216. 31. W.T. Li, K.N. Shang, Y.M. Liu, Y.F. Zhu, R.H. Zheng, L.Z. Zhao, Y.W. Wu, L. Li, Y.H. Chu,
J.H. Liang and G. Liu, Electrochim. Acta, 174 (2015) 985.
32. Y. Zhong, Y.F. Ma, Q.B. Guo, J.Q. Liu, Y.D. Wang, M. Yang and H. Xia, Sci Rep., 7 (2017) 40927.
33. J.Y. Liao, D. Higgins, G. Lui, V. Chabot, X. Xiao and Z. Chen, Nano Lett., 13 (2013) 5467. 34. N. Liu, J. Shen and D. Liu, Electrochim. Acta, 97 (2013) 271.
35. Y.F. Shi, B.K. Guo, S.A. Corr, Q.H. Shi, Y.S. Hu, K.R. Heier, L.Q. Chen, R. Seshadri and G.D. Stucky, Nano Lett., 9 (2009) 4215.
36. S. Laruelle, S. Grugeon, P. Poizot, M. Dolle, L. Dupont and J.M. Tarascon, J. Electrochem. Soc., 149 (2002) A627.
37. K.Y. Xie, Z.G. Lu, H.T. Huang, W. Lu, Y.Q. Lai, J. Li, L.M. Zhou and Y.X. Liu, J. Mater. Chem., 22 (2012) 5560.
38. H.B. Wu, J. S. Chen, X.W. Lou and H.H. Hng, Nanoscale, 2011, 3, 4082. 39. Z.Y. Wang and X.W. Lou, Adv. Mater., 24 (2012) 4124.