International Journal of
ELECTROCHEMICAL
SCIENCE
www.electrochemsci.org
The Improvement for the Electrochemical Performances of
LiNi
1/3Co
1/3Mn
1/3O
2Cathode Materials for Lithium-ion Batteries
by both the Al-doping and an Advanced Synthetic Method
Zhu-Yuan Li, Hai-Lang Zhang*
School of Chemical and Material Engineering, Jiangnan University, Wuxi 214122, Jiangsu, China
*E-mail: ZHL8868@vip.163.com
Received: 6 January 2019/ Accepted: 14 February 2019 / Published: 10 March 2019
The Al-doped LiNi1/3Mn1/3Co1/3-xAlxO2(x=0, 0.01, 0.03, 0.05) cathode materials have been
successfully synthesized via a simple template-sacrificial method with MnO2 as the sacrificial
template. The structure and properties of the as-obtained samples were measured by XRD, SEM and electrochemical test methods. Though the Al-doped samples delivered lower initial capacities, the rate performance and the cycling stability were dramatically enhanced. By Al-doping and an advanced synthetic route, the LiNi1/3Co1/3Mn1/3O2 cathode materials have been improved. The doped material
(x=0.03) has the most excellent electrochemical performances. It delivers an initial discharge capacity of 197.6 mAh g-1 at 0.1 C in the voltage of 2.5-4.6 V, and has a capacity retention of 96.4% after 50cycles at 0.2 C.
Keywords: Lithium-ion battery; cathode materials; Al doping; LiNi1/3Co1/3Mn1/3O2;
template-sacrificial method
1. INTRODUCTION
In recent years, lithium-ion batteries (LIBs) with high energy density, long cycle life and environmental friendliness have been widely used to portable electronic devices and hybrid electric vehicles [1-2]. Cathode materials are one major limiting factor in determining the electrochemical performance of LIBs. Among the commercialized cathode materials, LiCO2 is the most successful for
portable electronic devices. However, for LiCO2, its low specific capacity (140 mAh g-1) and high cost
limit the application of LIBs [3]. Since LiNi1/3Co1/3Mn1/3O2 was developed in 2011 by Ohzuku [4], it
has gradually attracted widespread attention because it has many advantages . LiNi1/3Co1/3Mn1/3O2 has
Nevertheless, LiNi1/3Co1/3Mn1/3O2 suffers from low rate capability and poor cyclic performance
due to cation mixing caused by the similar ionic radius of Li+ (0.076 nm) and Ni2+ (0.069 nm)[5-6]. To
solve these issues, many attempts have been made to decrease the cation mixing and to strengthen the material structure[7-10], such as metal-ion doping[11-14] and surface modification[15-16]. Li [17] reported that Na+ doped in LiNi1/3Co1/3Mn1/3O2 on the Li+ sites could suppress Li+/Ni2+ cation mixing
and stabilize the LiNi1/3Co1/3Mn1/3O2 layer structure. Liu [18] studied the impact of the Al and La
co-substitutions on LiCO2 and the doped LiCO2 can achieve 96% capacity retention after 50 cycles.
Among many doping elements, Al-doping strategies were frequently applied for the enhancement of electrochemical performances of cathode materials [19-20].
Recently, some researchers have found that template sacrificial method is an effective strategy to obtain materials with controlled morphology[21-23]. Fang [24] prepared hollow peanut-like hierarchical mesoporous LiNi1/3Mn1/3Co1/3O2 by a simple self-template solid-state method, which
presented superior capacities and rate performances. Their results give a clear evidence that hollow architecture is beneficial to superior electrochemical performance of cathode materials. However, these researchers have only used this method to synthesize pristine LiNi1/3Mn1/3Co1/3O2 cathode materials,
and no Al-doping modification has been found in literatures by template sacrificial method. In this work, a simple template-sacrificial method has been used for doping Al into the LiNi1/3Mn1/3Co1/3O2. It
is our hope that the property of LiNi1/3Mn1/3Co1/3O2 cathode material would be improved a lot of by
the synergetic effects of Al doping and an advanced synthetic route.
2. EXPERIMENTAL
2.1 Materials synthesis
First, porous fluffy MnO2 was synthesized by referring to a thermal oxidation method [25]. In
brief, 1 mmol MnSO4 and 10 mmol NH4HCO3 was separately dissolved in 150 mL DI water,
respectively. Then, the NH4HCO3 solution was added into the MnSO4 solution under continuous
stirring. After stirring for 3 h, MnCO3 microspheres were obtained after centrifugal separation and
being washed with DI water and ethanol for several times. After being dried at 60 °C, the MnCO3
microspheres were sintered at 400 °C for 5 h in air to obtain the porous fluffy MnO2.
The LiNi1/3Mn1/3Co1/3-xAlxO2 ( x=0, 0.01, 0.03, 0.05 ) cathode materials were synthesized by a
template-sacrificial method. Stoichiometric amounts of MnO2, Ni(NO3)2·6H2O, Co(NO3)2·6H2O,
LiOH·H2O, Al(NO3)2·9H2O were added to ethanol to form a suspension. Stirring at 80 °C until the
ethanol had evaporated completely. Finally, the mixture was preheated at 500 °C for 6 h and sintered at 850 °C for 12 h in air. The prepared LiNi1/3Mn1/3Co1/3-xAlxO2 (x=0, 0.01, 0.03, 0.05) cathode materials
were labeled as Al-0, Al-1, Al-3, Al-5, respectively.
2.2 Structure Characterization
materials. The XRD data were collected in 2θ range of 10° to 90°. The morphology of the samples was analyzed by scanning electron microscope (SEM, S4800, Hitachi).
2.3 Electrochemical measurements
The electrochemical performances of as-prepared materials were measured by CR2032 type coin cells, which consist of a lithium metal anode and cathode separated by Celgard 2325 separator. The cathode electrodes were prepared by mixing active material (80 wt.%), acetylene back (12 wt.%) and polyvinylidenefluoride (PVDF, 8 wt.%) in N-methylpyrrolidone (NMP), then the mixture-slurry was coated onto Al foil with a Doctor blade technique and dried at 80 °C for 12 h in a vacuum oven. The electrolyte used was a 1M LiPF6 dissolved in ethylene carbonate (EC) with dimethyl carbonate
(DMC) and diethyl carbonate (DEC) (1:1:1 by volume). The coin cells were assembled in an Ar-filled dry glove box(SUPER 1220/750, made in Shanghai, China), and were galvanostatically charged/discharged at different rates (1 C = 180 mAh g-1) in the voltage range of 2.5-4.6V (vs. Li+ / Li) on a Land battery tester (Wuhan, China). In addition, the cyclic voltammetry (CV) and electrochemical impedance spectroscopy (EIS) of coin cells were conducted by an electrochemical work station (IM6, Germany).The CV was recorded between 2-4.8 V at a scan rate of 0.1 mV s-1. The EIS measurements
were performed over frequency range from 0.01 Hz to 100k Hz with an amplitude of 5 mV.
3. RESULTS AND DISCUSSION
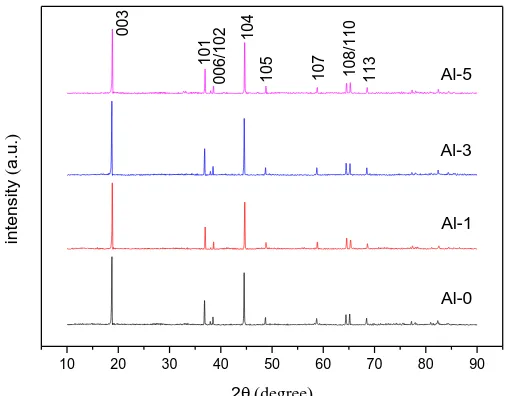
XRD patterns of the samples are shown in Fig. 1. All samples were indexed to the layered structure of α-NaFeO2 with R-3m space group. There are some clear splits of (006) / (102) and (108) /
(110) peaks of the samples, which indicates the formation of layered structure. Moreover, no other mixed phase appears, indicating that Al has been successfully into the crystal lattice[26]. The refined lattice parameters calculated by Jade6 software for these samples are shown in Table 1. The lattice parameters a and V decrease as the amount of Al-doping increases, which is due to the fact that the ionic radius of Al3+ (0.051 nm) is smaller than that of Co3+ (0.063nm), and the smaller lattice volume for Al-doped cathode material means the shorter Li+ channel[27]. In addition, the bond association
energy of Al-O (512 KJ mol-1) is stronger than that of Co-O (368 KJ mol-1)[28]. So the Al-doped cathode material should have a more stable structure. Also the bond lengths become shorter and the electron density is shifting more towards the metal ions, and the repulsion of oxygen atoms decreases due to the lower electron density in the oxygen orbitals, which lead to the decrease of c [29]. The higher dissociation energy could also improve the structural stability. As we know, the ratio of c/a is a value for measuring the degree of layered structure of cathode materials [30]. The c/a ratios of all samples are higher than 4.9, and c/a ratio for the 0 samples is lower than that for 1, 3 and Al-5 samples, respectively, which indicates that the samples with Al-doping have better hexagonal structure. The values of I(003)/ I(104) can reflect the degree the Li+ / Ni2+ cation mixing. When the
a lower Li+/Ni2+ cation mixing[31]. As shown in Table 1, the values for all samples are larger than 1.2, suggesting the lower degree of Li+ / Ni2+ cation mixing, and the Al-3 sample exhibits the lowest Li+ /
Ni2+ cation mixing.
10 20 30 40 50 60 70 80 90
113
10
8/1
10
107
105
104
00
6/1
02
101
Al-5
Al-3
Al-1
inte
nsity
(
a.u
.
)
2(degree)
Al-0
[image:4.596.163.416.143.341.2]003
Figure 1.XRD patterns of the Al-0, Al-1, Al-3, Al-5 samples.
Table 1. Refined lattice parameters of Al-0, Al-1, Al-3, Al-5 samples.
Sample a(Å) c(Å) c/a I003/I104 V(Å3)
Al-0 2.8606 14.2220 4.9710 1.3021 100.88
Al-1 2.8590 14.2167 4.9726 1.3142 100.68
Al-3 2.8573 14.2142 4.9747 1.3427 100.46
Al-5 2.8548 14.1961 4.9727 1.3211 100.19
The morphology and microstructure of MnO2 hollow microspheres are shown in Fig.2 (a, b).
The MnO2 microspheres can be observed clearly. Meanwhile, a small amount of broken hollow
hemisphere of MnO2 can be clearly observed, which confirms that hollow spherical microstructures of
MnO2 have been synthesized successfully. Fig.2(c-f) shows the SEM images for the Al-0, Al-1, Al-3,
Al-5 samples, respectively. As it can be seen, the morphology of samples is controlled by using MnO2
[image:4.596.81.511.408.482.2]Figure 2. SEM images for (a-b) MnO2, (c) Al-0, (d) Al-1, (e) Al-3, (f)Al-5.
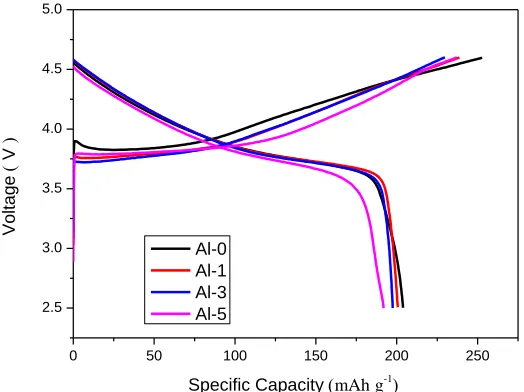
The typical initial charge / discharge curves at 0.1 C for different samples are shown in Fig. 3. The initial discharge capacities for Al-0, Al-1, Al-3 and Al-5 samples are 203.9 mAh g-1, 200.7 mAh g
-1, 197.6 mAh g-1 and 192 mAh g-1 at 0.1C between 2.5-4.6 V, respectively. It is obvious that Al-0
sample shows higher initial discharge specific capacity than Al-doped samples. The electrochemical reactions and lithium intercalation-deintercalation mechanism in LiNi1/3Co1/3Mn1/3O2 cathode material
are attributed to the Ni2+ / Ni4+ and Co3+ / Co4+ redox couples[32]. Thus, the slight decrease of initial discharge capacity for a Al-doped sample should be ascribed to decrease of active Co3+ ions.
(b ) (a
)
(c )
(f) (e
)
0 50 100 150 200 250 2.5
3.0 3.5 4.0 4.5 5.0
Al-0 Al-1 Al-3 Al-5
Voltag
e
(
V
)
Specific Capacity (mAhg-1)
Figure 3. Initial charge / discharge curves of Al-0, Al-1, Al-3, Al-5 samples at 0.1 C in the voltage range of 2.5-4.6 V.
By a hydrothermally-assisted co-precipitation method, Zhang[2] synthesized the LiNi1/3Co1/3Mn1/3O2 cathode material, which could give an initial discharge capacity of 193.5 mAh g-1
at 0.1 C between 2.7-4.5 V. Xiong [21] synthesized the LiNi1/3Co1/3Mn1/3O2 cathode material by
the similar method as ours. The material had an initial discharge capacity of 187 mAh g-1 at 0.2 C between 2.5-4.4 V. Cao[2] has succeeded in the synthesis of the LiNi1/3Co1/3Mn1/3O2 cathode
material by the similar method as that in this paper. The material had an initial discharge capacity of 212 mAh g-1 at 0.1 C between 2.5-4.5 V. A nano LiNi1/3Co1/3Mn1/3O2 cathode material has been
synthesized by Chen[23] using the similar method as that in our work. The material had an initial discharge capacity of 207.7 mAh g-1 at 0.1 C between 2.5-4.5 V. So it is not difficult to speculate that the LiNi1/3Co1/3Mn1/3O2 cathode material by our synthesis is also good.
[image:6.596.169.431.71.267.2]0 10 20 30 40 50 60 80 100 120 140 160 180 200 220 0.1C 5C 1C 0.5C 0.2C Capa city ( mAh g -1 ) Cycle Number Al-0 Al-1 Al-3 Al-5 0.1C
(a)
Figure 4. (a) The rate performance, (b) the cycle performance of Al-0, Al-1, Al-3, Al-5 samples in the voltage range of 2.5-4.6 V.
The cycling performances of the samples at 0.2 C over the voltage range of 2.5-4.6 V are shown in Fig. 4(b). As shown in Fig. 4(b), the discharge capacities of the samples decrease gradually with cycling. The initial discharge capacity for Al-0 sample is 196.1 mAh g-1, and the capacity only
retains at 175.7 mAh g-1 after 50 cycles with retention of 89.6%. The initial discharge capacities for Al-1, Al-3 and Al-5 samples are 191.9 mAh g-1, 192 mAh g-1 and 185.5 mAh g-1, respectively. After
50 cycles, the discharge capacities are 180.4 mAh g-1,185 mAh g-1 and 173.5 mAh g-1 with retentions of 94%, 96.4% and 93.5%, respectively. These results mean that the Al-doped samples have better cycling performance and rate performances. The reasons may be: (1) The decrease in lattice parameters a, c and V allows the Li+ intercalation/deintercalation through a shorter channel; (2) Al-O
with stronger bond energy can improve the structure stability during cycling; (3) An appropriate amount of Al doping can suppress Li+ / Ni2+ cation mixing.
The cyclic voltammetry (CV) at the fifth cycle and the fiftieth cycle for the Al-0 and Al-3 at the scan rate of 0.1 mV s-1 in the voltage range of 2.0-4.8 V are shown in Fig.5. Two oxidation peaks were observed around 4.0 V and 4.6 V on the charge curve, which are ascribed to the oxidation of Ni2+ / Ni4+ and Co3+ / Co4+, the corresponding reduction peaks (Ni4+ / Ni2+, Co4+ / Co3+) are located at around
3.6 V and 4.5 V[33], respectively. The main cathodic peak potential (Epc, Ni2+ / Ni4+), anodic peak
potential (Epa, Ni4+ / Ni2+) and the corresponding potential difference (ΔEp=Epc- Epa) are revealed in
Table 2. Comparing with the Al-0 sample, the Al-3 sample exhibits the lower oxidation peak potential and higher reduction peak potential. As we know, the large corresponding potential difference indicates higher degree of electrode polarization and capacity fading[34]. The ΔEp for Al-3 is quite
smaller than that for Al-0, which suggesting that Al-3 has the lowest irreversible capacity and smallest electrochemical polarization.
2.0 2.5 3.0 3.5 4.0 4.5 5.0 -0.002
-0.001 0.000 0.001 0.002 0.003
0.004
(a)
Cu
rrent
(
A
)
Voltage (V)
Al-0 Al-3
2.0 2.5 3.0 3.5 4.0 4.5 5.0 -0.001
0.000 0.001 0.002 0.003
(b)
Cu
rrent
(
A
)
Voltage (V)
Al-0 Al-3
[image:8.596.161.435.204.592.2]Figure 5. CV curves for the fifth cycle (a) and the fiftieth cycle (b)of Al-0, Al-3 samplesat the scan rate of 0.1 mV s-1in the voltage range of 2.0-4.8 V.
Table 2. The anodic peak potential (Epa), cathodic peak potential (Epc) and the corresponding potential
difference (ΔEp) obtained from CV curves
Samples 5st 50th
Epc (V) Epa(V) ΔEp(V) Epc (V) Epa(V) ΔEp(V)
Al-0 4.078 3.579 0.499 4.106 3.579 0.527
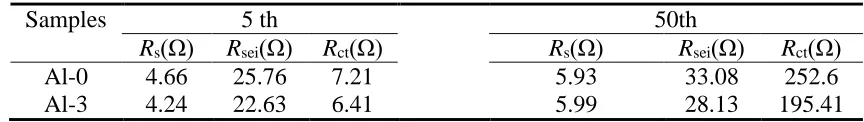
[image:8.596.85.514.680.741.2]Fig. 6 (a, b) compares the EIS profiles of Al-0 and Al-3 after 5 and 50 cycles at 0.2 C. As shown in Fig. 6 (a), both the two plots contain a semicircle in the high frequency, a semicircle in mid-low frequency and a straight line in the mid-low frequency, corresponding to the impedance for a solid electrolyte interface layer (Rsei), the surface charge transfer resistance (Rct) and the resistance of Li+
diffusion in the crystal lattice.
0 10 20 30 40 50 60 70 0
10 20 30 40
(a)
(
ohm
)
(ohm) Al-0
Al-3
0 50 100 150 200 250 300 350 0
40 80 120 160 200
(b)
(
ohm
)
(ohm) Al-0
[image:9.596.170.427.172.567.2]Al-3
Figure 6. Nyquist plots of Al-0, Al-3 samplesafter5 (a) and 50 (b) cycles. Inset: Equivalent circuit.
The intercept of the high frequency region and the Z' axis is mainly electrolyte resistance (Rs)
[35]. The Rs, Rsei and Rct values of Al-0 and Al-3 were roughly similar after 5 cycles, however, the Rct
value of Al-0 was much higher than that of Al-3 after 50 cycles. Impedance parameters calculated based on equivalent circuit were shown in Table 3. The Rct value of Al-0 increases from 7.21 Ω after
first cycle to 252.6 Ω after 50 cycles. Nevertheless, the Rct value of Al-3 is enlarged from 6.41 Ω to
195.41 Ω after 50 cycles. All above results demonstrate that Al-doped LiNi1/3Co1/3Mn1/3O2 cathode
Table 3. Impedance parameters calculated based on equivalent circuit
Samples 5 th 50th
Rs(Ω) Rsei(Ω) Rct(Ω) Rs(Ω) Rsei(Ω) Rct(Ω)
Al-0 4.66 25.76 7.21 5.93 33.08 252.6
Al-3 4.24 22.63 6.41 5.99 28.13 195.41
4. CONCLUSION
In this work, LiNi1/3Mn1/3Co1/3-xAlxO2 ( x=0, 0.01, 0.03, 0.05 ) cathode materials were
successfully prepared by a simple template-sacrificial method. The effects of Al doping on the crystal structure, morphology and electrochemical performance for LiNi1/3Mn1/3Co1/3O2 were systematically
studied. The Al-doped cathode materials present excellent rate performance and the specific reversible capacity as compared to the LiNi1/3Mn1/3Co1/3O2. These results give a clear evidence that Al doping
can not only suppress Li+ / Ni2+ cation mixing, but also can stable the layer structure of LiNi1/3Mn1/3Co1/3O2 cathode materials. Again it has been verified that the template-sacrificial method
is an advanced synthetic method and could be applied to metal doping for LiNi1/3Mn1/3Co1/3O2 cathode
materials.
References
1. W. He, X. Li, J. Chen, F. Peng, R. Zhang, Y. .Liu, Z. Xiao, Mater. Chem. Phys., 155 (2015) 9. 2. R. Zhang, L. Huang, W. Li, J. Liao, P. Zeng, X. Zhang, Y. Chen, Int. J. Electrochem. Sci., 13 (2018)
2248.
3. P. He, H. Yu, D. Li, H. Zhou, J. Mater. Chem., 22 (2012) 3680. 4. T. Ohzuku, Y. Makimura, Chem. Lett., 30 (2001) 642.
5. R. Santhanam, B. Rambabu, J. Power Sources, 195 (2010) 4313.
6. C. Lv, J. Yang, Y. Peng, X. Duan, J. Ma, Q. Li, T. Wang, Electrochim. Acta, 297 (2019) 258. 7. G. Sun, X. Yin, W. Yang, J. Zhang, Q. Du, Z. Ma, Z. Wang, Electrochim. Acta, 272 (2018) 11. 8. X. Jia, M. Yan, Z. Zhou, X. Chen, C. Yao, D. Li, D. Chen, Y. Chen, Electrochim. Acta ,254 (2017)
50.
9. K. S. Ganesh, P. J. Kumar, O. M. Hussain, J. Electroanal. Chem., 828 (2018) 71. 10. S. Liu, Z. Dang, D. Liu, C. Zhang, T. Huang, A. Yu, J. Power Sources,396 (2018) 288.
11. L. Xue, Y. Li, B. Xu, Y. Chen, G. Cao, J. Li, S. Deng, Y. Chen, J. Chen, J. Alloys Compd., 748 (2018) 561.
12. C. Gong, W. Lv, L. Qu, O. Bankole, G. Li, R. Zhang, L. Lei, J. Power Sources, 247(2014) 151. 13. Z. Hu, L. Wang, Y. Luo, Q. Wei, M. Yan, L. Zhou, L. Mai, Sci. Adv. Today, 1(2015) 25218. 14. X. Hu, H. J. Guo, W. Peng, Z. Wang, X. Li, Q. Hu, J. Electroanal. Chem., 822 (2018) 57.
15. D. Lv, L. Wang, P. Hu, Z. Sun, Z. Chen, Q. Zhang, A. Chang, Electrochim. Acta, 247 (2017) 803. 16. Q. Jiang, P. Lang, J. Li, J. Tang, J. Alloys Compd., 742 (2018) 549.
17. Y. Li, J. Liu, Y. Lei, C. Lai, Q. Xu, J. Mater. Sci., 52 (2017) 13596.
18. Q. Liu, X. Su, D. Lei, Y. Qin, J. Wen, F. Guo, Y.M. Wu, Y. Rong, X. Xiao, F. Aguesse, J. Bareño, Y. Ren, W. Lu, Y. Li, Nat. Energy ,(2018) https://doi.org/10.1038/s41560-018-0180-6.
20. T. Lei, Y. Li, Q. Su, G. Cao, W. Li, Y. Chen, S. Deng, Ceram. Int., 44 (2018) 8809. 21. W. Xiong, Y. Jiang, Z. Yang, D. Li, Y. Huang, J. Alloys Compd., 589 (2014) 615. 22. J. Li, C. Cao, X. Xu, Y. Zhu, R. Yao,,J. Mater. Chem., A1(2013) 11848.
23. Z. Chen, J. Wang, D. Chao, T. Baikie, L. Bai, S. Chen, Y. Zhao, T. Sum, J. Lin, Z. Shen, Sci. Rep., 6 (2016) 25771.
24. Y. Fang, Y. Huang, W. Tong, Y. Cai, X. Wang, Y. Guo, D. Jia, J. Zong, J. Alloys Compd.,743 (2018) 707.
25. L. Zhou, D. Zhao, X. Lou, Angew. Chem., 124 (2012) 243.
26. Y. Zhang, Z. Wang, J. Lei, F. Li, J. Wu, X. Zhang, K. Ke, Ceram. Int., 41 (2015) 9069. 27. D. Wang, X. Li, Z. Wang, H. Guo, Y. Xu, Y. Fan, J. Ru, Electrochim. Acta, 188 (2016) 48. 28. T. Tang, H. L. Zhang, Electrochim.Acta, 191 (2016) 263.
29. M. Eilers-Rethwisch, M. Winter, F. Schappacher, J. Power Sources, 387 (2018) 101. 30. G. Hu, M. Zhang, L. Liang, Z. Peng, K. Du, Y. Cao, Electrochim. Acta, 190 (2016) 264. 31. M. Tian, X. Li, Z. Shao, F. Shen, Int. J. Electrochem. Sci., 12 (2017) 7166.
32. P. Cabelguen, D. Peralta, M. Cugnet, P. Maillet, J. Power Sources, 346 (2017) 13.
33. J. Baboo, H. Park, J. Song, S. Kim, J. Jo, D. Pham, J. Kim, Electrochim. Acta ,224 (2017) 243. 34. Q. Jiang, N. Chen, D. Liu, S.Wang, H. Zhang, Nanoscale ,8 (2016) 11234.