ON A UNIFORM COLOUR SPACE
Philip Keith Robertson
April 1985
A thesis submitted for the degree of Doctor of Philosophy
at the Australian National University
the work presented in this thesis is my own original work.
faf
I am grateful and indebted to my principal supervisor, Dr. J. F. O’Callaghan, for his initial suggestions for this work, and his guidance and encouragement throughout its course.
I would also like to thank my co-supervisor Prof. R. P. Brent, and advisor Dr. R. A. Jarvis, for their comments and advice at various stages.
Particular thanks are also due to Dr. D. Fraser for giving assistance and advice in many discussions during the course of this work, and to Dr. T. R. J. Bossomaier for his comments on specific aspects of it.
This work was performed using the equipment and facilities of the CSIRO Division of Computing Research (now CSIRONET). I would like to thank Dr. P. J. Claringbold, Chief of the Division, for making these facilities available, and Prof. R. P. Brent, of the ANU Computer Science Department, for supporting the joint arrangement.
I would also like to express my appreciation of discussions with, and help at various times from, those associated with the Image Systems Section of the Division: Ian Briggs, Pam Cohen, Duncan Stevenson, Garth Tier, and Murray Wilson. I also benefitted from discussions with Richard Juday (NASA) early in this work.
Abstract
This thesis develops a comprehensive approach to the use of colour in the display of digital image data. The approach incorporates as a primary consideration the principle that a display should exploit the normal scene analysing capabilities of the human visual system to achieve intuitive appreciation of the spatial variations of image data variables. It is realised within a computationally tractable framework; central to this framework is a perceptually uniform colour space which can be addressed in terms of perceptual attributes hue, saturation and lightness.
The development of this approach arises from the shortcomings of conventional colour display techniques for representing various types of image data, including multivariate statistical data, remotely sensed multi-spectral data, data of an arbitrary nature which may be in a form not normally observed visually, and integrations of such data types. This work rationalises conventional and ad-hoc display methods, using considerations of the operation of the human visual system to develop a display approach which encompasses these types of data. It draws from the areas of colour science, visual perception, and computer vision.
The display approach is based first, on achieving an appropriate structural representation for the data; second, on representing it in terms of appropriate perceptually significant spectral attributes; and third, on performing appropriate enhancements based on specific mechanistic knowledge of the visual pathway.
Perceptual attribute representations are also used for displaying general informative data variables, derived from remotely sensed multi-spectral data, and from statistical data. Such representations are shown to result in data displays more intuitively interpretable than those produced using conventional or ad-hoc spectral assignment methods. The use of a colour space whose metric reflects perceived colour differences also allows the proportional representation of numerical data steps by perceived gradations in colour.
The third stage of the approach is realised by deriving a representation of achromatic and chromatic opponent visual channels within uniform colour space. Considerations of the detrimental effects of the different spatial resolutions of the achromatic and chromatic visual mechanisms at high spatial frequencies lead to a suggestion for low-pass filtering chromatic information. Such filtering can be performed on the chromatic channel representation in uniform colour space; these channels also form a perceptual domain for performing other image enhancements.
It is shown that overall, use of the developed display approach can result in a substantial improvement over conventional display methods, both in high level scene comprehension of complex composite images, and in lower level spectral interpretation of imagery. The use of perceptual specification for data representations, and the increased control over the colour product resulting, can add significantly to the level of appreciation
Table of Contents
L ist o f illu stra tio n s ... x
L ist o f t a b l e s ... xii
C h a p te r 1 In tro d u c tio n ... 1
1.1 The problem of displaying image data in c o lo u r... 1
1.2 Approach taken to the problem - contribution of this w o r k ... 3
1.3 Organisation of the th e s is ... 6
C h a p te r 2 Im age com prehension and i n t e r p r e t a t i o n ... 8
2.1 The human visual system ... 8
2.1.1 The visual pathway - mechanistic interconnections and processes... 9
2.1.2 Visual perception of colour - spectral perceptual attributes ... 11
2.1.3 Structural scene comprehension... 15
2.2 Visual system models and their use in colour image processing ... 16
2.2.1 Visual models - their constraints and limitations ... 16
2.2.2 The use of visual models and considerations in colour Image processing . . 20
- Spatial-frequency dependent processing based on specific mechanistic models ... 20
- Representation of data by perceptually significant attributes ... 20
- Proportional representation of data differences by perceived colour differences ... 21
- Structural representations... 21
2.3 Overall requirements for image display - approach taken in this work ... 22
2.3.1 Relevance of visual system operation to the display of information in c o lo u r ... 22
2.3.2 Structural scene comprehension requirements ... 25
2.3.3 Realisation of spectral perceptual attrib u tes... 25
2.3.4 Enhancements and compensations based on mechanistic know ledge... 26
2.4 S u m m a ry ... 27
C h a p te r 3 D evelopm ent o f a fram ew o rk fo r im age display ... 28
3.1 Basic form of the framework ... 28
3.2 Perceptual colour space central to the framework ... 32
3.2.1 Requirements of a perceptual colour s p a c e ... 32
3.2.2 Colour spaces dependent on display devices or processes ... 33
3.2.3 Colour spaces based on models of the human visual system ... 37
3.2.4 Colour spaces based on empirical measurements ... 38
3.2.5 Choice of a perceptual colour s p a c e ... 40
3.3 Spatial and spectral processing within the fram ew ork... 42
3.3.1 Transformations dependent on spatial representation ... 42
3.3.2 Transformations dependent on visual system properties ... 43
3.4 Realisation of the framework ... 45
3.4.1 Realising specified colours on display devices - device m o d e llin g ... 45
3.4.2 Modelling a colour television monitor ... 48
3.4.4 Comparison between CIELUV colour monitor and
CIELAB film/print gamuts ... 62
3.5 Summary ... 64
Chapter 4
The generation of colour sequences for univariate and
bivariate m aps... 65
4.1 The problem of colouring statistical m a p s ... 65
4.2 Generating colour sequences in uniform colour s p a c e ... 67
4.2.1 Univariate sequences ... 67
4.2.2 Bivariate sequences ... 80
4.3 Discussion and evaluation... 86
4.3.1 Uniformity and sequence element separation - the influence of in d u c tio n ... 86
4.3.2 Limitations on the independence and use of perceptual attrib u tes... 87
4.4 Conclusions ... 90
Chapter 5
Colour representation of remotely sensed
reflected radiation
... 915.1 Remotely sensed reflected radiation - the general display p ro b le m ... 91
5.1.1 Data types and sensing sy stem s... 91
5.1.2 The inherent depiction of image spatial stru c tu re ... 92
5.1.3 Depiction of surface covering - the problem of spectral assignment ... 93
5.2 Mapping from data to colour space ... 94
5.2.1 Generation of informative data variables... 94
5.2.2 Representation of informative data v ariab les... 94
5.2.3 Mapping informative data variables into uniform colour sp ac e ... 95
- Mapping constraints - the dimensionality and distributions of real data s e ts ... 96
- One-dimensional c a s e ... 97
- Two-dimensional case ... 98
- Three-dimensional c a s e ... 99
5.2.4 Derivation of the required m a p p in g ...100
5.3 Application to real data s e t s ... 104
5.3.1 Representation of model-based physical variables in uniform colour s p a c e ...104
5.3.2 Representation of statistically decorrelated imagery - chromatic contrast enhancement ... 112
5.4 Discussion ...120
5.4.1 Application of techniques to remotely sensed data sets not derived from reflected ra d ia tio n ...120
5.4.2 Treatment of saturated pixels ...122
5.4.3 Noise considerations ... 126
C h a p te r 6 S y n th esis of scenes w ith im plied sp atial
3 -dim ensionality ...129
6.1 The problem of displaying composite images of data variables with dissimilar spatial s tru c tu re s ...129
6.2 Realistic depiction of a coloured su rfa c e ... 131
6.2.1 Surface depiction - reflectance m o d e l... 133
6.2.2 Surface colouring - pigmentation model ... 139
6.3 Modelling an overlaid tra n sp aren c y ...145
6.3.1 Ideal transparency m o d e l... 145
6.3.2 Non-ideal transparency m o d e l...149
6.4 Application to real data sets and discussion of models ... 149
6.4.1 The effects of data smoothness on surface d epiction... 150
6.4.2 Reflectance model - influence of scene parameters on the local and global comprehension of each data variable... 158
- Roles of ambient, diffuse and specular reflected co m p o n en ts... 159
- Effects of height emphasis and illumination angle on topography d e p ic tio n ... 159
- Effects of surface micro-roughness and specular distribution shape . . . 162
- Subsequent suitability of materials for surface simulation ...163
6.4.3 Surface colour pigmentation model ...164
- Effects of pigmentation model on surface property d e p ictio n ...164
- Colour gamut considerations... 165
- Control over pigmentation c o lo u rs ...167
6.4.4 Application of surface representation to non-topographic data variables . . 168
6.4.5 Overlaid transparency m o d e l... 169
- Model parameter requirements for data depiction ... 169
- Achieving the impression of transparency - perceptual considerations...170
- Representation of additional variables - graphic overlay ... 171
6.4.6 Limitations and possible extensions of m o d e ls ... 172
- Data smoothness requirements ...172
- Dangers of misrepresentation due to processing a rtifa c ts... 172
- Potential for enhancing realism by extending models ... 173
6.5 Conclusions ... 174
C h a p te r 7 T he effects o f high sp atial freq u en cies on perceived c o l o u r ...176
7.1 Colour and spatial-frequency dependence of contrast sensitivity... 176
7.1.1 Colour-opponent channels and their spatial frequency characteristics . . . . 176
7.1.2 Image processing techniques based on the opponent channel spatial frequency characteristics... 179
7.1.3 Representation of opponent level signals within the display framework . . . 180
7.2 The effects of differential achromatic/chromatic contrast sensitivities on image interpretation ...181
7.2.1 The achromatic appearance of high frequency chromatic gratings ...181
7.3 Subjective experiments within the framework to investigate
high frequency effects ... 184
7.3.1 Investigation of the achromatic appearance of chromatic gratings of high spatial frequency ...184
7.3.2 The use of test gratings to investigate interference effects ...186
7.3.3 Effects of differential contrast sensitivity on real imagery ...187
7.4 Minimising the detrimental effects of differential contrast sensitivities -discussion on appropriate techniques ...188
7.5 Summary ... 189
C h a p te r 8 C onclusions, ... 191
8.1 The effectiveness of the developed approach ... 191
8.2 L im itatio n s... 195
8.3 Directions for future work ... 197
A p p e n d ic e s ... 199
Appendix 1 The Specification and measurement of colour ...199
A 1.1 The specification of colour ... 199
A 1.2 The measurement of c o lo u r... 202
Appendix 2 Analytical formulations of the CIELAB and CIELUV uniform colour spaces ...203
Appendix 3 Summary of developed software ... 204
List of illustrations
2.1 Schematic of the proposed display a p p ro a c h ... 24
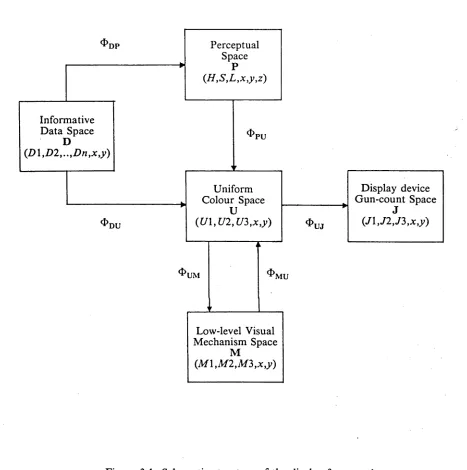
3.1 Schematic structure of the display fram ew o rk ... 31
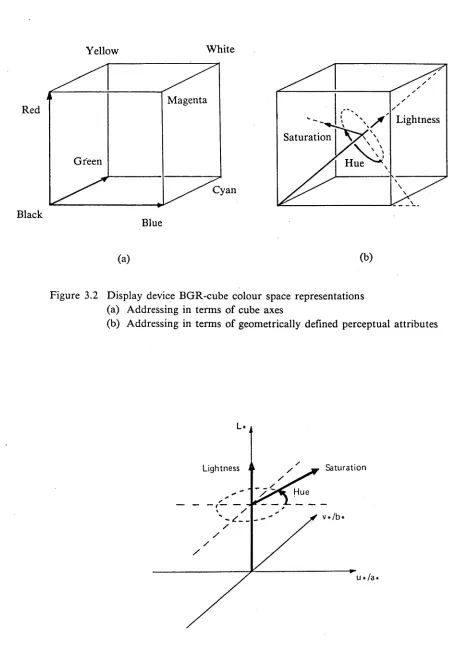
3.2 Display device BGR-cube colour space representations... 34
3.3 UCS representation of perceptual attributes hue, saturation and lightness . . . . 34
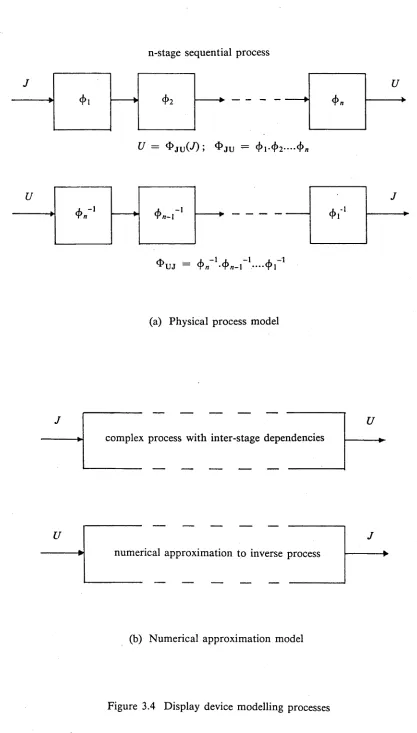
3.4 Display device modelling processes ... 46
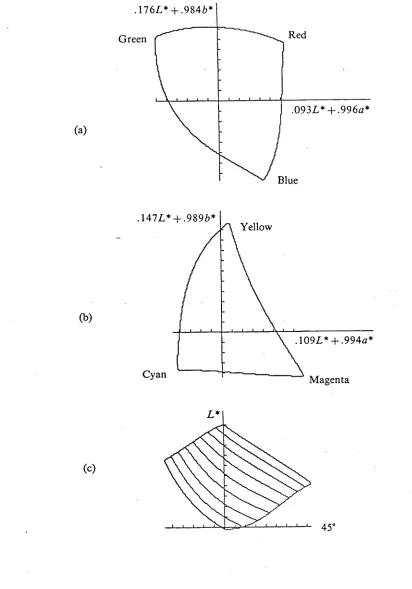
3.5 Outlines of constant-hue and constant-lightness cross-sections through the colour television monitor UCS gamut ... 51
3.6 Outlines of cross-sections through the device-primary and device-complementary colours in the colour television monitor UCS gamut . . . 52
3.7 Outlines of constant-hue and constant-lightness cross-sections through the colour television monitor UCS gamut ... 57
3.8 Outlines of cross-sections through the device-primary and device-complementary colours in the colour film/print UCS gamut . ... 58
3.9 Colour plate: cross-sections through the colour film/print UCS g a m u t... 61
3.10 Outlines of superimposed cross-sections through the colour film/print and colour television monitor UCS g a m u ts ... 63
4.1 Colour plate: univariate map colouring schemes - examples of legends and m a p s ... 70
4.2 Colour plate: bivariate map colouring schemes - examples of legends and m a p s ... 71
4.3 Univariate sequence paths through constant-hue gamut cross-sections ... 72
4.4 Saturation limits of univariate sequence paths in constant-lightness gamut cross-sections ... 76
4.5 Graphical projection of gamut saturation limits for univariate sequence specification... 77
4.6 Poorly-chosen univariate sequence paths in the colour monitor gamut ... 77
4.7 Schematic of a bivariate legend in a constant-hue plane ... 81
4.8 Schematic of a bivariate legend in a vertical cylindrical s e c tio n ... 83
4.9 Schematic of a bivariate legend in a vertical spiralled cylindrical sectio n... 83
4.10 Schematic of a bivariate legend in an expanding vertical cylindrical section . . . 83
4.11 Schematic of a bivariate legend in a vertical double-conic (one inverted) sec tio n ... 83
5.2 Colour plate: Broken Hill temporal sequences - informative data variables mapped in UCS for interpretations of gradations in data property
upper images : cover/greenness images
lower images : cover/change-in-cover images ...109 5.3 Colour plate: (upper images) Broken Hill Landsat subscene - chromatic
expansion of correlated data with low dynamic range by mapping principal
components orthogonally in UCS ... 110 5.3 Colour plate: (lower images) Broken Hill radiometric data - proportional
data variables mapped in UCS for maximal chromatic c o n tra s t... 110 5.4 Colour plate: Simpson Desert mosaic - chromatic expansion of correlated
multi-modal d a ta ...I l l 5.5 Histograms of correlated spectral bands with low dynamic range from
Landsat MSS d a t a ... 113 5.6 Histograms of a multi-modal correlated Landsat MSS m o s a ic ...119 5.7 Schematic of mapping proportional variables in UCS for maximal
chromatic expansion ... 121 5.8 Schematic of strategies for the treatment of saturated pixels ... 124 6.1 Geometry of the surface reflectance m o d e l... 134 6.2 Blue-yellow pigment range with increasing lightness in a constant-hue UCS
cross-section... 141 6.3 Block diagram of the process of generating a coloured surface ...144 6.4 Geometry of the overlaid transparency m o d e l... 146 6.5 Block diagram of the process of generating a coloured transparency overlaid
on a coloured surface ... 148 6.6 Colour plate: application of the coloured surface model to real d a t a ... 154 6.7 Colour plate: effect of coloured surface model parameter v a ria tio n s... 155 6.8 Colour plate: application of the coloured surface model to real data
-pigmentation variations and application to non-topographic and single data
variables ... 156 6.9 Colour plate: application of transparency model to real data, and
pigmentation colour ran g es...157 6.10 The effects of height emphasis and illumination angle on topography
depiction ... 160 6.11 Gamut shape and dynamic range considerations in the choice of pigment
colour ranges ...166 7.1 Contrast sensitivity functions for the achromatic and chromatic channels of
A l.l CIE colour matching fu n c tio n s... 200 A 1.2 CIE Chromaticity d ia g ra m ... 200 A3.1 Overall structure of the developed software ... 207
List of tables
5.1 Spectral band statistics and correlations for a Landsat MSS subscene of the
Broken Hill region in A u stralia...113 5.2 Spectral band statistics and correlations for a mosaic of Landsat MSS
scenes of the Simpson Desert area in central Australia... 119 6.1 Coloured surface and transparency model parameters for images in figures
Chapter 1
Introduction
1.1
The problem of displaying image data in colour
Our aim in this thesis is to develop a comprehensive approach to the use of colour in the display of digital image data. Image displays are used to provide a visual representation of the spatial nature of graphical, statistical, or physical data in a wide range of fields. Colour is used to increase the capacity of such a presentation to convey information. Often several image data variables are simultaneously displayed in a spatially superimposed manner; the aim of such a presentation is to portray the spatial relationships between the variables, while still allowing appreciation of the characteristics of each individual variable. Achieving this aim involves consideration of the nature and perception of colour, and draws on work in the areas of colour science, human colour perception, and computer vision.
We consider an image data variable, or simply an image, to be a spatially two- dimensional, regularly gridded, numerical representation of some chosen measured, derived or otherwise specified data variable. In general, the two spatial dimensions of an image represent actual spatial dimensions, but in some cases they can represent temporal or other non-spatial variables. As an artificially created representation, an image may exhibit characteristics or properties not inherent in the original data variable being represented. We consider the dimensionality of an image data set to be the number of distinct image data variables to be presented in a spatially superimposed manner as a composite image.
can also represent geological, geophysical, ecological, meteorological or other physically- based properties. Such imagery is often produced by superimposing spectral channels from a set of remotely sensed data representing reflected radiation (from such sources as the Landsat or NOAA satellite, or airborne, multi-spectral scanners). Examples of this type of data set, in which the spectral channels are often highly correlated, are given in the colour figures of Chapter 5. Such spectral channels often do not directly represent aspects of the data most informative to an interpreter; some pre-processing to generate informative data variables can be required. Composite images can also be produced by combining image data variables derived from different measurement processes, and consequently with arbitrary or dissimilar spatial structures. When several image data variables are derived from the same geographical area, spatial structure can be correlated to a varying degree over portions of the spatial field; it is very often these variations in correlation which are of interest to an analyst and which should therefore be depicted. The integration of a number of such data variables; for example, of topographic data with data depicting variations in magnetic field strength (as shown in the colour figures of Chapter 6); results in display problems due to the dissimilarity of the spatial structures of the data variables being superimposed.
not only the manner of direct spectral assignment to such data sets, but also the overall manner in which the composite image is perceived by the visual system. This must incorporate both spectral and spatial considerations.
1.2
Approach taken to the problem - contribution of this work
The limitations of conventional image display methods can be explained if image interpretation is considered in the context of the information processing capabilities of the human visual system. Haber and Wilkinson (1982) suggest that "the effectiveness of information communication in a display depends on how closely the structure inherent in the information is mapped onto the modes by which the visual system processes the image". They further suggest that the visual system "attempts to interpret all stimulation reaching the eyes as if it were reflected from a real scene in three dimensions". When interpreting a real scene, the visual system relies on receiving appropriately reinforcing signals on its perceptual channels to provide information about the physical properties of the scene. This leads to comprehension of the overall scene structure. Conventional methods of image display do not necessarily generate these perceptual signals, and consequently are unlikely to depict realistic scenes. As a result, it is unlikely that a composite image formed by presenting data variables on display device primaries will achieve effective communication of information.
In brief, the approach ensures that structural comprehension of a presented data display can occur; that is, a presented display must be recognisable as a two-dimensional representation of a realistic physical scene. We explain why in some data displays this representation is inherent, and propose techniques to achieve it when it is not. Such techniques are based on representing informative data variables as natural scene variables, and rely on characterising these scene variables in terms of their perceived attributes, the spectral descriptors of which are commonly termed hue, saturation and lightness.
We consider the process of interpretation of the colours, or spectral variations, in a scene for which the overall comprehension requirements are satisfied. We stress the importance of being able to interpret informative data variables in terms of perceptually significant spectral attributes, which have direct relation to the physical processes that depict natural scenes, rather than in terms of some arbitrary spectral attributes such as the colour primaries of a display device. Representation of data by perceptually significant attributes is not in itself new (see Chapters 2 and 3), but its incorporation within a general display framework, and its use to depict natural scene attributes, is to our belief novel. The importance of being able to represent perceptually significant spectral attributes as closely as possible leads us to base the display framework around a perceptually uniform colour space in which these attributes have a natural representation and meaningful metric.
-arise as a result of the different contrast sensitivities of the achromatic and chromatic
visual mechanisms at high spatial frequencies. We believe this aspect of the work also to
be novel.
In summary, then, we propose a display approach which is based first, on achieving
an appropriate structural representation for the data; second, on representing it in terms
of appropriate perceptually significant spectral attributes; and third, on performing
appropriate enhancements based on specific mechanistic knowledge of the visual pathway.
We believe that such an approach can not only allow intuitive appreciation of superimposed
image data sets which under conventional display methods are difficult to interpret, but
also can substantially improve the presentation of data sets in general. This approach,
and its practical realisation, are based on what is generally known, deduced or surmised
about the operation of the human visual system. It draws from the areas of visual
perception, colour science, and computational approaches to scene understanding (applied
in the fields of artificial intelligence and computer vision). The framework is designed on
the basic principles of visual system operation, rather than on specific interconnection
details; it is hence not critically dependent on the current level of mechanistic knowledge
of visual processes. We believe that the development of such a comprehensive approach
is novel, even though it draws on many previously developed isolated applications of
1.3
Organisation of the thesis
In Chapter 2 we look at the overall operation of the human visual system, and at the visual processes involved in the comprehension and interpretation of images. We isolate factors relevant to structural scene comprehension, and the manner in which these are dependent on appropriate spatial and spectral representations in terms of perceptual attributes and their spatial distributions. We then consider the application of visual system models and considerations in image display, and develop a set of requirements for a computational framework within which the display approach can be implemented.
In Chapter 3 we develop a suitable computational framework. This framework encompasses the spectral and spatial operations involved in the structural synthesis of a realistic scene, spectral assignment at a perceptual level, and enhancements or compensations dependent on the low-level properties of the visual system.
We then treat data displays in which the requirements for structural comprehension are potentially satisfied within the data itself.
First, in Chapter 4 we consider the display of data in the form of spectral variations on a flat surface, treating both single variable (pseudo-colour) displays, or choropleth map displays (in which the spatial structure of variables simultaneously displayed is identical, boundaries between homogenous data areas being common to each variable).
Second, in Chapter 5 we consider the display of data in which the scene structure information is inherently embedded in the data itself, and structural comprehension can be achieved if this information is appropriately depicted. This type of data generally comes from the measurement of radiation reflected from a surface; the reflected signal intensity is modulated according to surface orientation and properties. Data sets of this type include remotely sensed multi-spectral scanner or photographic data.
attempts to portray information not normally observed in such a form. The superimposition of variations in magnetic or gravitational field strength with topographic variations forms an example of a display of this type. We realise such data as natural variables in a synthesised realistic scene, and consider also the use of such techniques to reinforce appreciation of data of the types treated in Chapters 4 and 5.
In Chapter 7 we investigate the extent to which we can improve the structural or perceptual comprehension of data displays within the developed display framework. In particular, we consider the effects of the spatial frequency characteristics of the visual system on the comprehension of an artificially presented scene (as any data display is), and consider compensation for, or avoidance of, detrimental effects.
Chapter 2
Image comprehension and interpretation
In the previous chapter we suggested that satisfactory interpretation of imagery depends on achieving an intuitive appreciation of the data variables presented in a display. Because the visual system is able to intuitively interpret visual scenes with which it is familiar, it is most likely to be able to interpret artificial data sets which are similarly presented as images depicting real scenes. On this basis, we investigate the processes involved in extracting information from real scenes, and consider appropriate ways of exploiting these processes in image display problems.
This approach involves investigating the overall operation of the human visual system. To this end, we look first at what is currently known of aspects of the operation of the visual system relevant to the colour display problem. Visual system models, and in particular those which have been used as a basis for computer-based image processing methods, are discussed. An overall approach to displaying image data in colour is developed, and in following chapters a framework to allow realisation of this approach is formalised and applied to various image data types.
2.1
The human visual system
knowledge in the context of understanding vision from a standpoint of extracting, at all levels of visual operation, useful information from visual images; Marr (1982) places physiological and psychophysical experimental results in the context of overall visual function, considering the plausibility of visual operations from a purpose-specific point of view. In this work we are concerned not with investigating physiological or psychophysical aspects of the visual system in detail, but rather with understanding the overall significance of observed or measured visual properties to the processing of colour visual information. This should enable us to make appropriate use of the functions of the visual system to assist, rather than have them confound, appreciation of data presented in colour image form.
We start by considering what is known of the physiology of the visual system neural components, their interconnections and transmitting channels. This information comes from neurophysiological experiments on primates; the extrapolation to humans is justified by the believed closeness of the human visual system to that of other primates, particularly to that of monkeys. We then consider the perception of visual stimuli in terms of the perceptual attributes which form natural descriptors of these stimuli, and the concept of a structural representation of an image, arising from the spatial distribution of perceived image attributes. The relevance of these processes to the design of a colour image display approach is discussed.
2.1.1 The visual pathway - mechanistic interconnections and processes
the spectral response range of each type of cone; human colour vision is hence three- dimensional (or trichromatic). Receptor density varies across the retina. In the central or foveal region, which subtends a solid angle of between one and two degrees, cone density is highest, with medium- and long-wavelength-responsive cones predominating. In fact there are no short-wavelength-responsive cones in the central area of the fovea.
Signal transmission between the retina and the visual cortex is in the form of modulated ganglion cell firing rates, carrying along the optic nerve (which consists of ganglion cell axons) an achromatic and two chromatic colour-opponent channels. These colour-opponent channels provide relative measures of the red-green stimulus and of the blue-yellow stimulus; the opponent signals are generated from a combination of an excitatory input and an inhibitory input, one from each of two types of cone (Gouras and Zrenner, 1981). Ganglion cells carrying the colour-opponent signals have a centre- surround response to retinal stimuli over a circular area called a receptive field. The spatial resolution of the achromatic channel is greater than that of the chromatic channels; these spatial frequency characteristics, and their consequences when viewing artificially created images, are investigated in Chapter 7 of this thesis.
Zrenner (1981) give an extensive summary of the neural processing of colour signals, emphasising the limitations of current knowledge and the degree of conjecture involved in high level modelling.
The spatial frequency characteristics of the visual pathway have been widely studied in psychophysical experiments. Proposals that the pathway is comprised of a set of channels, each tuned to a different spatial frequency, have been made (originally by Campbell and Robson, 1968) Such a structure can account for experimental results on the response to threshold level grating patterns. While the existence of such multiple channels has been contentious in vision research, Georgeson (1980) has suggested that it would not necessarily imply any particular model of spatial encoding. A more neurophysiologically-specific approach by Wilson and Bergen (1979) proposes two different sizes and types of receptive fields, and two different types of temporal response characteristics. This model can account for apparent narrow frequency response bandwidths by invoking probability summation; this presents a more plausible explanation of spatial frequency response characteristics (Marr, 1982 p.10). It is quite possible that the visual system has the ability to use higher-level-determined attention mechanisms to concentrate on particular spatial frequency ranges; for example, the ability to concentrate on focussed information (of high spatial frequency) while disregarding out-of-focus information in a scene might be such a mechanism (Ginsberg, 1980).
2.1.2 Visual perception of colour - spectral perceptual attributes
At a perceptual level, attributes of a scene such as colour or depth are recognised.
perceptual descriptors hue, saturation and lightness (or brightness), taken from the Commission Internationale d’Eclairage (CIE), as reported by Hunt (1978).
Hue: "attribute of a visual sensation according to which an area appears to be similar to one, or to proportions of two, of the perceived colours red, yellow, orange, green, blue, and purple".
Saturation: "attribute of a visual sensation according to which an area appears to exhibit more or less chromatic colour (colourfulness), judged in proportion to its brightness".
Lightness: "attribute of a visual sensation according to which an area appears to reflect diffusely or transmit a greater or smaller fraction of incident light".
{Brightness: "attribute of a visual sensation according to which an area appears to be emitting, transmitting, or reflecting, more or less light".)
The terms brightness and lightness are often confused; Hunt distinguishes between them on the basis of whether a stimulus comes from an apparently luminous source (emitting or specularly reflecting), or whether it comes from an apparently non-luminous source (transmitting or diffusely reflecting) respectively. Because of the difficulty in an artificial display situation of always determining this distinction, and because we treat surfaces which have both diffuse and specular reflections in later chapters, we shall throughout this work use the term lightness only, with the implication that when appropriate, it should be taken to mean brightness. We shall also use the term saturation to describe colourfulness defined above, rather than colourfulness in proportion to brightness, because of its widespread usage in this sense in the image display literature. (This corresponds to CIE chroma.)
The important aspect of these three attributes is that they are sufficient to describe the difference between any pair of visually distinguishable point sensations, and that one or two of the attributes only can be insufficient. Note that this does not mean that different physical stimuli will necessarily be distinguishable. Apart from spectral resolution limitations, a consequence of the finite-dimensionality of colour vision is that two non identical physical stimuli can appear identical (metamerism). Spectral attributes are also affected by adaptation. Adaptation describes the ability of the visual system to adapt to a steady-state viewing condition, such as an illumination level, or a chromatic cast, and still distinguish spectral attributes on a relative basis, given the rendering limitations of the illumination. Thus, because of the effects of lightness and chromatic adaptation, it is difficult to specify spectral attributes for a single stimulus; rather some basis for comparison is required. Consequently the hue, saturation and lightness of a stimulus are perceived in a sense relative to a reference stimulus, and in normal scene viewing conditions that comparison would be made relative to some derived overall or average conditions. Cornsweet (1971) discusses the factors affecting these subjective perceptual attributes, treating in some detail their possible low-level physiological correlates.
illumination. This makes perceptual scene analysis fairly consistent under the very wide range of viewing conditions encountered in real-world illumination variations. Consequently we must be aware, at least, that the perceived attributes of a stimulus depend on both local and global viewing conditions.
That three distinct spectral attributes can be distinguished when judging a stimulus relative to some reference does not mean that these attributes can necessarily be treated as independent under all conditions. In discriminating between samples on the basis of perceptual attributes, a set of samples can be sequentially ordered using a process of intuitive extrapolation. It is this ordering process which allows us to use such an attribute to represent the relative magnitude of a data variable. But whether this intuitive extrapolation of order can be performed under all spatial and spectral conditions is another matter. In general, under conditions of spatial adjacency, judgements of the magnitude of differences, and of sample order, can be made if the samples being compared are close in perceptual terms; that is, locally in three-dimensional perceptual spectral space. Under different conditions of spatial comparison, or for samples very different in one or more than one perceptual attribute, it becomes more difficult to make such judgements. More specifically, we can summarise the inter-dependencies, under conditions of spatial adjacency, of perceptual attributes hue, saturation and lightness in terms of their use for the discrimination of differences between, and the ordering of, samples, as follows.
(1) Discrimination between hues is consistently possible, even under conditions of varying saturation and lightness. Ordering of hues is not particularly intuitive in an absolute sense, though for small hue differences, relative ordering becomes more intuitive. (Hue orders such as those associated with the spectrum order can be learned.)
(3) Discrimination between levels of lightness is possible for small differences under conditions of constant hue and saturation, but again less so when comparing widely different hues and saturations. Lightness ordering is intuitive when discriminations can be made.
These qualifications suggest that the three variables can be considered to be independent in a spectrally local sense, but not in a spectrally global sense. In a spectrally global sense, hue discriminations can still be made relatively finely, but saturation and lightness discriminating abilities (and hence ordering capabilities) are substantially reduced.
2.1.3 Structural scene comprehension
In the previous section we identified the spectral perceptual attributes which could be associated with any particular point in a visual field. We can think of a structural representation of the information over a visual field as being the result of analysing the variation in perceptual attributes over its spatial extent. By associating structural representations with physical properties, we can interpret the information in terms of these recognised physical properties: namely, surfaces and their coverings.
The method by which this spatial analysis is performed is far from clear, though the importance of recognising edges is suggested both on heuristic grounds, and on the physiological evidence of cells responsive to edges as outlined in section 2.1.1. Similarly some mechanism for detecting gradual changes must exist for the analysis of, for example, shape from lightness variations. The association of changes in perceptual spectral attributes with physical processes giving rise to them can form the basis for developing plausible models of portions of the structural scene comprehension process; such models are discussed in section 2.2.1.
physical properties at that point, the attributes gauged in relation to their neighbourhoods do. In other words the spatial variations at all frequencies provide the important information about physical scene properties. The visual system is sufficiently experienced at analysing real-world scenes for the associations of perceptual attribute spatial distributions with physical properties to be intuitive. For example, surface form, or topography, can be intuitively appreciated from appropriate lightness variations (Horn, 1981); similarly shadows, textural characteristics and covering characteristics can be immediately appreciated, and an implicit understanding of the general spatial nature of the physical properties results.
In the following section we look at the extent to which considerations of visual system models and processes have been used in the development of image display approaches or techniques.
2.2
Visual system models and their use in colour image processing
Visual system models attempt to explain physiologically and psychophysically observed effects by proposing mechanistic interconnections which are substantiated by, or at least in accordance with, physiological evidence and known neurophysiological interactions. The application of visual models in image processing can be for image enhancement, compensation for visual characteristics, or supplying a measure of information content which is visually significant for data compression. Effectiveness in such a process does not necessarily validate a model on which it is based.
2.2.1 Visual models - their constraints and limitations
significant; the spatial frequency bandwidth of each opponent channel is included in the model. Application in the context of this work of the perceptual colour spaces so formed is considered in the following chapter. One strength of Faugeras’ work is the physical basis behind the processing approach; in providing spatial access to the opponent channel signals, he allows appropriate emphasis or de-emphasis of information closely related to the physical scene variables, and hence of the information the visual system has to extract from the scene. Gagalowicz (1982) has shown some limitations of Faugeras’ derived perceptual channels when applied to the discrimination of colour texture fields; this suggests that the receptor-opponent formulation is for some purposes too simplistic in its assumptions. This conclusion is reinforced by more recent neurophysiological findings (Gouras and Zrenner, 1981).
Outside the context of image processing many models which treat specific visual factors in a receptor-opponent zone model have been proposed. Brightness perception of colours forms the basis of the vector model of Guth (1972; Guth et al., 1980), while other studies have used other empirical colour matching data to determine receptor-opponent interconnections (for example, Vos and Walraven, 1971). Paulus and Kröger-Paulus (1983) have proposed a model which is not specific in these interconnections, but rather relies on centre-surround interactions for its formulation. In any such model, if the opponent zone is treated as perceptually significant, it can provide a basis for appropriate processing, requiring only some derived analytical access. The inclusion by Faugeras, and Hall and Andrews, of spatial-frequency dependence in their modelling of the low level pathway forms a significant advance over models which consider only the spectral nature of the receptor-opponent interconnections.
spatial-frequency-channel-specific eye-brain model, as an achromatic image processing rationale. Massof and Bird (1978) have also applied a stochastic approach using Guth’s (1972) opponent-based vector colour space model, and have shown that many spatial and spectral visual properties can be explained in such a framework. Such models have a role in the prediction of measurable visual effects, but require the additional stage of relating statistically derived measures to the more complex physical attributes of scenes to be directly useful in a display context.
Land proposed a theory of vision, based on a visual system model of separately identifiable retinex images (one for each receptor type), which recognised the importance of deriving physically significant information from a visual image (see Land, 1977 for a summary). Land suggested a (one-dimensional) method for removing the (slowly varying) illumination component from a scene, resulting in extraction of surface reflectance information. Horn (1974) showed that a two-dimensional analogue of this method was theoretically feasible, and pointed out that images derived from linear combinations of the originally proposed receptor retinex channels could equally well be used. While Land’s theory does not adequately explain all perceived visual effects (Marr, 1982 p.257), and now looks physiologically implausible, it is conceptually attractive in its physical basis; the removal of the slowly varying lightness component effectively amounts to processing in a perceptual domain, with potential for image enhancement operations.
Investigations into the possible structural analysing processes which might be performed by the visual system have, in the field of artificial intelligence, looked at the physical property carrying the information, and then considered ways of isolating that physical property. Both abrupt and gradual variations in perceived attribute provide information about the intrinsic structure of a scene. For example, Horn (1977) has shown that the shape of non-occluded smooth surfaces can be derived from non-linear local variations in lightness; lightness edges can be caused by surface height discontinuities or shadows; colour discontinuities can suggest surface material boundaries. Marr (1982, p.261) goes further to suggest that non-linear lightness changes which are not discontinuities due to shadows or surface orientation changes can be assumed to be due to surface property variation, and as a consequence that surface property information can result from analysis of non-linear local changes in lightness and spectral distribution. Rubin and Richards (1982) also suggest spectral attribute associations with the physical properties of material boundaries, shadows, highlights, surface orientation, and pigment densities. Such interpretations have been developed and used widely in the context of extracting scene characteristics from images (see Brady, 1982 for a summary). Surface shape can also be derived from consideration of textural properties under certain conditions by local analysis of lightness variations (Kanatani, 1984).
At a higher level of scene analysis, models which attempt to deduce three-dimensional geometrical scene characteristics from edge information have been proposed (Tenenbaum et al., 1974). Detection of edges can form the first stage of a primitive generating process; Marr (1982), Haralick et al. (1983), Tsotos (1984), Rosenfeld (1984), and Haralick and Shapiro (1985) summarise such modellings. These investigations lead both to refining models of higher level visual processes, and also to the development of computer vision systems for applications in robotics. Computational techniques to test hypotheses of such models have been summarised by Brady (1982).
observed effects, they cannot necessarily be used to realise a physical effect, in terms of perceptually significant attributes, in a realistic manner.
2.2.2 The use of visual models and considerations in colour image processing
This section summarises techniques, based on consideration of visual mechanisms and processes, which have been used in colour image processing. The purpose and rationale behind each technique only is outlined; where appropriate, subsequent chapters treat individual processes more thoroughly.
Spatial-frequency dependent processing based on specific mechanistic models
Faugeras (1976) showed that by using enhancement methods based on low level visual properties (the spatial frequency characteristics of proposed opponent channels), the apparent quality of a reproduced colour picture could be improved (see Chapter 7 for further details of this process). He also applied his model to image compression. Hall and Andrews (1978) used a similar approach, based on an earlier-developed visual model (Hall and Hall, 1977), to develop image compression methods based on an application of information theory to the visual model output. It should also be mentioned that the standard broadcast television compression of colour picture information, into a bandwidth not much greater than that required for monochrome picture transmission, results from recognition of the limitations in chromatic resolution of the visual system (see Hunt, 1975).
Representation of data by perceptually significant attributes
appreciation of data variables so represented; second, to facilitate spectral decomposition at any point in an image.
Proportional representation of data differences by perceived colour differences
Display techniques have also used perceptually uniform colour spaces (spaces in which the metric uniformly reflects perceived colour differences) to achieve proportional representation of numerical data differences by perceived colour differences. Such an approach allows an intuitive feel for the magnitude of data variations to be gained. Juday (1979) has proposed this approach for the display of multi-spectral data; Juday (1978), Juday et al. (1978) and Balon and Cicone (1979) have investigated the application of this approach to LACIE image products. Meyer and Greenberg (1980) suggest using such spaces for computer graphics in general. Others (O’Callaghan et al., 1981; Robertson and O’Callaghan, 1982,1984; Tajima, 1983) have extended the use of uniform colour spaces to various data types. These approaches are discussed in greater detail in later chapters.
Structural representations
Techniques which give three-dimensional structural representations to spatially two- dimensional data variables to improve comprehension have been used widely in graphic data display (see Bertin, 1981; Grotch, 1983), and also in image display (Arvidson et al., 1982; Robertson, 1984; Robertson and O’Callaghan, 1985). The rationale behind these techniques is that while spatially two-dimensional data presentations are not always immediately and intuitively comprehensible, a two-dimensional view of a three-dimensional representation, with appropriate monocular depth cues such as occlusion, scale or shading, can be immediately comprehensible. Image processing software packages which display variables in the form of a three-dimensional surface are available (for example, TASC or UNIRAS software). Chapter 6 considers the scope and limitations of these methods.
have been used in an image processing context. We now develop an overall approach to image display on the basis of these visual considerations.
2.3
Overall requirements for image display - approach taken in this work
2.3.1 Relevance of visual system operation to the display of information in colour
In analysing real-world scenes the visual system manages to process the very large amount of information it receives by its ability to interpret spatial variations in perceptual spectral attributes as corresponding to physical property variations. Patterns are intuitively appreciated, allowing extraction of the desired spatial nature of individual physical properties. Interactions, due to the overall scene structure, between physical processes are also intuitively comprehended, and compensated for, when interpreting the physical property variations. Representation of real-world scenes in a spatially two-dimensional form, such as in a colour photograph, leaves most of these associations and intuitive comprehension processes still operative. This is because most depth cues are still present (see Marr, 1982; Wolfe, 1983).
appropriately using perceptual spectral attributes, are more likely to be intuitively appreciated than those which use arbitrary spectral assignments. This is not to say that in all representations of all data variables such an approach is necessary for data appreciation; rather it is suggesting that when a presented image reaches a certain level of complexity, in terms of the number of individual data variables presented and their spatial structures, overall comprehension is more likely to be achieved if the intuitive scene analysing capabilities of the visual system are exploited.
We suggest that a data display must be designed such that the data variables can be intuitively extracted; this is a prerequisite for effective appreciation of the spatial nature of the data variations, and relies on making use of the normal visual scene analysing processes. We thus propose that a comprehensive display approach must embrace the following basic principles.
(1) A data display should be recognisable in a structural sense as a realistic scene.
(2) Individual data variables should be depicted as plausible physical properties of the scene by choosing appropriate perceptual spectral representations for them.
(3) The requirements for structural and perceptual representation should be satisfied before enhancements, or compensations for visual system mechanisms, are applied; otherwise such enhancements will have very limited use.
This leads to a three stage process when designing an image display; this process is depicted in figure 2.1. We suggest that all image data display situations can be considered within
Perceptual representation:
depiction of data variables as scene properties by appropriate assignment of spectral attributes
Enhancement of representations:
compensation for data or visual system characteristics
[image:36.551.53.443.50.660.2]2.3.2 Structural scene comprehension requirements
In many data displays, structural comprehension will be inherently satisfied. For example, a map displaying a single variable can be structurally recognised as a flat surface with spectral variation (representing the data variable) over that surface. Similarly a photograph, in which appropriate lightness variations portray the surface structure, will be intuitively comprehended structurally. The display of such data types is treated in Chapters 4 and 5. However, if the requirements for intuitive structural comprehension are not inherently satisfied in the data, such as in the earlier-cited example of superimposed data variables with dissimilar or arbitrary spatial structure, the display methodology must somehow provide a basis for this structural comprehension. We approach this in Chapter 6 by synthesising realistic scenes, consisting of surfaces and their coverings, and representing data variables by appropriately chosen natural scene variables. This should then allow intuitive extraction of scene variables, and hence data variables.
To achieve realistic scene synthesis, and the representation of natural scene variables, we use models of physical processes involving illumination of, and reflection from, surfaces. We also use the results from computational approaches to scene understanding; these results in general relate spectral perceptual responses to the physical processes causing them, describing the role of lightness and chromatic variations in surface topography depiction, and in reflection from the surface of materials. It is the realistic representation of these physical processes that should allow intuitive scene appreciation. This means that we must also be able to realise the appropriate spectral perceptual attributes (hue, saturation and lightness) in the synthesised scene.
2.3.3 Realisation of spectral perceptual attributes
spectral perceptual space into which data can be mapped. Such a space would then be addressable in these terms. We would also like distance from some defined origin within the space to reflect psychophysical colour judgements, and the space metric to reflect psychometric judgements of colour differences. The extent to which we can achieve representation within such a space is considered in Chapter 3.
2.3.4 Enhancements and compensations based on mechanistic knowledge
2.4
Summary
This chapter has investigated aspects of the operation of the human visual system pertinent to appreciation of the characteristics of image data variables represented in a composite colour image.
The importance of ensuring that overall structural comprehension of a presented display can take place before spectral interpretation can be performed has been stressed. A display approach which achieves this structural comprehension by presenting the display in the form of a realistic scene has been proposed. This involves representing the data variables as natural physical properties of this scene, achieved by modelling such properties in terms of their perceived spectral effects.
The importance of an appropriate spectral representation of perceptual attributes, both for realistically representing scene properties, and for direct spectral decomposition purposes, has also been emphasised. This suggests the use of a perceptual space representing these spectral perceptual attributes as central to the framework for realising the display approach. This framework is developed in the following chapter.
Chapter 3
Development of a framework for image display
This chapter develops a framework, based on a three-dimensional perceptual colour space, for the processing and display of multi-dimensional image data sets as described in following chapters. Section 3.2 looks at the requirements, derived from the approach to image display outlined in Chapter 2, for this perceptual colour space. Various types of colour space are described and examined for suitability, and a framework satisfying the requirements is proposed. Section 3.3 looks at the feasibility of performing the desired spectral and spatial transformations within this framework, while section 3.4 treats its realisation. Colorimetric terms and concepts used in this chapter are defined and explained in Appendix 1.
3.1
Basic form of the framework
As stated in the previous chapter, we assume temporal invariance both in data presentation, and consequently in visual system adaptation level.
We define a real-world spatially three-dimensional and spectrally three-dimensional perceptual space P, defining spectral variables H, S and L as cylindrical polar co-ordinates of P. In the general case we wish to map informative image data variables from a data space D into perceptual variables (in P); that is,
P(H,S,L,x,y,z) = <PDP{ Dl ,..., Dn, x, y; D{ D\ ,... Dn,x,y) \.
We may also wish to perform spatial (in a structural sense) or spectral (in a high level perceptual sense) processing in P:
P'(H,S,L,x,y,z) = <PpP [H,S,L,x,y,z; P(H,S,L,x,y,z)}.
These processes are considered in Chapter 6.
We define the displayed image perceptual space U, as spatially two-dimensional and spectrally three-dimensional. We use rectangular co-ordinates for both spatial and spectral representations of U. It is convenient to use U, with its rectangular spectral co-ordinate system, rather than P, with its cylindrical polar spectral co-ordinate system, as central to the framework.
Transforming from P to U can be treated as a two-stage process. First, a projection from three to two spatial dimensions is made:
P'(H,S,L,x,y) = <t>PP X{x,y,z ,P(H,S,L,x,y,z)}.
Second, a transformation of spectral variables from (cylindrical polar) perceptual attributes to rectangular co-ordinates is made:
We consider in detail in Chapters 4 and 5 cases where no spatial projection is performed. In Chapter 5 it will also be evident that we may wish to map informative data variables directly into U:
U(U\,U2,U3,x,y) = <Ddu [D\,...,Dn ; D(D\,...,Dn,x,y)} .
Similarly in some cases we may wish to perform spectral processing (for example, to compensate for the effects of induction) in U rather than in P:
U'(Ul,U2, U3,x,y) = <DUU>X ( Ul, C/2, U3,x,y ; U(C/1, C/2, C/3,x,y)}.
In addition, as suggested in the previous chapter, we may require access to lower levels (symbolically termed M) of the visual pathway to allow for spatial and spectral processing for enhancement or compensation purposes. This involves a series of transformations of the form
= <J>UMX ( U\,U2,U3 ; U(U\,U2,C/3,x,y)};
M '(M l,...,M n,x,y) = 4>MM ; M (M \,...M n,x,y) j;
U \U l,U 2,U 3,x,y) = ^>MU,X ; M \ M \ ,...,M n ,x ,y ) } .
Chapter 7 looks at requirements for transforming between M and U, and at appropriate mechanism-dependent processing.
Finally we must be able to realise colours specified in U on any chosen colour display device. This involves a transformation to display device gun-count space J:
J { J \,J 2 ,n ,x ,y ) = 3>uj,a 1 U\,U2,U3 ; U(U\,U2,U3,x,y)}.
The derivation of this transformation is treated in section 3.4.
(D\,D2,..,Dn,x,y) Informative Data Space
Low-level Visual Mechanism Space
M
(M l, M2, M3, x,y) Perceptual
Space
Uniform Colour Space
Display device Gun-count Space
[image:43.551.67.534.129.599.2]3.2
Perceptual colour space central to the framework
In this section we consider the properties required of the perceptual space U central to the framework, and evaluate the suitablity of various spaces derived from display device and visual system characteristics.
3.2.1 Requirements of a perceptual colour space
The perceptual space U which is used as the core of the display framework should have the following spectral properties.
(1) The space should be addressable in perceptually meaningful terms to allow representation of data variables by combinations of appropriate perceptually significant attributes. This should aid intuitive extraction of data variables from a display, contributing to overall scene comprehension. Addressability in perceptual terms can also allow compensation for high level visual effects.
(2) The metric of the space should have perceptual significance; that is, it should be possible to relate the size of perceived colour differences to the size of numerical data steps. This implies that there should be no discontinuities in perceived colour in the bounded region of the space accessible by a display device.
(3) It must be possible to realise colours specified in the colour space on colour display devices by providing a transformation to display-device addressing terms.
In addition, it would be advantageous if it were possible to analytically access lower visual levels from the image perceptual space U. This would allow spatial or spectral processing based on what is known of the low, or mechanistic, level of operation of the visual system. Compensations or enhancements applied at such a level can exploit known effects to improve image quality, and hence data appreciation.