Int. J. Electrochem. Sci., 13 (2018) 1773 – 1786, doi: 10.20964/2018.02.37
International Journal of
ELECTROCHEMICAL
SCIENCE
www.electrochemsci.org
Cycle life testing of lithium batteries: The effect of load-leveling
Jingyuan Zhao1,2, Yinhan Gao1, Jianhua Guo1,*,Liang Chu1, Andrew F. Burke2,* 1
State Key Laboratory of Automotive Simulation and Control, Jilin University, Changchun 130022, China
2
Institute of Transportation Studies, University of California-Davis, CA 95616, USA *
E-mail: [email protected], [email protected]
Received: 28 September 2017 / Accepted: 10 December 2017 / Published: 28 December 2017
In the present study, modules of LiNiCoAl and LiFePO4 cells were cycled at constant current and on dynamic pulse discharge/charge profiles. All the cycling was done at room temperature. Each module consisted of three 18650 cells. The average current for both discharge profiles was C/2. The degradation of the modules was tracked in terms of changes in their Ah capacity and resistance as the cycling proceeded. The modules were cycled for about 750 cycles over a period of six months. For both lithium chemistries, the present data indicated that the modules degraded more rapidly with constant current cycling than using the dynamic pulse profiles. This was an unexpected result as current thinking is that load-leveling the discharge of a battery will increase its cycle life. It is difficult to compare the present data with that from the previous studies because the test conditions, charging algorithms, and discharge profiles of the various studies are quite different. The available data in the literature show large variations in the effect of load leveling on the cycle life of batteries.
Keywords: Cycle life, degradation, dynamic pulse discharge, constant current discharge, LiNiCoAl, LiFePO4.
1. INTRODUCTION
very long cycle life (up to one million cycles) [5]. Utilizing the proper control strategy to split the current demand to/from the electric motor between the batteries and the SCs, the current/power experienced by the batteries can ideally approach the average current/power needed to operate the vehicle. Current thinking is that load-leveling the battery will increase its cycle life and in addition, permit the use of batteries with lower power capability and hence higher energy density and lower cost ($/kWh). The lower currents in the batteries will also reduce the heat generated and the cooling required and thus the round-trip efficiency of the energy storage unit. There have been only a few previous studies [4, 6] that directly seek to determine the effect of battery load-leveling on cycle life utilizing SCs.
The cycle life testing discussed in this paper was intended to quantify the effect on cycle life of load-leveling lithium batteries as they would be used with SCs in PEVs. Specifically, cycle life testing of 18650 cells of the LiNiCoAl and LiFePO4 chemistries was performed. Three cell, series-connected modules were prepared for both chemistries. One module of each of the two cell chemistries was tested using a dynamic pulsed discharge profile and one module at a constant current equal to the average current of the dynamic pulse profile. The cycles for both modules were terminated when 80% of the cell initial Ah capacity was discharged. The Ah capacity and resistance of the modules were monitored every 30 cycles to assess the degradation of the cells. This test procedure permits the direct assessment of the effect on cycle life of load-leveling the discharge of the cells for the same charge and test termination conditions.
2. OBJECTIVE OF THE PRESENT RESEARCH
As indicated in the previous section, the objective of the present study is to determine the effect of dynamic pulsing of the cells (both charge and discharge power pulses) on cycle life during cell discharge. There have been many experimental studies [7-16] of the factors that affect the cycle life of lithium-ion batteries and the Ah throughput needed to reduce their capacity (Ah or Wh) by 20% and increase their resistance by 50%. There have been far fewer studies [11-13] that compared directly the cycle life of batteries discharged at constant current with the same battery discharged with dynamic charge/discharge pulses. The previous studies [11-13] have shown that the cycle life of lithium batteries depends in a complex manner on many factors and the discharge profile is only one of them. The additional factors include the chemistry and size of the cells, ambient temperature of the tests, the charge algorithm, and the initial and final discharge conditions. For these reasons, special care was taken in this paper to present in detail the test conditions and the pulse test profiles used in these cycling tests so that researchers in future studies can make comparisons of their data with the present results.
3. BATTERY CELL/MODULES AND TEST PROCEDURES
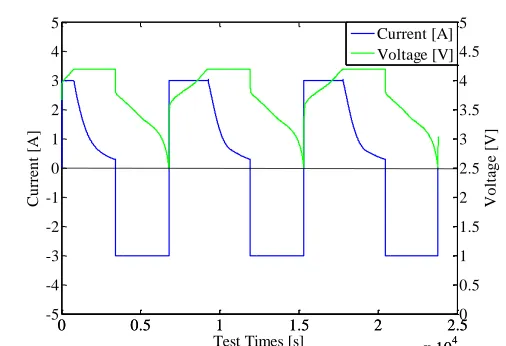
In this project, LiNiCoAl cells, Panasonic 3.1Ah 18650A, and LiFePO4 cells, K2 Energy 1.5Ah 18650E, were tested. Both of these cells are commercially available and can be purchased on the internet. The cells were tested using an Arbin battery tester which can support ±20 A, 20 V for 6 channels in the Vehicle Energy Test Laboratory at the University of California-Davis. The performance characteristics of all the cells were measured before they were connected into 3-cell modules for the life cycle testing. The results of the initial characterization tests of a typical cell of each chemistry are summarized in Fig. 1 and Table 1. Note in Fig. 1 the distinctly different current taper characteristics of the two cell chemistries. In the case of the NiCoAl cell, the current tapers at a near constant rate over a relatively long time and then levels off to taper more slowly. In the case of the LiFePO4, the current tapers rather slowly for a relatively short time and then rapidly decreases in a short time to the cut-off current. The differences in the cell chemistries are reflected in their C-V charging characteristics and thus their total charging times at specific C rates.
0 0.5 1 1.5 2 2.5
x 104 -5 -4 -3 -2 -1 0 1 2 3 4 5 Cu rren t [A ]
Test Times [s]
0 0.5 1 1.5 2 2.5
x 104 0 0.5 1 1.5 2 2.5 3 3.5 4 4.5 5 V o lt ag e [V ] Current [A] Voltage [V]
a. Current and voltage profile of LiNiCoAl 18650A Li-ion cell, in which the cell was charged and discharged at 1 C current, 25℃ for 3 test cycles between 4.2V to 2.5V.
0 0.5 1 1.5 2 2.5
x 104 -2 -1.5 -1 -0.5 0 0.5 1 1.5 2 Cu rren t [A ]
Test Times [s]
0 0.5 1 1.5 2 2.5
x 104 0 0.5 1 1.5 2 2.5 3 3.5 4 V o lt ag e [V ] Current [A] Voltage [V]
[image:3.596.173.426.332.505.2]b. a. Current and voltage profile of LiFePO4 18650E Li-ion cell, in which the cell was charged and discharged at 1 C current, 25℃ for 3 test cycles between 3.65V to 2V.
[image:4.596.67.536.234.421.2]
The cell test results were used to select the cells to combine in the 3-cell modules used in the cycle testing. Since the cell characteristics varied significantly, the selection process was needed to attempt to minimize the differences in the modules for each of the cell chemistries. The two modules of each battery chemistry were tested simultaneously to minimize the impact of calendar life on the cycling performance tests.
Table 1. Performance characteristics of the cells.
Device: Panasonic - LiNiCoAl / Nominal voltage: 3.6 V / Nominal capacity: 3100 mAh Constant Current
(A)
Time
(sec) Ah
Pulse tests
Steady-state Resistance
(mOhm)
Rebound Resistance
(mOhm) Pulse
Current (A)
Pulse Time (sec)
1 10476 2.91 -9 10 74 76
2 5130 2.85 -6 10 78 77
3 3271 2.73 -3 10 77 78
7 5 76 75
Device: K2 – LiFePO4 / Nominal voltage: 3.1 V / Nominal capacity: 1500 mAh
0.5 10368 1.44 -6 10 101 101
1 4965 1.38 -4 10 107 108
2 2309 1.28 -2 10 115 115
4 5 106 101
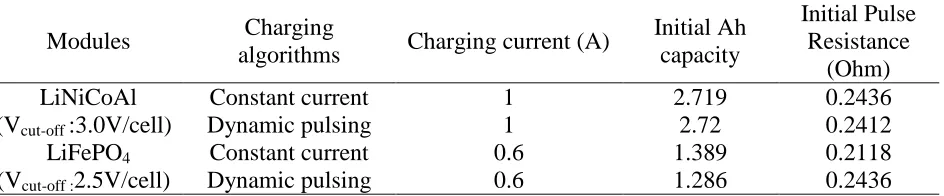
Table 2. Initial characteristics of the modules.
Modules Charging
algorithms Charging current (A)
Initial Ah capacity
Initial Pulse Resistance
(Ohm) LiNiCoAl
(Vcut-off :3.0V/cell)
Constant current 1 2.719 0.2436
Dynamic pulsing 1 2.72 0.2412
LiFePO4 (Vcut-off :2.5V/cell)
Constant current 0.6 1.389 0.2118
Dynamic pulsing 0.6 1.286 0.2436
The initial Ah capacity and resistances of the four modules are given in Table 2. As indicated in Table 2, the testing of the K2 module used in the dynamic pulse cycling tests indicated its initial Ah capacity was significantly lower than the module used for the constant current testing. As discussed later, this resulted in the cycle life of the K2 module in the dynamic cycle test being relatively short.
[image:4.596.65.537.476.574.2][image:5.596.153.442.226.436.2]
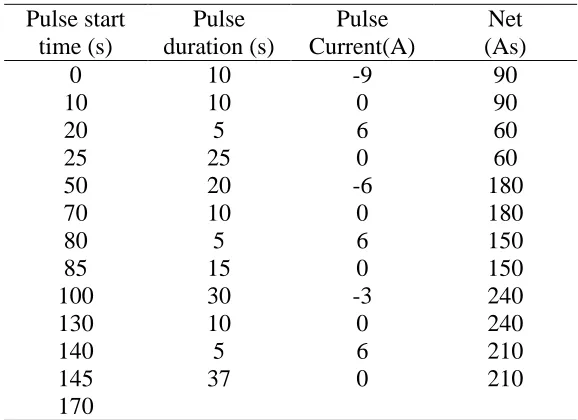
and discharge) were configured to yield a constant current of C/2. This discharge time would be reasonable for an EV application. The constant current tests were run at the same average current as experienced by the cells in the dynamic pulsing tests. The dynamic pulse profiles are listed in Tables 3 and 4. The maximum power densities (W/kg) of the pulses were relatively high for the 18650 cells for both the discharge and charge pulses. Hence the cycling with dynamic pulse sub-cycles was relatively demanding.
Table 3. Dynamic pulse sub-cycle steps for life cycling test on LiNiCoAl module*. Pulse start
time (s)
Pulse duration (s)
Pulse Current(A)
Net (As)
0 10 -9
0 6 0 -6 0 6 0 -3 0 6 0
90
10 10 90
20 5 60
25 25 60
50 20 180
70 10 180
80 5 150
85 15 150
100 30 240
130 10 240
140 5 210
145 37 210
170
[image:5.596.163.433.508.718.2]*(W/kg)max = 675, Average current: 1.15A (C/2.7-rate)
Table 4. Dynamic pulse sub-cycle steps for life cycling test on LiFePO4 module*. Pulse start
time (s)
Pulse duration (s)
Pulse Current(A)
Net (As)
0 10 -6
0 4 0 -4 0 4 0 -2 0 4 0
60
10 10 60
20 5 40
25 25 40
50 10 80
60 10 80
70 5 60
75 15 60
90 15 90
105 10 90
115 5 70
120 25 70
145
The cycle testing of the modules was performed as follows. Before each discharge cycle, the module was completely charged to the specified voltage for the two chemistries (12.6V for the NiCoAl cells and 10.95V for the FePO4 cells). The charging current (C/2) was then tapered to 1/10th the initial value. The modules were rested for 5 minutes before the discharges were initiated. For all the cycles, the cycle was terminated when 80% of the initial Ah capacity of the module had been discharged. The average currents for the dynamic pulse sub-cycles are indicated in Tables 3 and 4. These average currents were used in the constant current cycling of the respective modules. In the dynamic pulse cycle discharges, the sub-cycles were repeated for a specified time to discharge 80% of the module Ah capacity. In the constant current cycling, the cycle was also terminated when 80% of the module capacity had been discharged. After a 5 minute rest, the modules were recharged and then discharged. After each set of 30 cycles, a performance diagnostic test (PDT) was performed to determine the Ah capacity and resistance of the module, shown in Fig.2. The resistance was determined from an 8 sec, 4-5A pulse at 60% SOC; the Ah capacities were determined using a cut-off voltage of 3.0V/cell for the Panasonic NiCoAl module and 2.5V/ cell for the K2 Energy FePO4 module.
0 0.2 0.4 0.6 0.8 1.0 1.2 1.4 1.6 1.8 -6 -4 -2 0 2 4 6
Test Times [s]
Cu rren t [A ] 0 0 2 4 6 8 10 12 14 V o lt ag e [V ] Current [A] Voltage [V] Positive Pulse Current Negative Pulse Current x104 -6 -4 -2 0 2 4 6 C ur re nt [ A ]
1.2 1.205 1.21 1.215
x 104
0 2 4 6 8 10 12 14 V ol ta ge [V ]
Test Times [s]
[image:6.596.124.472.337.574.2]Current [A] Voltage [V]
Figure 2. Performance diagnostic test after each 30 deep discharge cycles (Supplementary note: PDT comprises a fully charge, SOC=100%, and then a capacity-examination via constant current discharge at C/2.7-rate for LiNiCoAl battery module and C/3.1-rate for LiFePO4 battery module is implemented. Discharge and charge pulse tests are performed to obtain the steady-state resistance, and rebound resistance of the battery modules [27].
4. RESULTS AND DISCUSSION
module was cycled at the constant average current of the respective dynamic cycles. All the cycling was done at room temperature. The degradation of the cells is described in terms of the change in the Ah capacity and resistance of the modules as the cycling proceeded. The results of the cycling are shown in Fig. 3 for the Ah capacity and in Fig. 4 for the resistance.
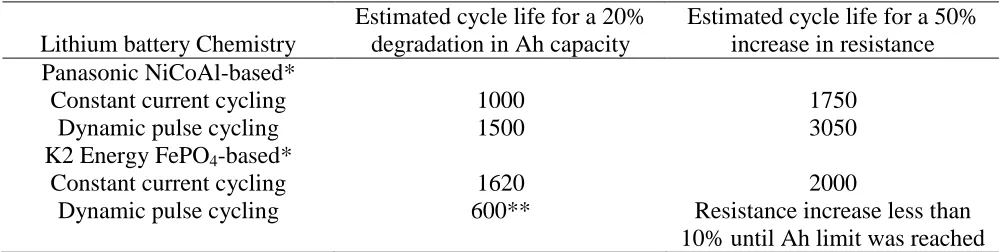
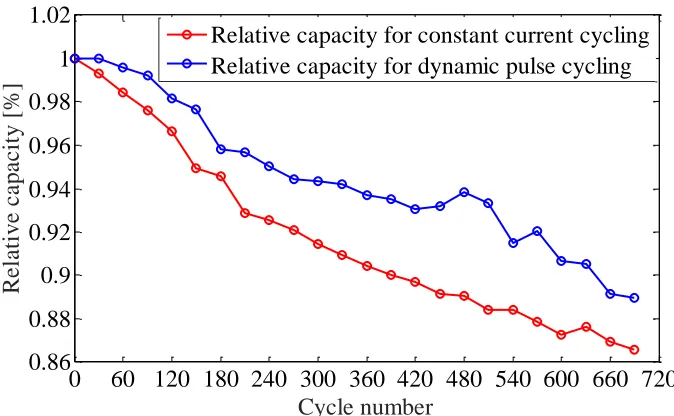
[image:7.596.48.549.428.554.2]The test results shown in Fig. 3a indicate that the Ah capacity of the NiCoAl module decreased more rapidly for the constant current cycling than with dynamic cycling, but the difference was not large. The test results for the FePO4 modules given in Fig. 3b indicate that the degradation was more rapid with the dynamic pulse cycling, but this interpretation is uncertain because the module used for dynamic cycling was discharged to 87% of its original Ah capacity rather than to 82% as was the case for the module being cycled at constant current. If one extrapolates the curves in Fig. 3 to estimate the number of cycles to reach a 20% reduction in Ah capacity, one obtains the estimated cycle life values given in Table 5, which show that dynamic cycling does not have a significant negative effect on cycle life for either lithium battery chemistry and in fact for the NiCoAl chemistry, the effect of dynamic cycling on Ah degradation is positive. Due to the unplanned deep discharges of the K2 module being dynamic cycled, its cycle life was much shorter than the other modules, but it seems likely its cycle life would have been comparable to that of the K2 module being cycled at constant current if its discharge level had been 80%.
Table 5. Estimated cycle life for the LiNiCoAl and LiFePO4 for constant current cycling and dynamic pulse cycling.
Lithium battery Chemistry
Estimated cycle life for a 20% degradation in Ah capacity
Estimated cycle life for a 50% increase in resistance Panasonic NiCoAl-based*
Constant current cycling 1000 1750
Dynamic pulse cycling 1500 3050
K2 Energy FePO4-based*
Constant current cycling 1620 2000
Dynamic pulse cycling 600** Resistance increase less than
10% until Ah limit was reached *all the modules consisted of 18650 cells
** module was discharged to 87% of its original Ah capacity rather than about 80%.
0 60 120 180 240 300 360 420 480 540 600 660 720 0.86
0.88 0.9 0.92 0.94 0.96 0.98 1 1.02
Cycle number
Re
la
ti
ve
c
a
pa
c
it
y [%]
Relative capacity for constant current cycling Relative capacity for dynamic pulse cycling
a. Capacity degradation curves for LiNiCoAl module, in which the module was discharged at C/2.7-rate, room temperature (25℃)
0 60 120 180 240 300 360 420 480 540 600 660 720 0.86
0.88 0.9 0.92 0.94 0.96 0.98 1 1.02
Cycle number
R
e
la
ti
ve
c
a
pa
c
it
y
[%
]
Relative capacity for constant current cycling Relative capacity for dynamic pulse cycling
[image:8.596.128.465.97.305.2]b. Capacity degradation curves for LiFePO4 module, in which the module was discharged at C/3.1-rate, room temperature (25℃)
Figure 3. Ah capacity as a function of cycle number for the LiNiCoAl and LiFePO4 modules
0 60 120 180 240 300 360 420 480 540 600 660 720 0.95
1 1.05 1.1 1.15 1.2 1.25 1.3 1.35 1.4
Cycle number
Re
la
ti
ve
re
si
st
a
nc
e
[%]
Discharge R for constant current cycling (-5A) Charge R for constant current cycling (5A) Discharge R for dynamic pusle cycling (-5A) Charge R for dynamic pulse cycling (5A)
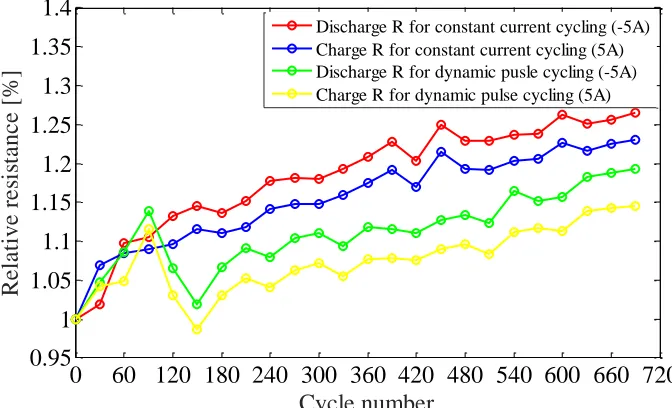
a. Resistance increase curves with cycle number for LiNiCoAl module, in which the resistance was determined from an 8 sec, 5A pulse at 60% SOC
0 60 120 180 240 300 360 420 480 540 600 660 720 0.95
1 1.05 1.1 1.15 1.2 1.25 1.3 1.35 1.4
Cycle number
Re
la
ti
ve
re
si
st
a
nc
e
[%]
Discharge R for constant current cycling (-5A) Charge R for constant current cycling (5A) Discharge R for dynamic pusle cycling (-5A) Charge R for dynamic pulse cycling (5A)
[image:9.596.128.464.75.279.2]b. Resistance increase curves with cycle number for LiFePO4 module, in which the resistance was determined from an 8 sec, 4A pulse at 60% SOC
Figure 4. Module resistance as a function of cycle number for the LiNiCoAl and LiFePO4 modules at room temperature (25℃)
4.1. Indication of the State-of-health of the battery
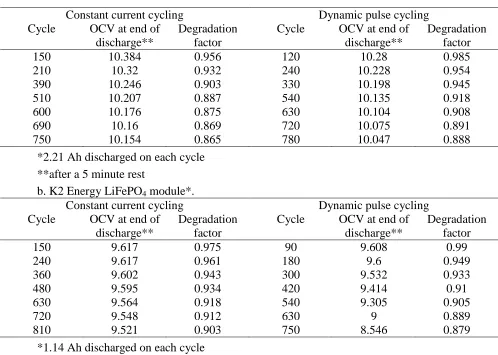
Table 6. Changes in the end of discharge OVC after cycling. a. Panasonic LiNiCoAl module*.
Constant current cycling Dynamic pulse cycling
Cycle OCV at end of discharge**
Degradation factor
Cycle OCV at end of discharge**
Degradation factor
150 10.384 0.956 120 10.28 0.985
210 10.32 0.932 240 10.228 0.954
390 10.246 0.903 330 10.198 0.945
510 10.207 0.887 540 10.135 0.918
600 10.176 0.875 630 10.104 0.908
690 10.16 0.869 720 10.075 0.891
750 10.154 0.865 780 10.047 0.888
*2.21 Ah discharged on each cycle **after a 5 minute rest
b. K2 Energy LiFePO4 module*.
Constant current cycling Dynamic pulse cycling
Cycle OCV at end of discharge**
Degradation factor
Cycle OCV at end of discharge**
Degradation factor
150 9.617 0.975 90 9.608 0.99
240 9.617 0.961 180 9.6 0.949
360 9.602 0.943 300 9.532 0.933
480 9.595 0.934 420 9.414 0.91
630 9.564 0.918 540 9.305 0.905
720 9.548 0.912 630 9 0.889
810 9.521 0.903 750 8.546 0.879
*1.14 Ah discharged on each cycle **after a 5 minute rest
This effect is shown in the data presented in Table 6 for the two lithium battery chemistries. Data are shown for constant current and dynamic pulse discharges of the modules.
The data for the NiCoAl module show a systematic variation in the OCV as the module is cycled and the Ah capacity of the module slowly degrades. There is a reasonable variation of the OCV with the state-of-the degradation, but there are also differences due to the type of discharge. This complicates the application of this approach to determine the cell degradation from OCV data. A further complication is accounting for variations in the depth-of-discharge before each recharge of the battery.
4.2. Mechanisms of the degradation
In the present study there was no attempt to determine the mechanisms that caused the degradation in the Ah capacity and the resistance of the batteries as they were cycled. The mechanisms [17-23] would be of considerable interest especially if they are different for the constant current and dynamic pulse cycling. These differences can be studied by applying the differential voltage technique [25] to the charging data and the constant current discharge data. This technique involves tracking (-Q0, dV/dQ) during the charging and noting the SOC at which there are large changes in the parameter. As discussed in [11, 13 16, 26], these changes can be related to particular mechanisms of degradation.
4.3. Comparisons with previous life cycle testing of lithium-ion batteries
[image:11.596.36.558.531.757.2]As indicated in the Introduction, the present testing of lithium batteries was undertaken to evaluate the effect of load leveling on the cycle life of the two lithium battery chemistries. It was expected that the testing would show that load-leveling the power demand, as can be done using SCs, would significantly increase the cycle life of the batteries. As noted in the previous section, this was not the outcome of the present testing. The test results indicated that the performance of the modules tested degraded more rapidly for constant current (load leveled) discharges than for dynamic pulsed discharges at the same average current. This was found most clearly in the case of the NiCoAl battery chemistry for both the degradation of the Ah capacity and the resistance. In the case of the LiFePO4 battery chemistry, the resistance clearly degraded more rapidly in the constant current cycling than for the dynamic pulse cycling of module. In general, in the present testing, constant current cycling did not indicate an increase in battery cycle life as expected for either battery chemistries, but the effect on the cycle life of the discharge profile was not large for either battery chemistry.
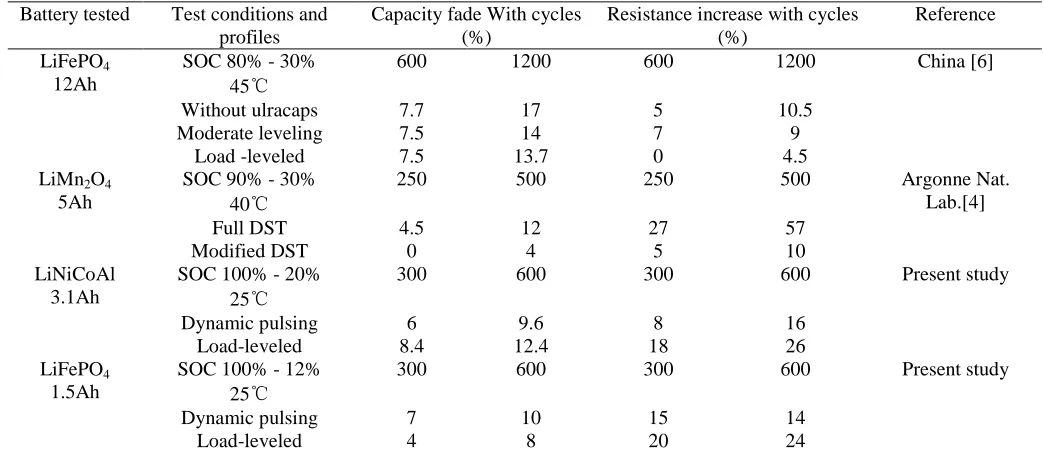
Table 7. Summary of life cycle test data from various sources.
Battery tested Test conditions and
profiles
Capacity fade With cycles (%)
Resistance increase with cycles (%)
Reference
LiFePO4
12Ah
SOC 80% - 30%
45℃
600 1200 600 1200 China [6]
Without ulracaps 7.7 17 5 10.5
Moderate leveling 7.5 14 7 9
Load -leveled 7.5 13.7 0 4.5
LiMn2O4
5Ah
SOC 90% - 30%
40℃
250 500 250 500 Argonne Nat.
Lab.[4]
Full DST 4.5 12 27 57
Modified DST 0 4 5 10
LiNiCoAl 3.1Ah
SOC 100% - 20%
25℃
300 600 300 600 Present study
Dynamic pulsing 6 9.6 8 16
Load-leveled 8.4 12.4 18 26
LiFePO4
1.5Ah
SOC 100% - 12%
25℃
300 600 300 600 Present study
Dynamic pulsing 7 10 15 14
It is of interest to compare the findings of the present tests with those available in the literature for cycle life testing of lithium batteries. As discussed in the Introduction, there is much literature on life cycle testing of lithium batteries [7-16] and modeling of battery degradation [17-22]. This is particularly true for the lithium iron phosphate chemistry [10-14]. Most of the previous studies were concerned with batteries undergoing constant current discharges at different rates and did not consider pulsed discharges with sequences of charge and discharge pulses. However, there have been several studies [4, 6] that are closely pertinent to the present cycle life testing. These studies have involved extensive cycle life testing of lithium batteries using pulsed profiles with both charge and discharge steps. A summary of the life cycle data pertinent to the present study is given in Table 7. In general, the test results from the present study are not in agreement with results from the [4, 6] regarding whether load leveling increases the cycle life for dynamic discharge cycles like those encountered in vehicle applications. The reasons for this disagreement are considered in the following paragraphs.
One of the difficulties in comparing the data from different studies is that the test conditions, charging algorithms, and discharge profiles are quite different as shown in Table 7. The state-of-charge range and the temperature utilized in the cycling are particularly important. There are also large differences in the discharge profiles used in the cycling particularly in the terms of the C-rates of the charge and discharge pulses, the average current of the discharge, and the contribution of the charge pulses in the profile to recharging the batteries. Most of the life cycle testing in the literature has been done using the DST (Dynamic Stress Test) cycle [27] used in USABC testing procedures. The DST cycle is specified based on the maximum power density (W/kg) assumed for the cell being tested. The fraction of the charge (Ah) returned to the cell in charge pulses in the DST is relatively low (less than 20%). In some of the cycling studies using the DST profile, it was found that the effect of the discharge profile on the cell cycle life was large [12, 13] and in others it was small [10, 11]. In all cases, the effect of temperature (40-45deg C compared to 25deg C) was large and the degradation of the cells with dynamic cycling significantly increased at the higher temperatures. This could explain the large difference between the Argonne Laboratory tests results and the present data shown in Table 7. As noted previously, all the present testing was done at room temperature.
5. SUMMARY AND CONCLUSIONS
modules were fully charged before each cycle and were discharged to 80% of the initial Ah capacity of the cells in each cycle. The dynamic pulse profiles consisted of sequences of charge/discharge pulses at currents up to 3-4C. The average current for both discharge profiles was C/2. The degradation of the modules was tracked in terms of their Ah capacity and resistance as the cycling proceeded. The modules were cycled for about 750 cycles over a period of about six months.
The cycling results of the present study were unexpected. For both lithium chemistries, the present data indicated that the modules degraded more rapidly with constant current cycling than using the dynamic pulse profiles. The cycling results in the literature from related previous studies of lithium batteries indicated that load-leveling the battery reduced to varying degrees the rate of degradation for both Ah capacity and resistance [4, 6]. However, the rate of degradation varied significantly between those studies (see Table 7).
One of the difficulties in comparing the data from different studies is that the test conditions, charging algorithms, and discharge profiles are quite different as shown in Table 7. Most of the life cycle testing in the literature has been done using the DST (Dynamic Stress Test) cycle used in USABC testing procedures [28]. In some of the cycling studies using the DST profile, it was found that the effect of the discharge profile on the cell cycle life was large and in others it was small. In all cases, the effect of temperature (40-45deg C compared to 25deg C) was large and the degradation of the cells with dynamic cycling significantly increased at the higher temperatures. This could explain the large difference between the Argonne Laboratory tests results at 40 deg C and the present data at room temperature shown in Table 7. It is clear that the differences in test conditions and profiles can have a significant effect on the cycling results and consequently whether load-leveling increases the cycle life of the batteries. Clarification of the uncertainty of the effect of load-leveling on battery cycle life is particularly important in connection with the use of SCs in vehicle applications.
References
1. Y. Zhang, B. Liu, T. Zhang and B. Guo, Int. J. Electrochem. Sc., 9 (2014) 4190.
2. M. Masih-Tehrani, M.R. Ha'iri-Yazdi, V. Esfahanian and A. Safaei, J. Power Sources, 244 (2013) 2.
3. K. Gokce and A. Ozdemir, Int. J. Electrochem. Sc., 11(2016) 1228.
4. C. G. Hochgraf, J.K. Basco, T.P. Bohn and I. Bloom, J. Power Sources, 246 (2014) 965.
5. S. Martinovic, M. Vlahovic, E. Ponomaryova, I.V. Ryzhkov, M. Jovanović, I. Bušatlić, T. Volkov Husović and Z. Stević, Int. J. Electrochem. Sc., 12(2017) 7287.
6. C. Zhao, H. Yin and C. Ma, IEEE T. Power Electr., 31 (2016) 3989.
7. G. Sikha, P. Ramadass, B.S. Haran, R.E. White and B.N. Popov, J. Power Sources, 122 (2003) 67. 8. V. Muenzel, A.F. Hollenkamp, A.I. Bhatt, J.D. Hoog, M. Brazil, D.A. Thomas and I. Mareel, J.
Electrochem. Soc., 162 (2015) 1592.
9. R.B. Wright, J.P. Christophersen, C.G. Motloch, J.R. Belt, C.D. Ho, V.S. Battaglia, J.A. Barnes, T.Q. Duong and R.A. Sutula, J. Power Sources, 119 (2003) 865.
10.M. Safari and C. Delacourt, J. Electrochem. Soc., 158 (2011) 1123.
11.M. Safari, M. Morcrette, A. Teyssot and C. Delacourt, J. Electrochem. Soc., 156(2009) 145. 12.D. Anseán, M. González, V.M. García, V.M. García, J.C. Viera, J.C. Antón and C. Blanco, IEEE T.
Ind. Appl., 51 (2015) 1855.
13.D. Anseán González, PhD Thesis, Universidad de Oviedo, Spain, July 2015.
H. Corte Leon, Electric Vehicle Symposium, 26 (2012) 150.
15.M. Ouyang, X. Feng, X. Han, L. Lu, Z. Li and X. He, Appl. Energ., 165 (2016) 48. 16.Y. Zhang, C.Y. Wang and X. Tang, J. Power Sources, 196 (2011) 1513.
17.A. Barre, B. Deguilhem, S. Grolleau, M. Gérard, F. Suard and D. Riu, J. Power Sources, 241 (2013) 680.
18.M. Safari and C. Delacourt, J. Electrochem. Soc., 158 (2011) 1436.
19.E. Saraasketa-Zabala, I. Gandiaga, E. Martinez-Laserna, L.M. Rodriguez-Martinez and I. Villarreal, J. Power Sources, 275 (2015) 573.
20.M. B. Pinson and M.Z. Bazant, J. Electrochem. Soc., 160 (2013) 243.
21.J. Schmalstieg, S. Kabitz, M. Ecker and D.U. Sauer, EVS27, Barcelona, Spain,2013, 1-12. 22.M. Berecibar, I. Gandiaga, I. Villarreal, N. Omar, J. Van Mierlo and P. Van den Bossche, Renew.
Sust. Energ. Rev., 56 (2016) 572.
23.C. Zhang, F. Yan, C. Du, J. Kang and R. Turkson, Energies, 10 (2017) 110. 24.D. Le and X. Tang, PHM Society, (2011) 367.
25.I. Bloom, A.N. Jansen, D.P. Abraham and K.L. Gering, J. Power Sources, 139 (2005) 295. 26.M. Berecibar, M. Garmendia, I. Gandiaga, J. Crego and I. Villarreal, Energy,103 (2016) 784. 27.J. Zhao, Y. Gao, A.F. Burke, J. Power Sources, 363 (2017) 327.
28.USABC Electric Vehicle Battery Test Procedures Manual, DOE/ID-10479, Revision 2, January 1996.