Numeracy
EFFECTIVE TEACHING
AND LEARNING
Diana Coben, Margaret Brown
Valerie Rhodes, Jon Swain, Katerina Ananiadou
Published by the National Research and Development Centre for Adult Literacy and Numeracy
This document is also available in pdf and text-only format from the NRDC's website, www.nrdc.org.uk
For information on alterative formats, please contact:
Emily Brewer
Marketing and Publications Officer Institute of Education
University of London Tel: 020 7911 5501 Email: [email protected]
We welcome feedback on the content and accessibility of this publication. This should be sent to:
Publications NRDC
Institute of Education 20 Bedford Way London WC1H 0AL
Telephone: +44 (0)20 7612 6476 Fax: +44 (0)20 7612 6671 email: [email protected]
ISBN 1-905188-26-9
© Crown Copyright 2007
Extracts from this publication may be used or reproduced for non-commercial, research, teaching or training purposes on condition that the source is acknowledged.
NRDC is a consortium of partners led by the Institute of Education, University of London (see back cover for a list of members) and is part of the Bedford Group for Lifecourse and Statistical Studies at the IoE. www.ioe.ac.uk/bedfordgroup
RESEARCH TEAM
Principal investigators Diana Coben, Margaret Brown Researchers
Valerie Rhodes, Jon Swain, Katerina Ananiadou Researcher and administrative support Peter Brown
Teacher researchers
Jackie Ashton, Debbie Holder, Sandra Lowe, Cathy Magee, Sue Nieduszynska, Veronica Storey
SERIES EDITOR John Vorhaus
CONTENTS
ACKNOWLEDGMENTS 5
PREFACE 6
1 EXECUTIVE SUMMARY 7
1.1 The Effective Practice Studies 7
1.2 The numeracy study 7
1.3 Main findings 8
1.4 Recommendations 9
1.5 Limitations to this research 10
2 CONTEXT 11
2.1 The policy background 11
2.2 The Effective Practice Studies 12
2.3 Sample and methods 13
3 TEACHER AND LEARNER CHARACTERISTICS 16
3.1 Teacher profiles 16
3.2 Learners’ profiles 16
3.3 Summary 17
4 THE LEARNERS AND THEIR EXPERIENCES 18
4.1 Differences between learning numeracy as a child and as an adult 18 4.2 Motivations for joining and continuing to attend the course 19
4.3 Attitudes and dispositions towards numeracy 20
4.4 Views on the course 22
4.5 Perceptions of what makes a good numeracy teacher 22
4.6 Summary 24
Numeracy
EFFECTIVE TEACHING
5 LEARNERS’ PROGRESS 25
5.1 What counts as progress? 25
5.2 Gains in numeracy attainment measured between two time points 26 5.3 Relationship between attainment gains and learners’ and teachers’
background characteristics 29
5.4 Differential gains for different levels and areas of mathematics 31
5.5 Changes in learners’ attitudes 32
5.6 Relations between learners’ attitudes and their characteristics 33
5.7 Summary 33
6 TEACHERS’ PRACTICES 34
6.1 Teachers’ perceptions of numeracy teaching 34
6.2 Classroom characteristics 39
6.3 Teaching typologies and other factors 45
6.4 Summary 46
7 TEACHING AND LEARNING: CORRELATIONS BETWEEN PRACTICE AND
PROGRESS 47
7.1 Correlations between class characteristics, progress and attitude 47 7.2 Correlations between teaching approaches and gains in
progress and attitude 50
7.3 Analysis of features of practice in classes where learners made
the greatest progress 51
7.4 An example of effective practice 55
7.5 Summary 57
8 DISTINCTIVE ASPECTS OF THE NUMERACY PROJECT 58
8.1 What is distinctive about adult numeracy teaching? 58
8.2 What is distinctive about this study? 58
9 CONCLUSIONS 60
9.1 Reflections 60
9.2 Implications and recommendations for practice, teacher
education and CPD, policy and research 60
REFERENCES 64
APPENDICES 69
Appendix A: Contact details of the research team 69
Appendix B: A note on ethnicity, nationality and language 69
Acknowledgements
The authors would like to thank all the teachers and learners who participated in this project.
Peer review
This report was peer reviewed. The critical reviewers from research and practice were:
Gail Fitzsimons, Monash University, Australia Katherine Safford, St Peter’s College, USA Jan Tetley, Wakefield College
Malcolm Swan, University of Nottingham Pat Dreyer, CEP Associates
Cathy France, Thomas Danby College Terry Maguire, University of Limerick
Preface
The Skills for LifeStrategy in England has led to unprecedented investment in adult literacy, language and numeracy (LLN), major reforms of teacher education and training, and the introduction of national standards, core curricula and assessment to inform teaching and learning. We have a unique opportunity to make a step change in improving levels of adult skills. But until recently too little was known about effective teaching and learning practices, and reports from Ofsted and the Adult Learning Inspectorate repeatedly drew attention to the quality of teaching, and the need for standards to improve.
It has been a strategic priority at the National Research and Development Centre for Adult Literacy and Numeracy (NRDC) to investigate teaching and learning practices in all the subject areas and settings in Skills for Life, to report on the most promising and effective practices, and to provide teachers and trainers, along with policy-makers and researchers, with an unparalleled evidence base on which to build on the progress already made.
Our findings and recommendations are reported here, and in the four companion reports covering reading, writing, ESOL and ICT. The five studies, which have been co-ordinated by NRDC Associate Director John Vorhaus, provide material for improving the quality of teaching and learning, and for informing developments in initial teacher education and continuing professional development (CPD). We are also preparing a range of practitioner guides and development materials, as a major new resource for teachers and teacher educators. They will explore and develop the examples of good and promising practice documented in these pages.
Until recently adult numeracy was under-researched and underdeveloped, and it was often not distinguished from literacy in policy documents and inspection reports. However, the profile of numeracy has been steadily rising, following confirmation by national and international surveys of low levels of skill amongst the adult population. This study is the largest undertaken into adult numeracy in the UK, and it represents a substantial advance in our understanding of the practices that contribute to successful teaching and learning.
1 Executive summary
1.1 The Effective Practice Studies
The five NRDC Effective Practice Studies explore teaching and learning in reading, writing, numeracy, ESOL and ICT, and they set out to answer two questions:
1. How can teaching, learning and assessing literacy, numeracy, ESOL and ICT be improved? 2. Which factors contribute to successful learning?
Even before NRDC was set up it was apparent from reviews of the field (Brooks et al., 2001; Kruidenier, 2002) that there was little reliable research-based evidence to answer these questions. Various NRDC reviews showed that progress in amassing such evidence, though welcome where it was occurring, was slow (Coben et al., 2003; Barton and Pitt, 2003; Torgerson et al., 2003, 2004, 2005). Four preliminary studies on reading, writing, ESOL and ICT, were undertaken between 2002 and 2004 (Besser et al., 2004; Kelly et al., 2004; Roberts et al., 2004; Mellar et al., 2004). However, we recognised the urgent need to build on these in order greatly to increase the research base for the practice of teaching these subjects.
The inspiration for the design of the five projects was a study in the US of the teaching of literacy and English language to adult learners for whom English is an additional language (Condelli et al., 2003). This study was the first of its kind, and the lead author, Larry Condelli of the American Institutes for Research, has acted as an expert adviser on all five NRDC projects.
The research began in July 2003 and was completed in March 2006. It set out to recruit and gather information on 500 learners in each study, assess their attainment and attitudes at two points during the year in which they were participating in the study, interview both learners and teachers, observe the strategies the teachers used, and correlate those strategies with changes in the learners’ attainment and attitudes.
The ICT study differed from the others in that its first phase was developmental, its sample size was smaller, and it had a shorter timescale, completing in March 2005.
1.2 The numeracy study
We investigated approaches to the teaching of numeracy, aiming to identify the extent of learners’ progress, and to establish correlations between this progress and the strategies and practices used by teachers.
The study involved 412 learners and 34 teachers in 47 classes. Two-thirds of the classes were in further education (FE) colleges. The average teaching session was just under two hours and average attendance in class was eight learners.
observed between one and four times during each course. Background information was collected on teachers and learners, and we carried out interviews with 33 teachers and 112 learners.
1.3 Main findings
Progress
We found evidence of significant progress, with an average gain of 9 per cent in test scores, although there was a wide range of average gains between different classes.
Learners’ attitudes were more positive at the end of the course, with the changes tending to be greatest for older people.
Once learners overcome initial anxiety about the course and about mathematics, numeracy courses can have a significant and positive effect on their identities. They can improve confidence and self-esteem, and enable learners to develop new aspirations and form new dispositions towards learning.
For some learners, to maintain their level of skills, knowledge and understanding is a sign of personal progress.
Time to learn
Evidence from the National Center for the Study of Adult Learning and Literacy (NCSALL) in the US suggests that learners require between 150 and 200 hours of study if they are to progress by one level within the Skills for Lifequalification framework. However, although average attendance by learners between our first and second assessments was only 39 hours, we found that many had made significant progress. Others needed longer to consolidate their learning.
Teaching strategies
Teachers valued ‘flexibility’ as a key feature of effective practice. The diversity of learners, contexts and session lengths meant that no one pattern of lesson activity appeared to be optimal.
A wide range of different teaching approaches was observed, although whole class and individual work predominated.
Most teachers gave clear explanations, which were much valued by learners. They also broke work down into smaller steps and gave feedback to learners about their work.
Most teachers followed a set scheme of work, and few incorporated learners’ personal interests. It was also less usual for teachers to differentiate work, make connections to other areas of mathematics, or ask higher-order questions to encourage higher-level thinking or probe learners’ misconceptions.
Teaching and learning relationships
Over 90 per cent of learners interviewed expressed a high level of satisfaction with their course and their teacher. Learners were usually highly engaged. They were often but not always challenged and stretched, were given time to gain understanding, and the majority had their individual needs met.
Learners recognised that the relationship between the teacher and effective learning was critical. It was important for teachers to develop good relationships with learners and to treat, and respect, them as adults. Classroom observation indicated that teachers were enthusiastic, generous in giving praise, and there was a high level of mutual respect.
Teachers’ qualifications
The teachers were generally experienced and well-qualified, with many having previously taught mathematics in primary and/or secondary schools. Teachers’ subject knowledge was generally adequate.
Twenty-seven (79 per cent) of the 34 teachers reported having a formal qualification in mathematics or a related subject (e.g. science). Thirty teachers (88 per cent) reported having a teaching qualification. Six (18 per cent) of the teachers reported having a subject-specific Level 4 qualification for teaching numeracy to adults.
It is often assumed that individuals holding high qualifications in mathematics are able to teach basic concepts at lower levels of mathematics. We did not always find evidence of this. Some teachers relied on methods they had been taught at school.
1.4 Recommendations
Development work and quality improvement
In the Subject Specifications for Adult Numeracy, and in generic courses (e.g. Cert Ed. or PGCE), there should be a requirement for teachers to have a firm understanding of basic concepts: place-value, multiplication and division, for example.
Teachers need a firm grasp of subject and pedagogical knowledge, and also subject-specific pedagogic knowledge. This enables them to be flexible in their approaches, and to cater to the diversity of learners and provision in adult numeracy.
Policy
Adult numeracy education should be seen as part of mathematics education, and as a discrete subject in relation to adult literacy and other Skills for Lifeareas. This should be reflected in policy documents and in the organisation and inspection of provision, so that, for example, adult numeracy provision is effectively co-ordinated with other mathematics provision offered by colleges and other organisations.
Research
A bank of secure, reliable and valid questions should be available to match assessment questions to individual teaching programmes, and therefore to provide a more genuine test of learning in relation to teaching.
More research is required to explore learner and teacher identities. Learners’ identities affect attitudes, motivations, dispositions towards mathematics and education in general, relations with peers and teachers, and future expectations and aspirations. Teacher
identities also matter: we need to know how much personal investment teachers make both as numeracy teachers and as mathematicians.
1.5 Limitations to this research
We acknowledge the following limitations to our research.
The heterogeneous nature of adult numeracy teaching, the range of learners and the number of variables amongst teachers and learners, make it difficult to identify effective practices and factors that can be generalised with confidence across the whole sector.
There were problems finding an assessment instrument that was both short and appropriate to sensitively and validly measure progress across such a diverse learner group. There were particular difficulties for adults with lower ability levels, and with reading or language difficulties (two in every five learners in the sample spoke English as an additional language).
The areas of mathematics taught in class may not have matched those covered in the assessment we used. We therefore cannot be certain that newly correct answers in the second assessment resulted from class teaching rather than other sources of learning.
The need for the assessment instrument to be practicable – not take up too much class time – meant that there was an inevitable trade-off between getting more information and taking up too much of the learners’ time in class.
The short teaching time of only 39 hours between first and second assessments is likely to have been too short to show evidence of more substantial progress.
Some courses were designed on a roll-on/roll-off basis which meant that some learners who had taken the first test were no longer there at the second. Equally, new learners may have arrived who had not taken the first assessment and were therefore ineligible for the second. About 40 per cent of learners left their course for a variety of reasons, and the effect of this was compounded when researchers came to administer the second assessment if the class was poorly attended on that particular day.
Factors which cannot easily be determined in a large-scale survey may have had more influence on their learning than any specific, easily observed difference in teacher
2 Context
This chapter sets the study within the current national policy context, and as part of the research agenda developed by the NRDC. It states the research aims, and provides information on the sample, methods and ethical considerations.
2.1 The policy background
Until comparatively recently, adult numeracy has been researched and under-developed. However, the low levels of numeracy skill among adults, as revealed by national and international surveys, have begun to make numeracy an important area for research. The study is set within the context of the Government’s Skills for LifeStrategy to improve adult literacy and numeracy in England (DfEE, 2001), and took place against a backdrop of policy changes in adult numeracy education (DfEE, 1999, 2001; QCA, 2000; DfES, 2001; DfES/FENTO, 2002), post-14 mathematics education and training (Smith, 2004; Tomlinson, 2004; DfES, 2005a), initial teacher education (ITE) (DfES/FENTO, 2002) and concerns about levels of skill in the adult population (DfES/DWP/HMT 2005). The recent interim review by Lord Leitch for HM Treasury, Skills in the UK: The long term challenge, calls for the UK to ‘become world class on skills – for all of our sakes’ (Leitch, 2005: 2). Numeracy is key to achieving that aim and, as the title of a recent review of evidence from the British Birth Cohort Studies shows, Numeracy Matters Moreto individuals and society (Parsons and Bynner, 2005).
In Skills for Life, literacy and numeracy are promoted as basic skills to be acquired and utilised by adults in the workplace and elsewhere. Numeracy is defined as the ability ‘to use mathematics at a level necessary to function at work and in society in general’ (DfEE, 1999). The Skills for Life target is for 1.5 million adults to improve their literacy and numeracy skills by 2007 (DfES 2003a). This target should be seen against the background of the extent of need for literacy and numeracy in the adult population. The Skills for Life Surveycommissioned by the Department for Education and Skills (DfES) found that nearly half of all adults of working age in England (47 per cent; 15 million adults) were classified at or below the level expected of an average 11-year-old in numeracy (DfES, 2003a: 19).
At the same time, a disturbing picture of adult numeracy education began to emerge, with a shortage of experienced teachers and teacher trainers. For example, a report by the
Inspectorate in 2003 found that numeracy is taught less frequently than literacy, and there is less demand for numeracy despite equivalent levels of need (in fact, greater need, according to the Skills for Life Survey). The report also found there is a need for greater expertise in teaching numeracy, and numeracy is too often taught by rote rather than by understanding numerical concepts (ALI/OFSTED, 2003). The Smith Report acknowledges that the adult numeracy strategy is challenging and demanding for teachers and learners alike (Smith, 2004). Work is currently under way on implementing the Smith recommendations, including measures designed to raise the profile of mathematics, improve the supply of teachers and support CPD, while reviewing the curriculum, assessment and qualifications frameworks.
the Office for Standards in Education (OFSTED) and the Adult Learning Inspectorate (ALI)1.
However, little is known about effective practice in adult numeracy education from a research perspective and the tendency has been for numeracy to be overshadowed by literacy in official reports, including Inspection reports, so that information about adult numeracy is often impossible to untangle from that on adult literacy. The relationship between effective teaching and successful learning in adult numeracy has yet to be established; this study represents a step towards this goal.
2.2 The Effective Practice Studies
The project reported here was conducted as part of the research agenda developed by the NRDC, which is part of the Skills for LifeStrategy (DfEE, 2001) of the DfES in England.
The project was one of a suite of four which had the common aim of investigating effective teaching of literacy, language and numeracy to adults. The skills which the four projects covered, and the organisations which conducted them, were:
Reading University of Sheffield
Writing Learning and Skills Development Agency
English for speakers of other
languages (ESOL) University of Leeds and King’s College London
Numeracy King’s College London.
A fifth project covered ICT; this was conducted by the Institute of Education, University of London. It differed in that its first phase was developmental, rather than evaluative; as a consequence, only the second phase of its data-gathering resembled that of the other four projects, and its final sample size was smaller. Also, it had a shorter timescale, being completed in March 2005.
The other four projects all began in July 2003 and were completed in March 2006. The motives for them were the questions posed in NRDC’s Strategy, published in July 2003 (NRDC,
2003:30):
■ How can teaching, learning and assessing literacy, numeracy and ESOL be improved? ■ What factors contribute to successful learning?
Even before the NRDC was set up it was apparent from reviews of the field (Brooks et al., 2001; Kruidenier, 2002) that little reliable research-based evidence existed to answer these questions, and various NRDC reviews showed that progress in amassing such evidence, though welcome where it was occurring, was slow (Coben et al., 2003; Barton and Pitt, 2003; Torgerson et al., 2003, 2004, 2005). Four preliminary studies, on reading, writing, ESOL and ICT, were undertaken between 2002 and 2004 (Besser et al., 2004; Kelly et al., 2004; Roberts et al., 2004; Mellar et al., 2004, respectively). However, NRDC recognised a need to build on these to expand the research base on the practice of teaching these subjects and therefore
the information available to policy-makers and professionals, both teachers and trainers.
The inspiration for the design of the reading, writing, ESOL and numeracy projects, and the second year of the ICT project, was a US study of the teaching of literacy and English
language to adult learners for whom English is an additional language (Condelli et al., 2003).
The projects were in two phases, in academic years 2003/04 and 2004/05. The targets across the two years were to recruit and gather background data on about 250 learners, assess their attainment and attitudes at two points during the year in which they were in the study, interview both learners and teachers, observe the strategies their teachers used, and correlate those strategies with changes in the learners’ attainment and attitudes.
2.3 Sample and methods
The numeracy research project team consisted of the project directors, professional researchers, and six trained teacher-researchers.
Adult numeracy tuition is diverse in its range of provision, settings, teachers and the different purposes of learners; it is offered both as a discrete subject and ‘embedded’ in other subjects and vocational areas. Its purposes include academic and recreational study, vocational training, basic skills and workforce development and the enhancement of parents’ involvement with children and schools. Learning contexts include further education (FE), work-based learning, Jobcentre Plus, UfI learndirect, adult and community education (ACE), family numeracy and prisons. Courses vary in length, with a variety of accreditation and qualifications, and may have titles that do not emphasise their numeracy content, making it difficult to track down relevant provision. There is a wide range of learners of different ages, with various experiences of schooling and a variety of motivations, dispositions, aspirations and needs, including more non-traditional adult learners and 16 to 19-year-olds. Reliable data on the adult numeracy teaching workforce are unavailable, but it is likely that such teachers vary in their experience of teaching adults in different contexts, their knowledge of mathematics and numeracy/mathematics pedagogy (issues around teachers’ subject-specific pedagogy are discussed in Chapter 9), and their teaching qualifications. Many teach part-time and have originally taught in other curriculum areas such as literacy and ESOL. We aimed to reflect the diversity of numeracy provision, and the range of adult numeracy learners, and selected our sample accordingly.
The research was undertaken in learning contexts throughout England, including adult numeracy, Return to Employment, Foundation ICT, family numeracy, GCSE, workplace-based groups, JobcentrePlus, a prison and a ‘vocational taster’ numeracy course for young people with learning difficulties, in both day and evening classes. Providers included FE colleges, a neighbourhood college, a community group, the Army, a prison, a local education authority (LEA) and a private training provider.
we find as many classes as we would have liked in which numeracy is taught as part of another subject. However, that said, settings were selected so as broadly to reflect the range of settings nationally and the proportion of learners studying in such settings. More than two million of the 2.4 million people who took up Skills for Lifecourses between April 2001 and July 2004 studied in FE (House of Commons Committee of Public Accounts, 2005); the number studying numeracy is not separately identified. We also did not seek to recruit either especially high- or low-performing teachers, but because of the predominance of settings found through personal contacts, the sample is likely to include a higher than average proportion of
experienced teachers in established classes. We hope that our sample may be reasonably representative of the teaching workforce, although since all teachers were in a sense volunteers, there may be some bias towards those who are more effective. However, since there is little reliable evidence on the nature and qualifications of those teaching numeracy and non-specialist mathematics to adults, it is impossible to judge the representativeness of the teachers in our study.
A total of 4122learners participated in the study, and we observed 34 teachers and 47 classes,
17 in Phase 1 (2003/04) and 30 in Phase 2 (2004/05). Thirty-one of these classes were in FE colleges (11 classes of 16 to 19-year-olds and 20 classes with adults, including ESOL, ICT, etc.), four in adult/neighbourhood colleges, two in family numeracy, four in workplaces, two Jobcentre Plus, one Army training course, two in prisons and one private training provider. More than half of the 47 classes (66 per cent, n=31) were based in FE colleges. By comparison, 73 per cent of all Skills for Lifenumeracy learners (n=265,846) were in FE nationally in 2003/04 and 79 per cent were 19 or older (Learning & Skills Council, 2005).
Class sizes ranged from one to 23 learners, with an average size of eight. A minority of the classes observed (28 per cent) had a learning support assistant or volunteer. Most classes were in the daytime, though around 13 per cent started in the evening; sessions lasted for between one and three hours, with an average of just under two hours.
Phase 1 was used to develop our research instruments, which we trialled extensively at the outset of the project. In both phases 1 and 2, we assessed learners at the beginning3, Time 1
(T1), and near the end, Time 2 (T2), of their learning programmes, undertook systematic observations of teaching sessions, surveyed learners’ attitudes to numeracy, interviewed all teachers and a sample of learners and gathered background information on all learners and teachers. (A note on issues of ethnicity, nationality and language is given in Appendix B). A total of 250 learners took the assessment at both T1 and T2, and 243 completed the attitude survey at both times. We included only those classes where more than 30 hours of tuition were planned. However, because of the intermittent nature of work in workplace settings, this was not always achieved. The average number of hours attended between pre- and
post-assessment for each class was 39.
As well as taking a correlative approach to the quantitative data, in order to investigate
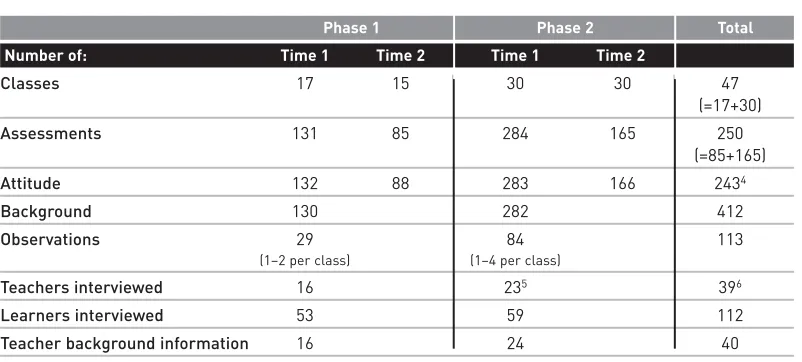
possible factors associated with effective practice the project has also provided a more detailed qualitative description of teacher and learner attitudes and experiences to assist with insight into causation. These descriptions are largely based on in-depth, semi-structured interviews involving a total of 112 learners and 34 teachers. A summary of data is given below:
2 This figure is based on data from the learner background survey.
Table 2.1 Summary of data collected from 47 numeracy classes 2004–05
Phase 1 Phase 2 Total
Number of: Time 1 Time 2 Time 1 Time 2
Classes 17 15 30 30 47
(=17+30)
Assessments 131 85 284 165 250
(=85+165)
Attitude 132 88 283 166 2434
Background 130 282 412
Observations 29 84 113
(1–2 per class) (1–4 per class)
Teachers interviewed 16 235 396
Learners interviewed 53 59 112
Teacher background information 16 24 40
The assessment instrument consisted of 20 items from the national Skills for Life Survey, in multiple-choice format and from a range of curriculum areas and difficulty levels, from Entry level 1 to Level 2. The attitude survey consisted of 17 statements to which the learners had to respond, again in multiple-choice format. The statements were based around three areas relating to numeracy: enjoyment, usefulness and difficulty of learning.
The intention was to observe each class between two and four times, although for various reasons this was not always possible. During 113 visits, researchers wrote a narrative account and completed detailed schedules recording each teacher’s pedagogical approaches.
Ethical considerations
We followed the guidelines of the British Educational Research Association (BERA, 2003; revised 2004). On visits to classes, we gave each learner an information sheet about the project (with contact details), stressing that participation was voluntary. We told them all names would be anonymised and they could withdraw from the project at any time.
4 243 is the number of learners who completed the attitude survey at T1 and T2 in both phases 5 One teacher was not interviewed due to technical difficulties
3 Teacher and learner characteristics
This chapter provides detailed background information on the teachers and the learners in the study.
3.1 Teacher profiles
Of the 34 teachers, 25 (74 per cent) were women and nine (26 per cent) were men. Eleven taught classes in Phase 1 only, 18 in Phase 2 only, and five taught classes in both phases. Background data on the teachers was collected through a short self-completed questionnaire.
The mean number of years of teaching experience in numeracy or maths was just over 13, while the vast majority of teachers reported experience of teaching on programmes at Levels 1 and 2 and GCSE and of learners over the age of 19. More than 66 per cent had experience of teaching in secondary schools and 24 per cent in primary schools.
Twenty-seven (79 per cent) of the 34 teachers reported having a formal qualification in mathematics or a related subject, such as science). Thirty teachers (88 per cent) reported having a teaching qualification. Six (18 per cent) of the teachers said they had the new Level 4 qualification for teaching numeracy to adults.
3.2 Learners’ profiles
Background data on the learners were collected through a short self-completed questionnaire, as shown in Tables 3.1 to 3.4 below.
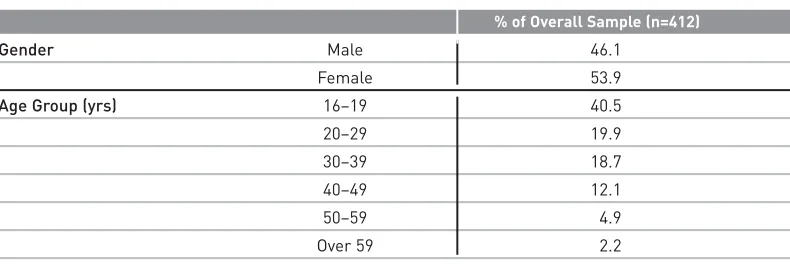
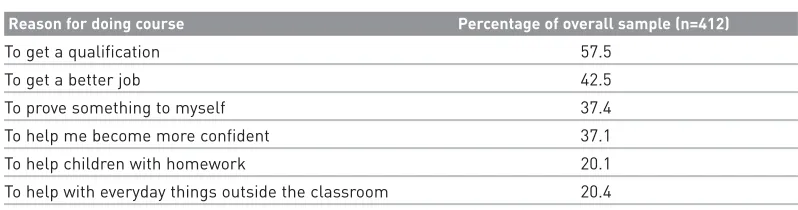
[image:16.842.198.593.732.866.2]Learners were fairly equally gender-balanced. They were of all ages but predominantly in the younger groups, with 40 per cent between 16 and 19.
Table 3.1 Learners’ background characteristics: gender and age
% of Overall Sample (n=412)
Gender Male 46.1
Female 53.9
Age Group (yrs) 16–19 40.5
20–29 19.9
30–39 18.7
40–49 12.1
50–59 4.9
Over 59 2.2
More than 40 per cent of learners reported their ethnic group as British, with the second largest group being Bangladeshi. Almost three out of five learners in the sample reported English as their first language. A variety of languages was reported as additional (second and/or third) languages7, including English, cited by 28 per cent of learners.
Table 3.2 Learners’ background characteristics: ethnicity and first language
Percentage of overall sample (n=412)
Ethnicity British 41.5
Bangladeshi 23.5
Asian other 7.3
Caribbean 6.4
African 5.4
Other 15.9
First Language English 59.0
Bengali 20.6
Other 20.4
[image:17.842.263.664.509.629.2]Forty per cent of the sample reported being in full-time education, and approximately 15 were employed full-time. Around one in 10 reported being permanently sick or disabled.
Table 3.3 Learners’ characteristics: occupational status
Percentage of overall sample (n=412)
Occupational Status Full-time employed 15.3
Part-time employed 11.9
Unemployed 10.4
Full-time education 40.8
Permanently sick/ Disabled 10.2
On Educational Maintenance Allowance (EMA) 8.5
Other 10.0
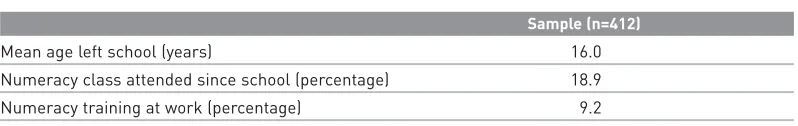
The average age learners left schools was 16. Almost 40 per cent of learners reported already holding at least one maths or numeracy qualification, with some previously having attended numeracy classes8.
Table 3.4 Learners’ characteristics: education and training
Sample (n=412)
Mean age left school (years) 16.0
Numeracy class attended since school (percentage) 18.9
Numeracy training at work (percentage) 9.2
In total, 93 learners (nearly 23 per cent of the sample) reported at least one factor that adversely affected their ability to learn. Dyslexia was most frequently mentioned, with around 7 per cent of the sample citing this.
3.3 Summary
The teachers were generally experienced and well-qualified, but this is perhaps not surprising given that they all volunteered to take part. Although there are some biases, inasmuch as there were a large number of Bangladeshi learners, overall learners covered a wide spread and may be more typical of the adult numeracy learner population.
[image:17.842.265.664.717.780.2]4 The learners and their experiences
This chapter is concerned with the learners’ experiences of learning numeracy from their point of view. It draws on qualitative data from classroom observations and narratives from in-depth interviews, which give an insight into the learners’ worlds.
Researchers conducted 61 interviews including 112 learners in 38 different settings, which represented just over a quarter of the total sample. A semi-structured interview schedule was used, which meant that researchers did not ask every learner exactly the same questions.
The data are organised under the following themes: the differences between learning numeracy as a child and adult; motivations for attending the course; attitudes towards numeracy; views about the course; and perceptions of what makes a good numeracy teacher. We have interrogated data using variables of gender, age (adult/16 to 19-year-olds) and level of the course learners were working at (Entry level / Levels 1 and 2), although we have not generally found any major differences between responses.
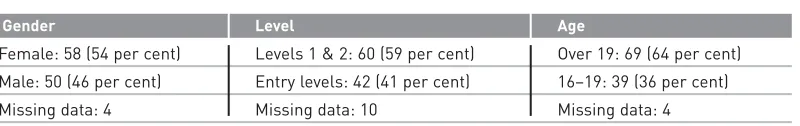
[image:18.842.198.598.590.653.2]The breakdown of the interview sample is as follows:
Table 4.1 The sample of learners interviewed
Gender Level Age
Female: 58 (54 per cent) Levels 1 & 2: 60 (59 per cent) Over 19: 69 (64 per cent)
Male: 50 (46 per cent) Entry levels: 42 (41 per cent) 16–19: 39 (36 per cent)
Missing data: 4 Missing data: 10 Missing data: 4
4.1 Differences between learning numeracy as a child and as an adult
Although many learners said they quite enjoyed their overall time at school, most found learning mathematics ‘boring’ or ‘difficult’. Therefore, many adults spoke of their feelings of anxiety about returning to learning to study numeracy, and most of these were women. However, not all learners had worries and this was particularly true of the 16 to 19-year-olds, who in many cases were, in effect, continuing at school, sometimes among their own peer group.
Many learners contrasted school tuition with their current experience of numeracy teaching, highlighting the smaller classes and the amount of individual attention: ‘I’ve probably had more individual attention learning maths than I’ve ever had before.’ Many learners also cited the relaxed atmosphere, their feelings of security and of not being afraid to make a mistake, the lack of pressure from teachers and peers, the feeling of making progress, and the generally stimulating level of work. Many learners told us that one of the best things about the course was that it was not like school; they also reminded us that they were making a choice, and that is the big difference from compulsory schooling. They also now had the motivation to learn.
A key theme that emerged from the learner interviews was that, where the teaching is good, learners begin to understand more about numeracy/maths, and with understanding comes enjoyment and greater confidence:
Anne: I understand more about maths, but also, Vicky has made me feel so confident about maths. I’ve never felt so good about maths, and for the first time ever I can now say I enjoy maths. And that’s quite a new, big, thing for me.
We speculate that increased confidence and greater levels of understanding are likely to lead to faster rates of learner progress.
4.2 Motivations for joining and continuing to attend the course
[image:19.842.263.662.549.654.2]The data in this section come from two sources. A questionnaire-type format was completed by 412 learners as part of their background information and a further subset of 90 also talked about their motivations in greater depth during interview.
Table 4.2 Learners’ reasons for taking current numeracy course
Reason for doing course Percentage of overall sample (n=412)
To get a qualification 57.5
To get a better job 42.5
To prove something to myself 37.4
To help me become more confident 37.1
To help children with homework 20.1
To help with everyday things outside the classroom 20.4
Because learners in the questionnaire were allowed to select more than one response, the figures do not total 100 per cent. Research has established that learners’ motivations for joining, and continuing to attend, numeracy classes are actually many, intricate and often overlapping (Ecclestone, 2003). Table 4.2 shows that most learners reported ‘getting a qualification’ as the main reason for doing a numeracy course, with ‘getting a better job’ being the second most popular response; clearly these two reasons are closely linked. When the reasons were broken down by age, we found that more than twice the number of adults over 20 said that they wanted to study numeracy to prove something to themselves; become more confident; or help with their lives outside the classroom, as against the 16–19 cohort. More obviously, more than three times the number of older adults cited helping their children over the younger group.
When asked the same question during interview, 90 learners gave reasons which turned out to be multiple and more complex than the quantitative analysis suggested. The major categories that emerged from the qualitative data were:
1. For myself: to improve knowledge of maths; keep my brain active; to fill in spare time; for enjoyment (25 responses)
2. To provide greater options, for either future study or employment (16 responses) 3. To get a qualification, either for a particular course or job (14 responses) 4. To give educational support to my children (14 responses)
5. To get a better job or to help with my current employment (12 responses) 6. Compelled to by employer (12 responses, including eight learners in the Army) 7. Numeracy is a compulsory part of another course such as literacy or IT (12 responses) 8. To help with everyday life outside the classroom (nine responses)
9. To prove that I can succeed and overcome feelings of embarrassment or lack of knowledge/ability (eight responses).
Some categories overlap and the number of responses was sometimes affected by interviewers’ queries.
Once again, there were differences between adults and those aged 16–19. In addition to the older adults saying that they wanted to study numeracy to help their children, many more adults also said it was for themselves; to prove to themselves they could succeed; and to help in everyday life. The 16 to19-year-old learners, however, tended to say that they did not have the choice to study numeracy. This was because their employers told them to, because numeracy was a subsidiary of another course, or because they were paid to attend through Educational Maintenance Allowances (EMAs).
It was almost exclusively female learners who cited the reason of helping their children; and it was mainly learners studying at entry level who said that they wanted to improve their maths and feel more confident with the basics.
Policy-makers often assume that a major reason why people ought to attend numeracy courses is to help them function more effectively in the outside world (see DfEE, 1999). This research, however, as with a previous study (Swain et al., 2005), suggests that this was perceived by learners as being a comparatively minor reason. Most learners said that they could get by with the maths they already knew, although this does not negate the possibility that they would be able to function more effectively after attending a numeracy class.
Researcher: Do you think you’ve got enough maths to get by in life?
Sarah: If I never come again, I would still be fine.
4.3 Attitudes and dispositions towards numeracy
Findings from the attitude survey (taken at T1 and T2) were even more positive: from a total sample of 243, a large majority reported that they enjoyed numeracy learning (78 per cent, n=190), and only 22 per cent (n=53) stated that they did not enjoy it. These figures remained broadly stable throughout the course, though there was a slight increase in those enjoying numeracy by the end. The same proportion of learners had a positive attitude towards the usefulness of maths (78 per cent, n=232).
It was noticeable that, during the interviews, more than one in four learners (27 per cent, n= 21) said that they were feeling more confident with maths now that they were on the course. This was also reflected in data from the attitude survey, where the most positive shift between the start and end of the course was towards the ease of learning numeracy. We would posit that this growing confidence was often linked to a deepening conceptual understanding that came from seeing connections once barriers had been lifted.
Researcher: So how did you useto feel about learning maths?
Jill: Boring.
Researcher: Why?
Jill: Didn’t understand it.
Researcher: What about now?
Jill: I love it. It’s a challenge.
Researcher: That’s fantastic.
Jill: It’s a challenge. It is like playing a game, and once you have learned the rules the game is easy to play.
Succeeding in what many learners perceive as being a high-status subject also increased self-esteem. It was like joining an elite club (see Dowling, 1998); as one learner put it, ‘it makes me feel like an educated person’. The point is further illustrated in the two quotations below:
Cilla: I feel equal. When I’m at work now I don’t still feel that I’m a second-rate person any more. I don’t feel that I have to prove myself any more.
Matt: To be able to do, like when you see maths, and to be able to do it, it makes me so proud, I am going somewhere. And I want to do more.
However, in some cases learners were also beginning to see maths in new ways:
Researcher: So has your attitude towards maths changed since you started doing the classes?
Sam: Oh yes, yes. Yeah, yeah. You think diff… You look at things differently and um, you know…
Sam: Yes. It’s just not all one straight line now, you … There’s so many different ways that I can do now, that I didn’t think I could.
4.4 Views on the course
Learners were asked about their general feelings towards the course, and what they considered to be their favourite and least favourite parts. They were overwhelmingly positive about the course, with more than 90 per cent (n=91) expressing a high level of satisfaction. Only two learners mentioned anything negative. Learners seemed to like most the relaxed atmosphere and the way they were treated as an adult; the individual help and attention; the friendliness of the other learners; working with, and helping other learners; the teacher and the way numeracy was taught; feelings of progress and achievement; and the improvement in their confidence and general self-esteem.
Learning numeracy itself was certainly important for the great majority. Some said that the best thing was ‘learning maths’; others stressed it was the sense of achievement they gained from it, and that they felt they were ‘getting somewhere’ and making progress.
4.5 Perceptions of what makes a good numeracy teacher
Effective practice is likely to be linked to perceptions of good teaching. We asked the learners to say, in general terms, what they thought makes a good teacher: ‘What would they be like?’ and ‘What kinds of things would they do?’ We also put the question the other way round: ‘What are the characteristics of a bad teacher?’ Many learners were very clear about the qualities they felt a good numeracy teacher should have.
Learners felt that the role of the teacher in the numeracy classroom was critical. Teaching consists of a series of relationships, and good relations between the learner and teacher were seen as crucial if effective learning were to take place.
Denise: Being able to get on with your tutor as friends, as well, makes it a hell of a lot easier. Because if you don’t like someone you don’t want to be there.
Learners also recognised that teachers needed to be competent if effective learning is to take place.
Paul: If you’ve got good teachers you’ll learn. But if you haven’t then you are not going to learn, are you?
Many learners also stressed that it was important that they were treated by a teacher as an adult, ‘who talks to you like you are a grown-up, not like you are stupid or whatever.’
■ Has good communication skills; explains things clearly using a number of different ways, including breaking concepts down into small steps (31 responses)
■ Has good relations with learners: respects learners; does not make them feel stupid; is approachable and listens carefully to their needs (25 responses)
■ Makes maths interesting by being imaginative and makes sure there is plenty of variety in each session. Does not lecture and talk too much (10 responses)
■ Gives individual help (seven responses)
■ Does not rush through the work (five responses) ■ Has a firm grasp of their subject (four responses).
Although ‘a firm grasp of their subject’ was not seemingly perceived by learners as being that important, it is implicitly connected to ‘good communication skills’ (which came top); after all, it is highly unlikely that a teacher would be able to ‘explain things clearly’ without secure subject knowledge. Learners also mentioned several personal qualities and traits which they thought were important. They wanted a teacher who was cheerful, had a sense of humour, was relaxed and easy-going and made them feel welcome. Above all, they wanted someone who was patient (18 responses).
Learners appreciated that at least some teachers were aware of the need to use a variety of resources, and that some used them in particularly imaginative ways. Other learners told us how much they liked playing games, including various sorting activities (‘I could have played it forever’), and how much they learned from them. Some learners complained that they grew bored when asked to regularly go through a series of worksheets.
Researcher: Is there anything you remember doing quite a lot of in class?
Dave: Worksheets.
Researcher: And how do you feel about that?
Dave: It’s good to a certain extent. But after a while… I don’t know if it’s the same with everybody, but after a while, if I just have sheet after sheet after sheet put in front of me, I just sit there and look at it, and lose my train of concentration. I just switch off, if I’m given sheet after sheet after sheet because there’s no variation in it.
Those learners we spoke to thought a poor teacher was someone who:
■ Does not explain work but just gives learners work and lets them get on with it (10 responses) ■ Is rude and abusive (nine responses)
■ Rushes through work, expecting learners to understand the procedure the first time (five responses)
■ Does not listen (five responses)
■ Does not show interest in their learners’ needs (four responses).
4.6 Summary
5 Learners’ progress
This chapter begins by considering the criteria used to measure learners’ progress. It then reports on the progress learners made. We describe relations between learners’ progress and their background characteristics (such as gender and ethnicity) and in relation to their teachers’ characteristics (such as their teaching experience and level of qualification). After reporting learners’ attitudes, and the changes that occurred, the chapter ends by considering the relationship between learners’ attitudes and the characteristics of teachers and learners.
5.1 What counts as progress?
Learners’ average progress in each class, as measured by the average gain in their scores on the assessment instrument between T1 and T2, is used to judge the effectiveness of teaching and learning in this and the other NRDC effective practice studies, as it was in the study on which these projects are based (Condelli, 2001). However, it is important that our findings on learners’ progress are not over-interpreted. For instance, for some (including older adults, adults with specific learning difficulties or those with poor memories), to simply maintain their level of skills in numeracy rather than falling back is itself a sign of personal progress (Schuller et al., 2002). We also know that regress is an effect of time out of work for many people (Bynner and Parsons, 1998) and learners may be particularly vulnerable to regress if they are not regularly using the skills assessed in the study outside the classroom.
It should be noted that there are ways of monitoring progress other than gains in attainment on a standard instrument. For instance, using a more detailed customised assessment for each class which was more closely linked to the curriculum taught, monitoring changes in learners’ actions in the classroom, or asking the learners themselves (see Sections 4.4–4.6). These separately or in combination may have provided a more accurate picture.
We are also aware that our chosen assessment instrument was not as valid and reliable as we would have liked in assessing progress, especially among the full range of learners in our study. We needed to find items which had already been trialled reasonably successfully with a comparable sample, assembled into a test which was sensitive to learning on a small
timescale, but which also covered a wide range of learners and could be administered quickly and efficiently in different settings without taking too much time away from, sometimes limited, teaching time. It proved difficult to satisfy these different requirements
simultaneously and we believe that the degree of sensitivity achieved in accurately measuring gains in learning is considerably less than we would ideally have wanted (see also Section 8.2).
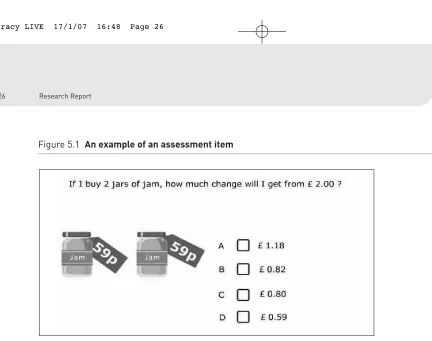
Figure 5.1 An example of an assessment item
Researchers administered the test and were able to read or explain the meaning of questions for ESOL learners or those with language difficulties. Calculators were available on request but were seldom used. Tests took about 30–40 minutes, but learners were often free to take longer.
5.2 Gains in numeracy attainment measured between two time points
Of the 412 learners in both phases of the study, 250 completed an assessment at both time points, towards the beginning and end of their numeracy course. This represents a retention rate of 60.5 per cent. Not all of the learners absent at T2 had left the course; some were simply absent on the day of the assessment. In this section we are presenting data only on learners assessed at both time points.
This group of 250 was compared with the 162 assessed at T1 only in terms of a range of background characteristics to establish that the two groups did not differ significantly. If that were the case, the assessment data shown below could have been biased. The two groups were compared by gender, age group, age they left school, qualifications held and factors affecting learning, as well as by their T1 assessment score. There were no significant differences between the groups in any of these variables.
The total percentage scores and standard deviations on the test for the 250 learners who completed the assessment tests at both time periods (T1 and T2) are presented in Table 5.1 below. (The same test was used at both times.)
Table 5.1 Learner assessment data
T1 T2 Gain
Mean % score S. D. Mean % score S. D. Mean % gain S.D. Effect size
Phase 1 (n=85) 43.8 24.8 51.6 26.7 7.8* 16.5 0.31
Phase 2 (n=165) 45.5 19.5 55.6 23.2 10.1** 17.06 0.52
[image:26.842.195.597.855.921.2]It can be seen from the table that there was approximately an average 9 per cent gain between the two time points across all learners in Phases 1 and 2. The mean gains are statistically significant with reasonably high effect sizes, and in a test with 20 items it is equivalent to an average learner being able to answer correctly two additional questions in the final test administration. This is perhaps more significant than it sounds, as there were only four questions at each of the five levels. This increase might be thought to be due to a testing effect, given that the same test was used both times. It is true that the learners were clearly more familiar with the form of the test on the second occasion, but generally we feel that the two events were so far apart in time, usually with a gap of seven or eight months, for it to be unimportant that the items were the same.
The average number of teaching hours learners received between T1 and T2 was 39. However, there was also no correlation between number of hours attended and the gain in score between T1 and T2 (Spearman’s rho= –0.03, p= 0.7). This finding seems counter-intuitive and inconsistent with other research results. However, this may reflect particular circumstances. For example, one of the shortest courses, the week-long course run by the Army, was also very intensive and there was strong pressure on learners to succeed in the test at the end of the week. In contrast, some learners who had difficulty in learning joined two numeracy courses and so the number of hours attended was extremely high, without any compensating gain. The finding also seems inconsistent with the smaller average gains made in Phase 1, where the time elapsing between tests, and the number of attended hours between them, was smaller. However, the reduction in gains in Phase 1 may be because the first test was some way into the course in many cases, and hence we may have lost the benefit of large rises in the early weeks of the course, when learner confidence and regained familiarity with mathematics are both likely to be growing quickly.
In interpreting results such as these we need constantly to bear in mind the difference between correlation and causation. For example, longer learning time would be expected to cause greater progress, and the difference between Phase 1 and Phase 2 results supports that, but there may be other underlying associations which explain the lack of correlation. Conversely, a significant correlation between a type of teaching approach and gains made does not necessarily suggest that the approach causes the gains; both may be associated with a third factor.
Table 5.2 shows the mean gains made by each class; these are shown in rank order within each phase. These are presented like this so that the wide distribution of mean gains in each class can be appreciated. For example, it can be seen from Table 5.2 that there is a large spread in the mean class gains, with the largest at more than 30 per cent and the lowest at –13. The table also indicates the relatively small number of learners in many classes present to be tested on both occasions.
Table 5.2 Mean gain of classes in Phases 1 and 2 in rank order
Phase 1 classes Phase 2 classes
Rank Mean gain Number of Rank Mean gain Number of
order % learners order % learners
assessed assessed
1 27.04 9 1 32.50 5
2 13.89 6 2 31.11 6
3 13.34 5 3 23.33 5
4 12.50 6 4 20.00 2
5 9.52 7 5 17.86 7
6 5.56 6 6 16.54 13
7 4.17 4 7 15.56 3
8 3.67 5 8 14.81 9
9 3.18 11 9 14.17 2
10 2.17 10 10 12.50 12
11 1.25 4 11 10.56 3
12 1.15 2 12 10.33 5
13 - 0.33 2 13 9.58 4
14 - 0.67 5 14 9.44 3
15 - 2.77 3 15 9.05 7
16 8.89 6
17 7.08 4
18 6.67 3
19 6.33 5
20 6.30 9
21 6.21 11
22 4.44 3
23 3.97 13
24 3.75 4
25 2.33 5
26 1.11 3
27 -1.11 6
28 -4.44 3
29 -12.78 3
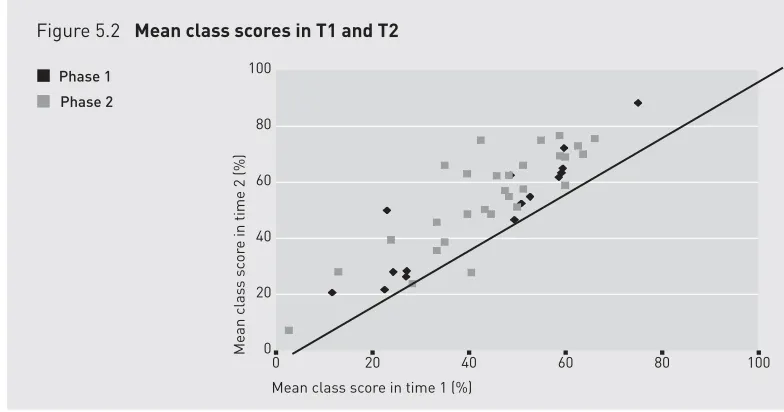
The scatterplot (Figure 5.2) illustrates the mean scores for each class in the two administrations of the test, at times T1 and T2. The diagonal y=xline is drawn in for the scatterplot: any class with a data-point on the line had the same mean score both times the test was taken. The further the point is along the line away from the origin, the greater the scores in both test administrations. Any class above this line had a positive gain in the mean class score between T1 and T2, while classes below it had a negative mean gain (the mean class score was lower at the later time T2 than it had been at T1). The further the data-point is away from the y=xline and above it, the greater is the gain, and the greater the distance below the line, the greater the loss.
The points corresponding to most classes lie in a narrow band just above the line, indicating similar small gains, whatever the initial mean score at time T1.
5.3 Relationship between attainment gains and learners’ and teachers’ background characteristics
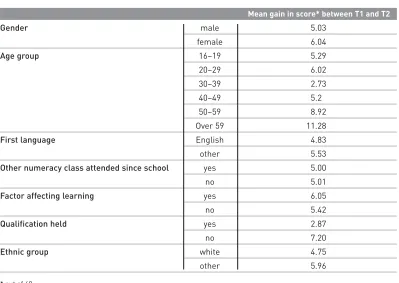
[image:29.842.263.655.450.656.2]A series of univariate analyses (one-way ANOVAs, see Glossary) was carried out first to investigate if any learner characteristics were related to amount of progress made (as measured by gain in scores between T1 and T2). The following variables were examined: gender, age group, first language, ethnic group, having attended another numeracy class since school, reporting a factor affecting learning and formal qualifications held. Table 5.3 below shows the mean gains in scores for each variable, as well as whether the differences are statistically significant. It can be seen that females made on average larger gains than males and that the 30–39 and 40–49 age groups made the smallest gains on average. Learners from non-white ethnic backgrounds also had larger gains. The only statistically significant difference found was that learners who said they lacked a formal qualification in maths made greater progress. There was no correlation between the age participants left school/full-time education and the magnitude of the gain in scores between T1 and T2 (rho= –0.04, p= 0.4).
Figure 5.2 Mean class scores in T1 and T2
Phase 1 Phase 2
0 20 40 60 80 100 100
80
60
40
20
0
Mean clas
s
sc
or
e in time 2 (%)
Table 5.3 Mean gains for different groups of learners
Mean gain in score* between T1 and T2
Gender male 5.03
female 6.04
Age group 16–19 5.29
20–29 6.02
30–39 2.73
40–49 5.2
50–59 8.92
Over 59 11.28
First language English 4.83
other 5.53
Other numeracy class attended since school yes 5.00
no 5.01
Factor affecting learning yes 6.05
no 5.42
Qualification held yes 2.87
no 7.20
Ethnic group white 4.75
other 5.96
* out of 60
The above variables were also entered into a regression model to see whether they could significantly predict progress in numeracy in combination, but no significant results were found.
We also explored differences in progress in terms of the reasons learners had stated as their main motivation for doing the course, given as part of their background information (see Section 4.3). As participants could select more than one such reason, these had to be treated as separate variables. The only statistical difference found was between learners who stated that they wanted to become more confident as opposed to those who did not. The former group had a mean gain of eight points, while the latter had a mean gain of four points. This difference was significant at p<0.05. Another large difference was between learners who stated that they wanted to get a better job and those who did not. Again, the former group made more progress (mean gain of just under eight points) compared to the latter (mean gain of four points). This difference approached but did not reach statistical significance (p= 0.06).
Finally, there were no significant correlations between any of the teacher characteristics we measured and the progress of the learners in their class. As explained in Section 3.3, these characteristics included years and type of teaching experience, and teaching and maths qualifications held. This may seem counter-intuitive, but it mirrors other findings about primary teachers and progress in numeracy. For example, it was shown by Askew et al. (1997) that there was not a strong relationship between teachers’ formal mathematical qualifications and the depth of their understanding of basic mathematical ideas, although the
5.4 Differential gains for different levels and areas of mathematics
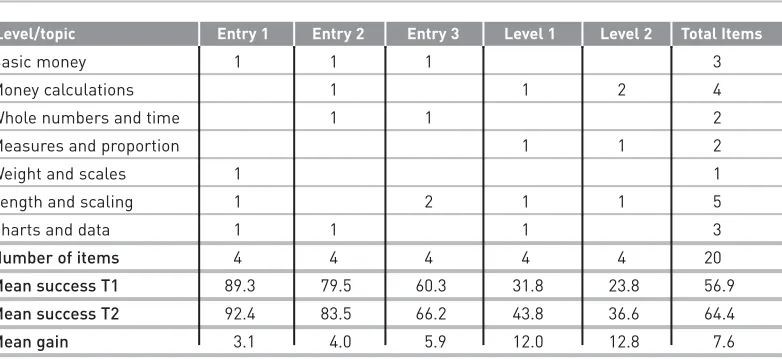
[image:31.842.270.661.474.654.2]Table 5.4 shows the distribution of the items within the assessment in terms of the topics and levels they covered (using the Skills for Lifeclassifications). It also shows the initial success rate of learners at T1 for the items in each level and the progress they made at T2. As we have already stated, gains were generally smaller for Phase 1, perhaps because of the shorter time period between T1 and T2 (see Table 5.1). However, the trends in the gains are similar for both groups, and the gain sizes overlap as shown in Table 5.2, so the data from both phases has been combined in Table 5.4 to increase the sample size. The overall mean gain per item was 7.6 per cent, indicating that on an average item nearly 8 per cent more learners were successful at the end than at the start.
Table 5.4 Number of items in each level and topic with success rates for each level at T1 and T2 and the gain
Level/topic Entry 1 Entry 2 Entry 3 Level 1 Level 2 Total Items
Basic money 1 1 1 3
Money calculations 1 1 2 4
Whole numbers and time 1 1 2
Measures and proportion 1 1 2
Weight and scales 1 1
Length and scaling 1 2 1 1 5
Charts and data 1 1 1 3
Number of items 4 4 4 4 4 20
Mean success T1 89.3 79.5 60.3 31.8 23.8 56.9
Mean success T2 92.4 83.5 66.2 43.8 36.6 64.4
Mean gain 3.1 4.0 5.9 12.0 12.8 7.6
A significant correlation was found between the difficulty of the question, as measured by the proportion answering it correctly at T1, and the gain between T1 and T2 in the number of people answering correctly. As the difficulty of the question increased, so the gains made increased (n=20, rho = 0.87). One reason for small gains in the Entry level 1 and 2 items is the high proportion of learners who answered correctly in the first assessment, so there was little room for progress in these items. The other reason for the higher gains in Levels 1 and 2 items is that 18 groups were aiming at Levels 1 and/or 2, and just 10 were aiming only at Entry or Pre-Entry levels (the remaining 17 were mixed). Moreover, Entry-level classes generally contained fewer learners. Once the level is controlled for, there were no clear differences in gain between the different mathematical topics.
We went on to investigate whether the learners with higher test scores in the first
5.5 Changes in learners’ attitudes
A total of 415 learners completed the ‘attitude to numeracy’ questionnaire at T1 and 254 at T2, with a total of 243 learners completing it at both time-points over the two years of the project. Statistics in this section therefore refer to those 243 learners, unless otherwise specified.
From the 17 statements, learners had to tick one of four options from ‘strongly disagree’ to ‘strongly agree’. The questionnaire was designed to include statements relating to usefulness, enjoyment and difficulty of learning numeracy. Again, it is not clear that the instrument, because of limits on length, could be sufficiently valid and sensitive to accurately monitor changes in attitude, of the type noted in the report of qualitative data in Chapter 4.
A factor analysis of the items in the questionnaire did not yield any stable or interpretable factors. Reliability coefficients (Cronbach’s alpha) were quite high, 0.77 and 0.80 respectively for T1 and T2, suggesting that the instrument was a measure of one underlying factor, of positive or negative feelings and attitudes towards mathematics/numeracy. We have therefore analysed the data from the attitudes instrument in two ways and present them separately below. First, we treated the 17 items in the instrument as forming one ‘attitudes’ variable; second, we split the items into three groups, corresponding to the three sub-scales: enjoyment, usefulness and difficulty. This grouping was theory-led rather than data-driven, given the inconclusive results of the factor analysis referred to above.
Analysis of overall attitude scores
Scores on the single unidimensional scale could range from a minimum of 17 (indicating a very positive attitude to numeracy) to a maximum of 68 (indicating a very negative attitude). Table 5.5 below presents descriptive statistics of this attitudes score at both time points (combining data from Phases 1 and 2). The average score on the scale was slightly lower at the second time point, which indicates that attitudes were on the whole more positiveat the end of the course than at the beginning. Although numerically small, this gain was significant,
t (242) = 2.47, p= 0.01.
Table 5.5 Descriptive statistics for attitude scale
Mean score Standard deviation Cronbach’s alpha
T1 37.4 6.6 0.77
T2 36.4 6.8 0.80
The correlations between attainment and attitude scores, at both time points, were weak and non-significant, as was the correlation of gains in assessment and attitude scores. These seem surprising findings; one might expect that those with higher scores would be more positive about mathematics and that learners demonstrating a positive change in attitudes would make most progress. It may have been that the attitude survey was not capable of detecting the increased confidence and enthusiasm for mathematics that we experienced in interviewing some learners. Furthermore, there is often a complex relationship between attitude and attainment; for example, in international comparisons of mathematical
forward very slowly and concentrate on consolidation do help to boost confidence, a key factor for many adults, and hence raise attitude scores, but do not necessarily achieve large
measured gains in attainment.
Analysis of attitude sub-scales
As explained above, the 17 items of the attitude questionnaire were also divided into three groups, according to the particular aspects of attitudes towards numeracy they intended to measure, namely perceived usefulness (seven statements), enjoyment (five statements) and difficulty (five statements). There were small changes in all three dimensions, all in the expected direction; that is, learners found numeracy more useful, more enjoyable and less difficult at the end of the course. The change between scores at T1 and T2 on the sub-scale of difficulty was also statistically significant, t (242) = 2.91, p<0.01. This suggests that learners came to see numeracy as a little less difficult as a result of their course.
5.6 Relations between learners’ attitudes and their characteristics
To see whether there were any significant differences between different groups of learners, we examined the attitude data according to gender, age and ethnicity. No statistically significant differences were found between female and male learners. However, learners aged 20 or older did have a significantly more positive attitude towards numeracy learning than those aged 16–19 both at the start and the end of the course, F (5, 229) = 4.08,
p<0.001.
It was also found that, at the start of the course, those from non-white ethnic backgrounds had a significantly more positive attitude towards numeracy learning than those from white ethnic backgrounds, t (239) = 2.95, p<0.01. By the end of the course, though, this difference was no longer significant, indicating that the attitude of learners from white ethnic
backgrounds had improved more.
5.7 Summary